At Locus, our Environmental Information Management (EIM) system stores an extensive array of data: locations, field samples, chain of custody, lab samples, analytical results, borehole and well information, field measurements, automated measurement data, groundwater elevations, and much more. Our clients manage tens of millions of data records, and while we provide numerous modules for extracting and generating reports and charts, there are times when users need to quickly filter through specific data. To support these needs, we’ve developed dynamic React interfaces that allow users to refine their searches and hone in on the exact information they require.
React is a powerful JavaScript library for building user interfaces (UIs). It enables developers to create reusable UI components, manage application state efficiently, and update the UI in response to user actions or data changes. React’s component-based architecture is ideal for building complex, interactive UIs, as it allows developers to break the interface into smaller, manageable pieces. One of its standout features is conditional rendering, which displays different UI elements based on the user’s selections, making it perfect for interactive filtering of environmental data.
Simplifying Analytical Data Filtering
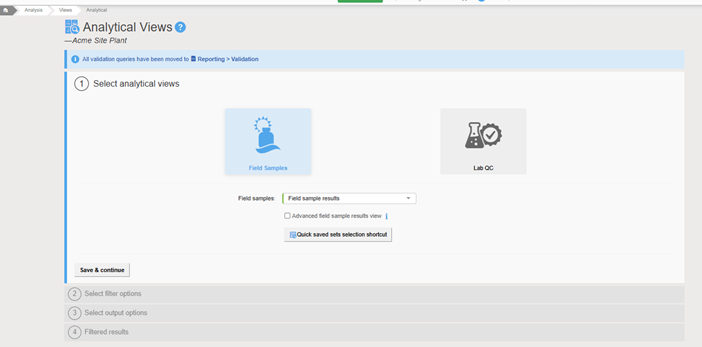
The EIM interface for filtering analytical data is seamlessly contained within a single React application. This interface opens and closes panels on one page, guiding users through the filtering process step-by-step. The user starts by selecting the data type they want to filter, such as field sample data or lab QC data. As the user makes selections, the query is dynamically built, and subsequent panels and options are updated based on prior choices.
For example, if the user selects Field Sample in Panel 1, the resulting query will automatically filter the main field sample results table. After saving the selection in Panel 1, Panel 2 opens, displaying a summary of the chosen options. Panel 2 presents additional filtering options tailored to the data type selected in Panel 1. Users can then refine their selections by choosing parameters like individual parameters, parameter groups, analytical methods, or analytical groups, with available options displayed dynamically.
Once the user selects a filter, they can narrow down their results further by refining the date range. Additional filters can then be applied, such as location groups, sample types, or sampling programs. Only the relevant filter options are presented based on previous selections, such as filtering location groups based on the selected date range and parameters. This makes the filtering process much more manageable by eliminating irrelevant choices and narrowing the options down to a meaningful subset.
From a technical perspective, React makes it easy to create dynamic filtering interfaces directly from data. We use tables to populate the available filter options and determine which elements should appear on each panel. AJAX calls are employed to refresh data after each selection, ensuring that only the most relevant options are presented. Adding new filter options or modifying existing ones is a straightforward process, providing flexibility for future updates.
Custom Output and Saved Data Sets
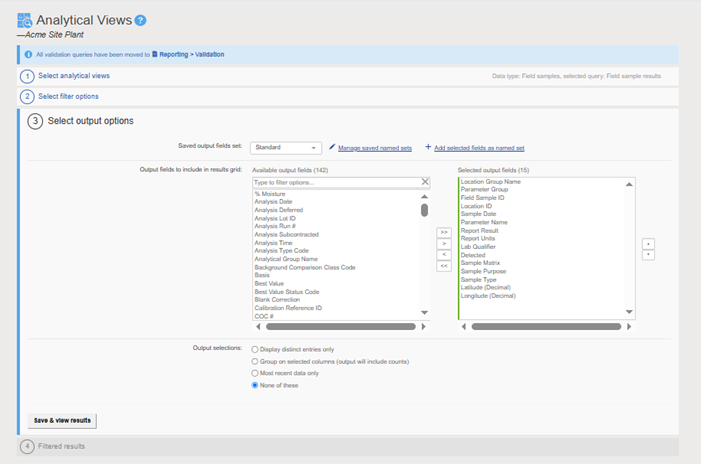
Once the filter options are set, Panel 3 presents the output options, including the columns to display in the filtered results. Users can choose from a standard set of columns or use custom saved configurations. Additional display options allow users to view distinct entries, group results with counts, or show only the most recent data. After making these final selections, Panel 4 displays the results in a grid, which can then be exported to Excel, CSV, or text files.
Throughout this process, users can save their data set configurations and easily reload them in the future to bypass the filtering steps and go straight to the results. At any point, users can also reopen any panel, make adjustments, and save their new selections to refine the query and output.
Using React for this interface offers numerous benefits, particularly when it comes to providing flexible filtering and display options within a single interface. The modular nature of React allows Locus developers to easily add new filter options and tailor the interface to suit specific user needs. With React’s efficient rendering and dynamic data handling, we can ensure that users can quickly and accurately pare down their analytical results to the desired dataset.
React’s component-based approach not only makes it easier to build and manage complex filtering interfaces, but it also enhances the user experience by providing quick data access, making the process of analyzing environmental data smoother and more efficient.
Locus is the only self-funded water, air, soil, biological, energy, and waste EHS software company that is still owned and managed by its founder. The brightest minds in environmental science, embodied carbon, CO2 emissions, refrigerants, and PFAS hang their hats at Locus, and they’ve helped us to become a market leader in EHS software. Every client-facing employee at Locus has an advanced degree in science or professional EHS experience, and they incubate new ideas every day – such as how machine learning, AI, blockchain, and the Internet of Things will up the ante for EHS software, ESG, and sustainability.