The Promise and Challenge of an AI Chatbot for Environmental Data Management
Locus Technologies continues to explore new frontiers such as a “natural language” AI chatbot for data stored in Locus software.
Locus Technologies continues to explore new frontiers such as a “natural language” AI chatbot for data stored in Locus software.
At Locus, we are constantly exploring innovative ways to visualize and analyze large datasets, empowering users to derive insights with ease.
There is a need for most water entities to centralize data, and more easily load, share, analyze, and report data. Locus Technologies’ customizable software makes scheduling and collecting routine water samples is made easy by using Locus Mobile and EIM. Below is a list of frequent challenges that customers have encountered during their water sampling process and how they can be solved using the right tools from Locus. or better communications.
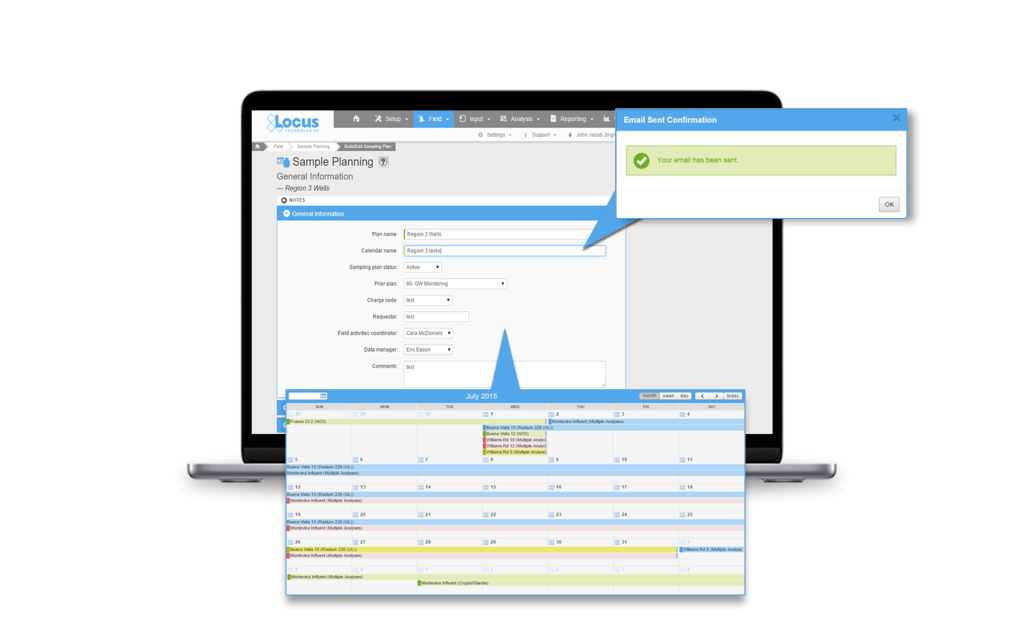
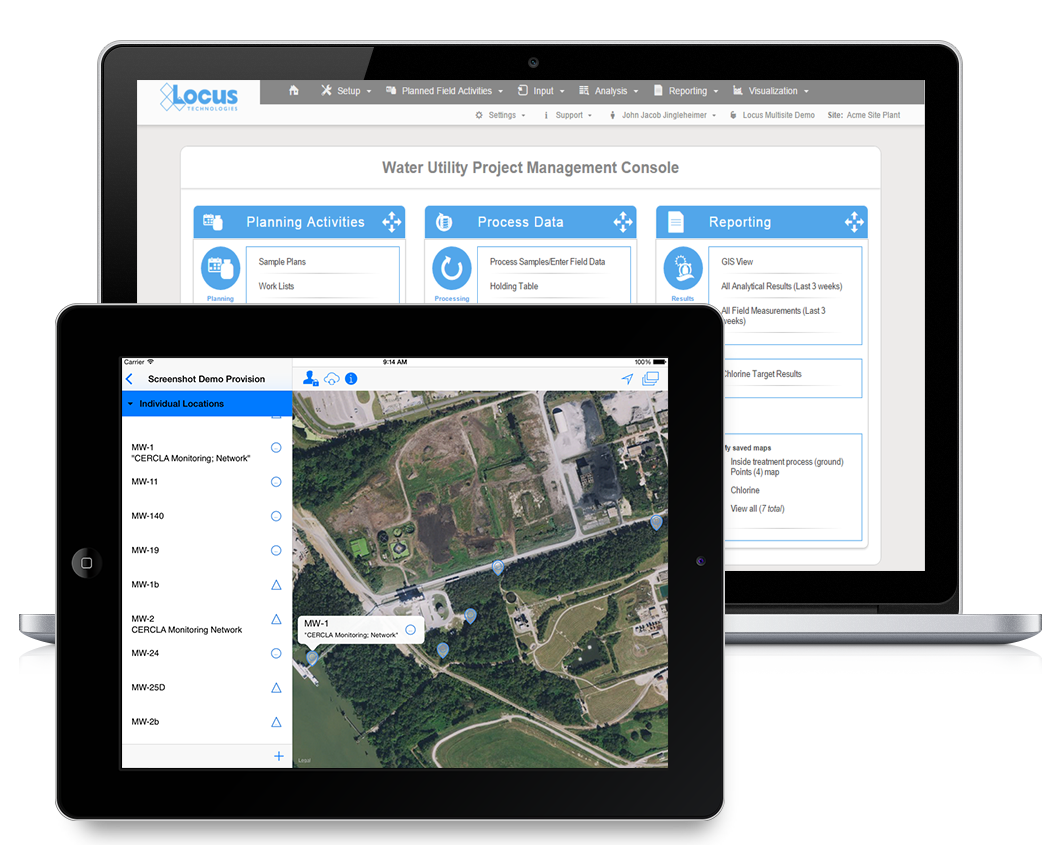
Planning tools need to allow flexibility in terms of different sampling intervals and date ranges, different field and analytical parameters, and account for location grouping. Using a well-designed application can pull together all of this detailed information and can provide a summary view of the individual samples. A manager can easily view sample status, and whether the sample is complete, in process, or planned. A well-designed application can also generate the chain of custody (COC), and lab and sample shipping date information and labels per sample, which is a huge time saver. This type of sample tracking detail seemed to be very useful to many conference attendees to help ensure they are in regulatory compliance with required sampling frequencies. A key feature to look for is an application that is flexible enough that it can allow one-time, unplanned sample events such as water main breaks, customer complaints and schedule changes, and can handle complex multi-year routine sampling with ease. As a plus, it’s easy for you or your manager to know where you stand at any time.
Data entry errors and fixing bad data when it was transcribed from field notes to Excel or other programs is a persistent problem with the old way of doing things. Your company needs a better way to streamline the error prone data collection process. Many clients are interested in an alternative to the pencil/paper/clipboard method and had goals to move to tablet or smartphone for data collection. The universal wish list for mobile field applications included:
Everyone is aware that software updates all the time. Sometimes its security enhancements and sometime feature enhancements or bug fixes. A source of frustration is getting a software update and not knowing what was updated or how best to incorporate a new feature/enhancement into their established process. There was also concern for impact to an established routine with field crews that were used to the existing way of doing things. Even if a functionality improved the workflow, enhancements are only valuable to a user if they understand how to use them and how to incorporate them into their existing process.
Mobile applications, which appear very simple to the users, are in reality complex software and require careful integration with the receiving database for a range of complex use cases. This makes rolling out new mobile features challenging for both the developers and the users. Enhanced customer/developer communication along with a sandbox environment can go a long way towards solving some of the inherent issues with rapid innovations and updates associated with cloud and mobile software.
Software tools are available and can solve a lot of the common data management challenges, but know what you want, know the problem you are trying to solve and know it will take some time and effort, but the end result will significantly improve your business processes. Though these challenges are present when choosing a software, Locus Technologies has the experts to help you hurdle the challenges to find the solution that is best for your business.
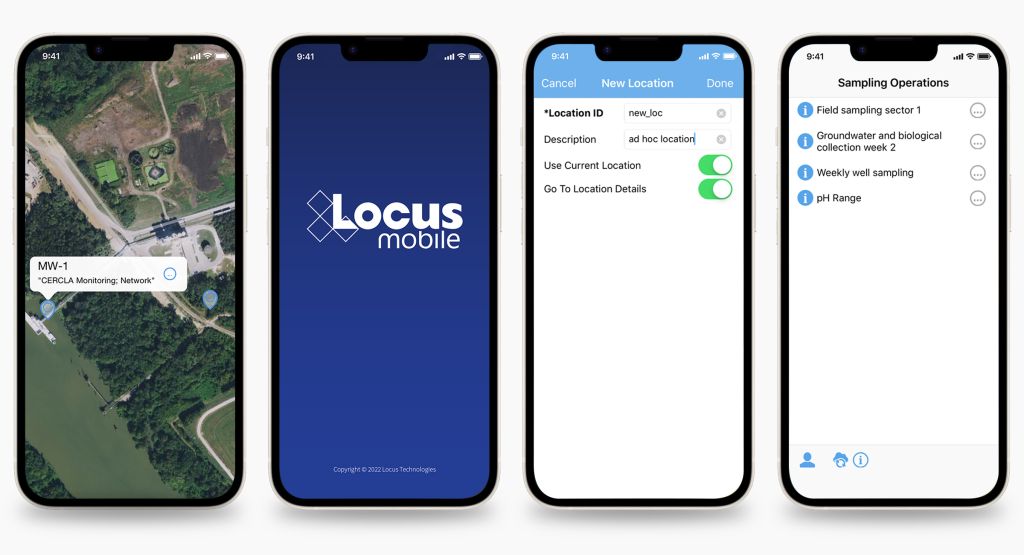
Tracking your data is made easy within our software as a service (SaaS), Locus Platform (LP). Your company can take advantage of LP’s mobile-aware browser functions, giving you the capability to do all your fieldwork with your existing phones or tablets. When cellular connections are unavailable or unreliable, Locus also has a Mobile app which supports the offline capabilities you need to keep your workflow going.
Regardless of your mobile approach, each mobile form can be easily configured to capture the data you require in the field such as photos and the sampling results.
Whether in the office, or out in the field, Locus Technologies is with you every step of the way during the tracking process. Contact us to find your solution.
![]()
There are two promising technologies that are about to change how we aggregate and manage EHS+S data: artificial intelligence (AI) and blockchain. When it comes to technology, history has consistently shown that the cost will always decrease, and its impact will increase over time. We still lack access to enough global information to allow AI to make a significant dent in global greenhouse gas (GHG) emissions by merely providing better tools for emissions management. For example, the vast majority of energy consumption is wasted on water treatment and movement. AI can help optimize both. Along the way, water quality management becomes an add-on app.
AI is a collective term for technologies that can sense their environment, think, learn, and act in response to what they’re detecting and their objectives. Possible applications include (1) Automation of routine tasks like sampling and analyses of water samples, (2) Segregation of waste disposal streams based on the waste containers content, (3) Augmentation of human decision-making, and (4) Automation of water treatment systems. AI systems can greatly aid the process of discovery – processing and analyzing vast amounts of data for the purposes of spotting and acting on patterns, skills that are difficult for humans to match. AI can be harnessed in a wide range of EHS compliance activities and situations to contribute to managing environmental impacts and climate change. Some examples of applications include permit interpretation and response to regulatory agencies, precision sampling, predicting natural attenuation of chemicals in water or air, managing sustainable supply chains, automating environmental monitoring and enforcement, and enhanced sampling and analysis based on real-time weather forecasts. Applying AI in water resource prediction, management, and monitoring can help to ameliorate the global water crisis by reducing or eliminating waste, as well as lowering costs and lessening environmental impacts. A similar analogy holds for air emissions management.
The onset of blockchain technology will have an even bigger impact. It will first liberate data and, second, it will decentralize monitoring while simultaneously centralizing emissions management. It may sound contradictory, but we need to decentralize in order to centralize management and aggregate relevant data across corporations and governmental organizations without jeopardizing anyone’s privacy. That is the power of blockchain technology. Blockchain technology will eliminate the need for costly synchronization among stakeholders: corporations, regulators, consultants, labs, and the public. What we need is secure and easy access to any data with infinite scalability. It is inevitable that blockchain technology will become more accessible with reduced infrastructure over the next few decades. My use of reduced architecture here refers to a replacement of massive centralized databases controlled by one of the big four internet companies using the hub-and-spoke model concept with a device-to-device communication with no intermediaries.
This post was originally published in Environmental Business Journal in June of 2020.
In providing water quality data management software to organizations serving millions of customers a day, our experts have found some common red flags in alternative solutions. Many alternatives to Locus are more prohibitive than helpful, leading to more issues than they should. Your organization deserves to reduce the stress of data entry, regulatory and voluntary reporting, and more. Here are the top 5 signs that your organization is using outdated water quality software:
In order to ensure the highest level of data quality, you should not be risking human error at multiple levels. Enter your data once, and have it audit-ready, set to go on regulatory and voluntary reports, which are created directly from Locus Software.
Support doesn’t end after implementation. What we often hear from our customers when they switch from other providers is that they are delighted with the level of support that Locus brings with our software. Locus is proud to have the expertise and experience to back our software, and if there is anything you need, you can be sure that Locus support can get it done smoothly.
You need reliability. Your software should be available to you on-demand. Locus is proud to be the only environmental software developer to publicly share our uptime, which is over 99.9%. If you are experiencing downtimes at inconvenient times or for long periods, you should switch.
Field collection is key for most organizations managing water quality data. You should be able to enter that data into your system once, and from anywhere, reducing errors and extra time doing the same work twice (or more!). Also, being able to access historical data at your fingertips can help you solve problems on the fly.
Sure, you may have all of your data collected, but what are you doing with it? If your software is not giving you meaningful findings from analyzing your data, then you are always going to be playing catch-up. Having the tools to help your organization look forward is essential in selecting water data management software.
Attention all water providers: the EPA’s UCMR 5 list includes 30 contaminants (29 PFAS and lithium) that both small and large water systems have to test for and report. Can your current environmental solution handle it?
Locus EIM environmental software can handle new chemicals and analyses seamlessly. Both the standard Locus EIM configuration and the Locus EIM Water configuration (specially tailored to water utilities) are built with ever-changing regulations in mind.
We’ve put together some helpful background and tips for water providers preparing for UCMR 5 monitoring.
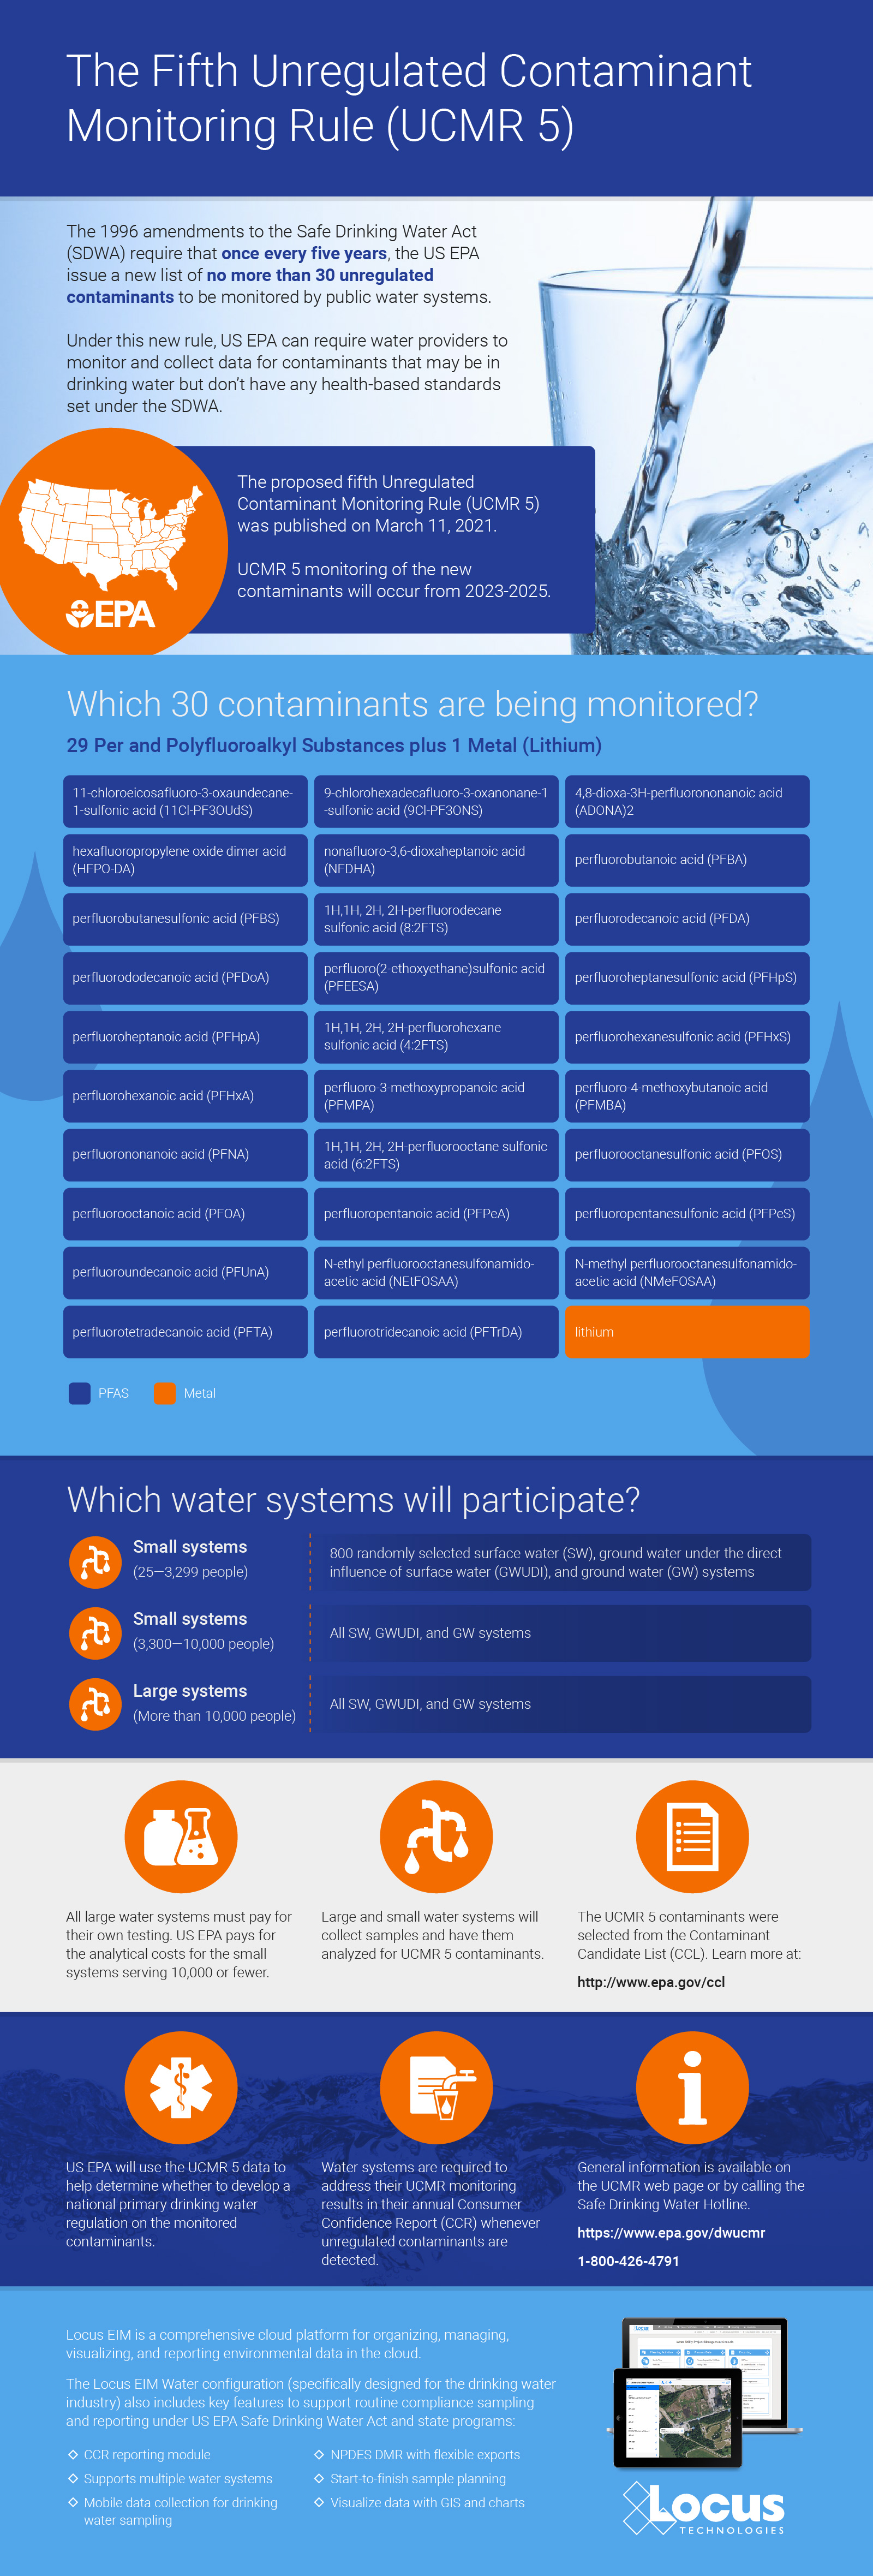
In 1996, Congress amended the Safe Drinking Water Act with the Unregulated Contaminant Monitoring Rule (UCMR). Under this new rule, US EPA can require water providers to monitor and collect data for contaminants that may be in drinking water but don’t have any health-based standards set (yet) under the SDWA.
More than 150,000 public water systems are subject to the SDWA regulations. US EPA, states, tribes, water systems, and the public all work together to protect the water supply from an ever-growing list of contaminants.
However, under the UCMR, US EPA is restricted to issuing a new list every five years of no more than 30 unregulated contaminants to be monitored by water providers.
This helps reduce the burden on water providers, since monitoring and testing for the existing long list of regulated contaminants already requires a significant investment of time and resources.
Throughout the course of this monitoring, US EPA can determine whether the contaminants need to be officially enforced— but this would require regulatory action, routed through the normal legislative process.
Contact your Locus Account Manager for help setting up your EIM database in advance of your sampling schedule, and we’ll make sure you’re equipped for UCMR 5!
Not yet a customer? Send us a quick note to schedule a call or a demo to find out how Locus software can completely streamline your water sampling and reporting.
More helpful links:
Becoming water positive is a more difficult task than becoming carbon positive. Both in practice and in tracking complex water data. Less than a decade ago, experts questioned if it was even feasible to have a net-positive impact when it comes to water. Perhaps the biggest reason for the difficulty with water is a relative volatility when compared with carbon. Seasonal environmental changes in rainfall, as well as droughts and floods, effectively make water consumption a non-zero-sum game. And with water, quality is more important than volume. Today, companies and organizations are believing that goal a more attainable one.

Organizations are now shooting for a goal that will create a net-positive impact on volume and quality. Recently, Microsoft announced their goal of becoming water positive by 2030. Their goal is not only impressive, but it is complex and multi-faceted. They plan to achieve more freshwater collection, lower consumption, working with various agencies and NGOs on regulatory changes, and perhaps most importantly digitizing their water data.
Why is this goal so important? Almost a third of the world’s population, over 2.2 billion individuals, lack access to safe and clean water. With potential chronic shortages becoming more common and increased demand being more likely, the need for fresh water will be more drastic as time goes on. Organizations aiming for water positivity will lessen the momentum of water becoming less available.
Where does Locus come in? We can’t solve a problem that we can’t understand. With Locus software, companies and organizations can accurately track and report complex ground and surface water data. Our calculation engine can deliver real-time estimates of supply and demand and our water quality software can manage sample planning and configure notifications for late or missing samples or exceedances in pre-defined limits. Our water quality solutions, long used by utilities like San Jose Water Company and Santa Clara Valley Water, can also help businesses achieve a greater perspective on their water consumption, providing the tools to allow them to become water positive.
At the annual WM Symposia, representatives from many different DOE sites and contractors gather once a year and discuss cross-cutting technologies and approaches for managing the legacy waste from the DOE complex. This year, Locus’ customer Los Alamos National Laboratory (LANL) was the featured laboratory. During their presentation, they discussed Locus GIS+, which powers Intellus, their public-facing environmental monitoring database website.
If you haven’t been to LANL’s Intellus website recently, you are in for a surprise! It was recently updated to better support casual users, and it features some of the best new tools Locus has to offer. Locus reimagined the basic query engine and created a new “Quick search” to streamline data retrieval for casual users. The guided “Quick search” simplifies data queries by stepping you through the filter selections for data sources, locations, dates, and parameters, providing context support at each step along the way.
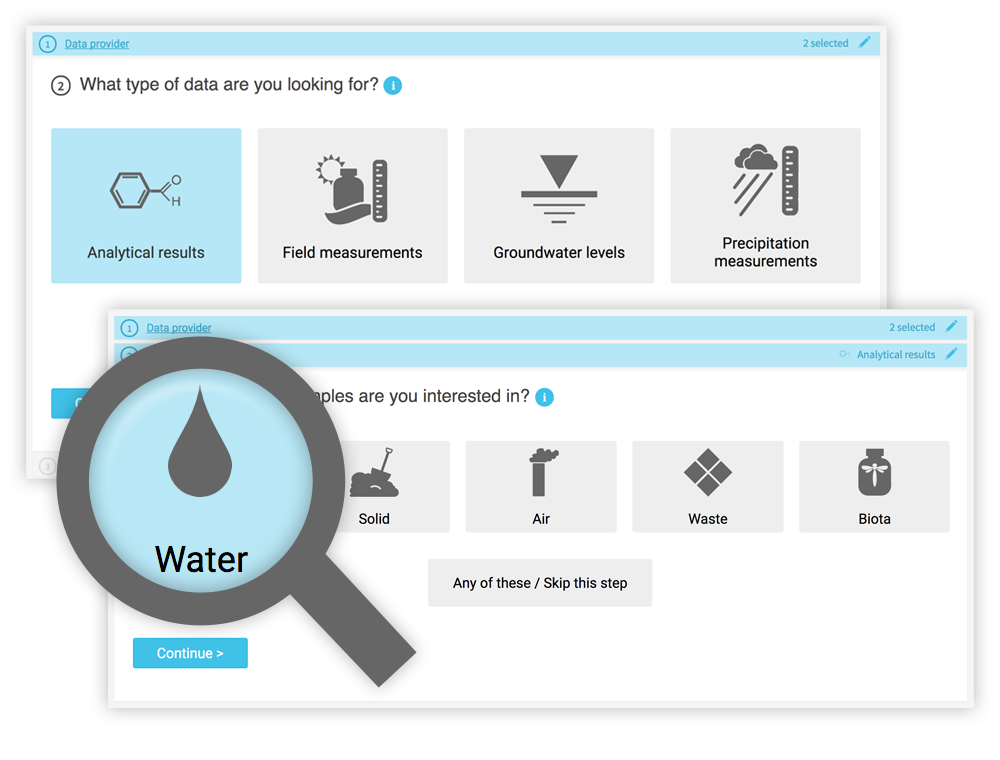 While a knowledgeable environmental scientist may be able to easily navigate a highly technical system, that same operation is bound to be far more difficult for a layperson interested in what chemicals are in their water. Constructing the right query is not as simple as looking for a chemical in water—it really matters what type of water you want to look within. On the Intellus website (showing the environmental data from the LANL site), there are 16 different types of water (not including “water levels”). Using the latest web technologies and our domain expertise, Locus created a much easier way to get to the data of interest.
Just querying data is not necessarily the most intuitive activity to gain insights. Locus integrated our new GIS+ visualization engine to allow users to instantly see all the data they just queried in detailed, context-rich maps.
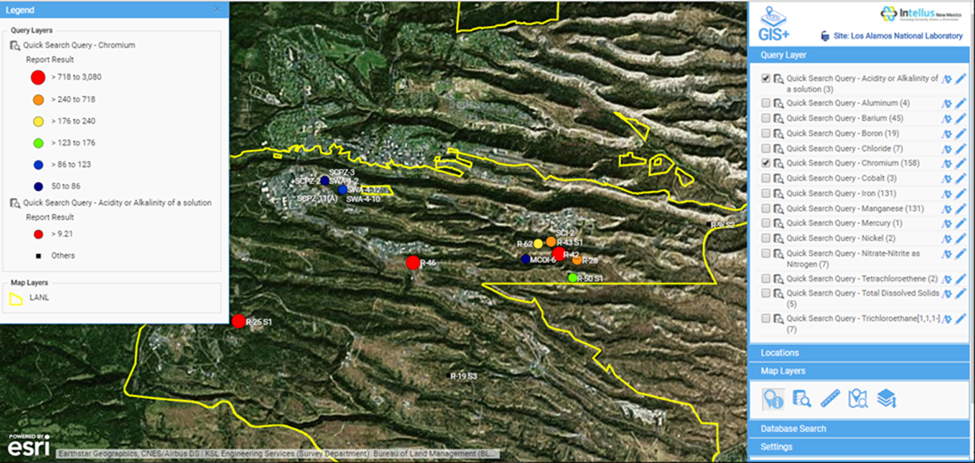
Intellus GIS+ map showing “Quick search” query results for chromium levels in the LANL area
Instead of a dense data grid, GIS+ gives users an instant visual representation of the issue, enabling them to quickly spot the source of the chemicals and review the data in the context of the environmental locations and site activities. Most importantly for Intellus users, this type of detailed map requires no GIS expertise and is automatically created based on your query. This directly supports Intellus’ mission to provide transparency into LANL’s environmental monitoring and sampling activities.
GIS+ also allows users (albeit with a bit more experience in GIS mapping) to integrate maps from a wide range of online sources to provide even more insight to the available data. In the example below, we overlaid the publicly-available US Fish and Wildlife critical habitat maps with data from the LANL site to show the relationship of the site to critical habitats. This type of sophisticated analysis is the future of online GIS. Locus takes full advantage of these opportunities to visualize and integrate data from varying sources with our GIS+ tools, made simple for users and integrated with ArcGIS Online by Esri.
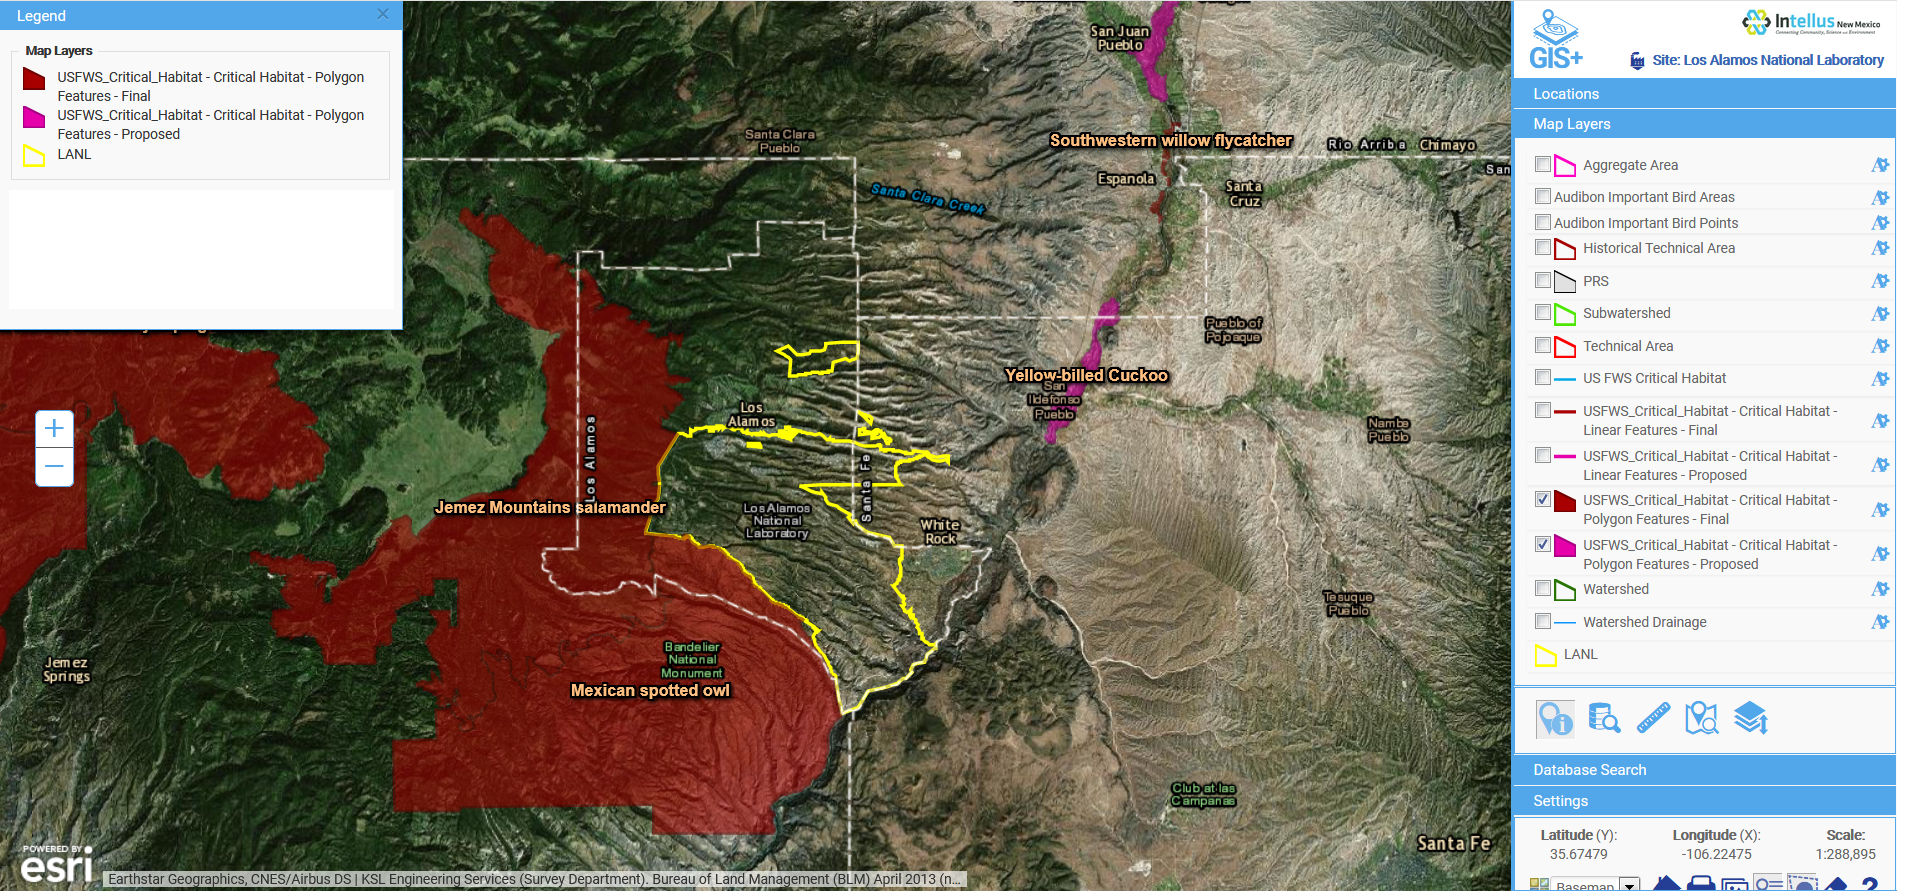
Intellus GIS+ map showing imported layers of US Fish and Wildlife critical habitats in relation to LANL environmental sampling data

Overall, Locus is very proud of our cross-cutting environmental information management tools. We were one of many WM18 attendees enjoying LANL’s presentation and getting even more ideas from the audience on the next steps for better environmental visualization.
Becomes Largest Real-time Database of Global PFAS Records from Nearly 40,000 Locations.
MOUNTAIN VIEW, Calif., April 9, 2025 —Locus Technologies, the leader in sustainability and Environmental Health and Safety (EHS) compliance software, announced that as of today, Locus clients have collectively contributed 3,000,000 validated Per- and Polyfluoroalkyl Substances (PFAS) records to the company’s environmental database, making it the most extensive real-time, aggregated global analytical and geospatial PFAS information source. The records are secured in Locus’s sophisticated, multitenant SaaS database.
Locus’s expansive PFAS dataset includes all 430 chemicals identified in the US Environmental Protection Agency (EPA) PFAS inventory, collected from 38,553 global sites, predominantly in the United States. By combining advanced geographic information system (GIS) tools and artificial intelligence (AI)-driven analytics, Locus provides unmatched capabilities for identifying contamination sources, tracking environmental accumulations in water, soil, and living organisms, and visualizing critical “hot spots” for strategic remediation.
“This milestone underscores our commitment to advancing environmental safety through technology innovation,” said Neno Duplan, founder and CEO of Locus Technologies. “Our multitenant SaaS infrastructure uniquely positions Locus as the only platform capable of aggregating, analyzing, and reporting critical PFAS data in real-time. With three million records, we’ve reached an unprecedented capability for understanding and managing this global health threat.”
Locus Technologies’ multitenant SaaS platform enables individual organizations to securely manage and report their PFAS sampling data and compliance requirements while gaining broader insights from aggregated data. The company’s unique software architecture empowers clients to stay ahead of stringent regulatory frameworks, including emerging EU directives and global ESG reporting demands, while ensuring the absolute privacy of their proprietary information.
“Emerging research indicates the PFAS health crisis will be more significant than Asbestos, lead, and tobacco combined. Empowering organizations to effectively track and manage this data is imperative,” said Duplan. By leveraging the real-time analytical power of Locus, utilities, government agencies, and enterprises can proactively manage PFAS risks, streamline regulatory compliance, and safeguard public health and environmental ecosystems worldwide.
To learn more about Locus Technologies, please visit locustec.com.
About Locus Technologies
Locus Technologies, the global environmental, social, governance (ESG), sustainability, and EHS compliance software leader, empowers companies of every size and industry to be credible with ESG reporting. From 1997, Locus pioneered enterprise software-as-a-service (SaaS) for EHS compliance, water management, and ESG credible reporting. Locus apps and software solutions improve business performance by strengthening risk management and EHS for organizations across industries and government agencies. Organizations ranging from medium-sized businesses to Fortune 500 enterprises, such as Sempra, Corteva, Chevron, DuPont, Chemours, San Jose Water Company, The Port Authority of New York and New Jersey, Port of Seattle, and Los Alamos National Laboratory, have selected Locus. Locus is headquartered in Mountain View, California. For further information regarding Locus and its commitment to excellence in SaaS solutions, please visit http://www.locustec.com or email info@locustec.com.
MOUNTAIN VIEW, Calif., 14 February 2023 — Locus Technologies, the leading EHS Compliance, and ESG software provider, today announced that San Jose Water (SJW), an investor-owned public utility providing water service to a population of approximately one million people in the Santa Clara Valley, has expanded Locus’ environmental information management software to use Locus GIS+ for advanced GIS analysis.
SJW has been using Locus SaaS and mobile app since 2014 to manage its field data collection, water quality compliance, and regulatory reporting. SJW also uses Locus to track sewer discharges and well blow-offs.
“Our responsibility is to ensure our customers receive the highest quality drinking water from their taps. We monitor the quality and cleanliness of our water in terms of state and federal regulatory requirements. In 2021, our highly experienced staff collected more than 1,000 regulatory and non-regulatory samples from our distribution system and treatment plant, generating over 23,000 data points. To manage this data effectively, we used Locus’ cloud-based software. GIS mapping capabilities are essential for our environmental data analysis. Locus GIS+ will allow quick data visualization and is a quantum leap forward with advanced analysis tools that use Esri’s Smart Mapping technology,” said Suzanne DeLorenzo, the Director of Water Quality at San Jose Water.
“Locus’s mission is to help organizations, such as San Jose Water, to achieve their business goals by providing them the software tools to manage key data associated with water quality and compliance reporting,” said Neno Duplan, CEO of Locus. “With GIS+, SJW will have all the tools they need to perform a wide range of geospatial data analysis across their distribution system. Our water quality management cloud-based software, coupled with GIS+ and Locus Mobile for field data collection, provides our customers with a highly scalable and feature-rich application that gives water utilities strong analytical power and advanced GIS capabilities.”
Locus GIS+ is powered by Esri’s ArcGIS platform and offers various advanced features— including enhanced cartography, comprehensive spatial data analysis, and the ability to use the customer’s map data through integration with ArcGIS Online and Portal for ArcGIS.
ABOUT SAN JOSE WATER
Founded in 1866, San Jose Water is an investor-owned public utility and is one of the largest and most technically sophisticated urban water systems in the United States. Serving over one million people in the greater San Jose metropolitan area, San Jose Water also provides services to other utilities, including operations and maintenance, billing, and backflow testing. San Jose Water is owned by SJW Group, a publicly-traded company listed on the New York Stock Exchange under the symbol SJW. SJW Group also owns Connecticut Water Company in Connecticut; Maine Water Company in Maine; and SJWTX, Inc. (dba Canyon Lake Water Service Company) in Texas. To learn more about San Jose Water, visit www.sjwater.com.
MOUNTAIN VIEW, Calif., 1 September 2020 — Locus Technologies (Locus), industry leader in water data management software, today announced that Valley Water (formerly Santa Clara Valley Water District) has chosen Locus environmental software for their data collection and management.
Valley Water has selected Locus’ environmental software, EIM, following consultant work Locus provided for the utility going back 14 years. They will seek to utilize Locus EIM as a laboratory database management system, and for data analytics. Locus EIM will be used to manage sample data for over 200 million gallons of drinking water consumed daily by over 2 million people in the district.
“Valley Water has an award-winning track record of bringing the highest-quality water to the Bay Area. Being local, we see the hard work that Valley Water puts into providing some of the best drinking water available anywhere. We are proud to be a part of that process,” said Wes Hawthorne, President of Locus.