Tag Archive for: Mobile

Utilizing Wearable Tech for EHS 

In August 2014, we wrote on the potential use of wearables for EHS professionals. Less than a year later, the Apple Watch was introduced, revolutionizing the market. Now, wearables in the EHS space aren’t a hypothetical. Roughly a fifth to a quarter of Americans wear a smartwatch daily. Wearables are undoubtedly one of the biggest trends in EHS, with a seemingly endless number of uses to promote a more efficient and safer workplace.

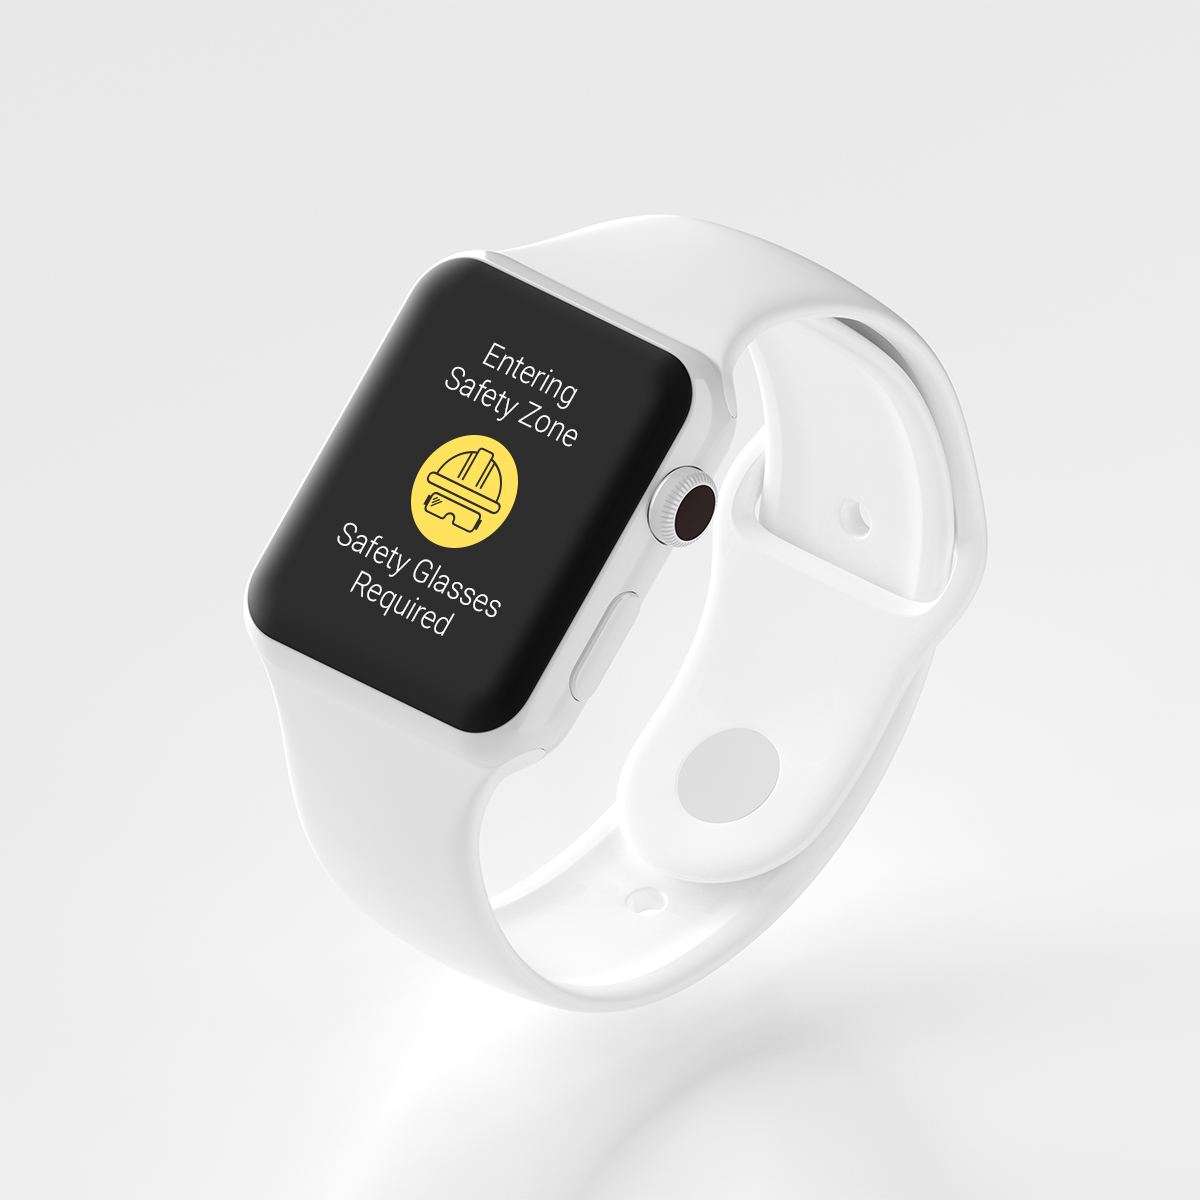
Locus EHS Wearable Tech | Apple Watch

Despite recent growth, wearables are still in their infancy when it comes to EHS. Verdantix anticipates that companies will spend 800% more on connected worker devices in twenty years, an explosion in utilization. This year alone, over 20% of surveyed companies are reporting an increase in budget for wearables for EHS purposes. While demand from organizations is growing, most EHS software is yet to adapt to market needs, with few offering wearable support.

Locus is prepared to meet the needs of the market, by integrating wearable support with our mobile application. Here are a few ways to best utilize your smartwatch with Locus Mobile:

[sc_icon_with_text icon=”notification” icon_shape=”circle” icon_color=”#ffffff” icon_background_color=”#52a6ea” icon_size=”big” level=”h3″]

Smart notifications

Custom and priority notifications can be tailored to fit the needs of professionals in your organization, increasing engagement and response time.[/sc_icon_with_text]

[sc_icon_with_text icon=”sample-planning” icon_shape=”circle” icon_color=”#ffffff” icon_background_color=”#52a6ea” icon_size=”big” level=”h3″]

Keep track of routine samples

Calendar alerts directly to your wearable, so that no samples are missed by field technicians.[/sc_icon_with_text]

[sc_icon_with_text icon=”location” icon_shape=”circle” icon_color=”#ffffff” icon_background_color=”#52a6ea” icon_size=”big” level=”h3″]

Location tracking

Get alerted when you’re entering a safety zone that requires specific PPE.[/sc_icon_with_text]

[sc_icon_with_text icon=”health” icon_shape=”circle” icon_color=”#ffffff” icon_background_color=”#52a6ea” icon_size=”big” level=”h3″]

Vital signs

Track worker vital signs for faster response time in the event of an emergency.[/sc_icon_with_text]

If your organization is looking to implement wearable tech, Locus product specialists are ready to discuss your needs and how we can help.

Contact us to learn more or request a demo

    Name

    Company Email

    Phone

    Tell us about your company's needs

    Locus is committed to preserving your privacy.

    A better way to manage all those ops readings

    Manage all those ops readings without spreadsheets or paper forms

    I am constantly reminded by the number of calls we receive, that no matter how robust a SCADA and HMI system is, there is always a requirement for in-field O&M verification and documentation. It’s almost universal, and spans a myriad of industries, large and small, the need to monitor and record thousands of periodic (daily/per shift/weekly, etc.) routine readings/recordings at a prescribed frequency often recorded on pen to paper field forms. The same processes sometimes use “template” spreadsheets for data collection that are then emailed/placed on shared file servers or otherwise sent to some central location for review and post processing. These processes are antiquated and subject to data quality and record keeping challenges.

    It’s time for an upgrade!

    Why simple form builders are not a good software solution for ops data

    Electronic forms are great for collecting data and almost every business entity has built such forms in spreadsheets, word processing or simple databases to collect the information. In addition, there is a software category of form builders and they can certainly build forms. The question becomes is it a good fit so solve your business process issues?
    Most customers have more sophisticated needs than simply collecting information on one or more custom forms – they want to do something with all the information collected far beyond what simple form builder tools can provide. Even customers with sophisticated spreadsheet forms, can’t manage them as they multiply exponentially or their Excel gurus retire.

    Here are some examples of where you may require software tools beyond a simple form builder:

    • Collecting equipment readings on each shift at multiple locations and report the data to centralized management, who review the data, look for trends/ issues.
    • Verifying and validating data at the point of data entry to eliminate data entry errors.
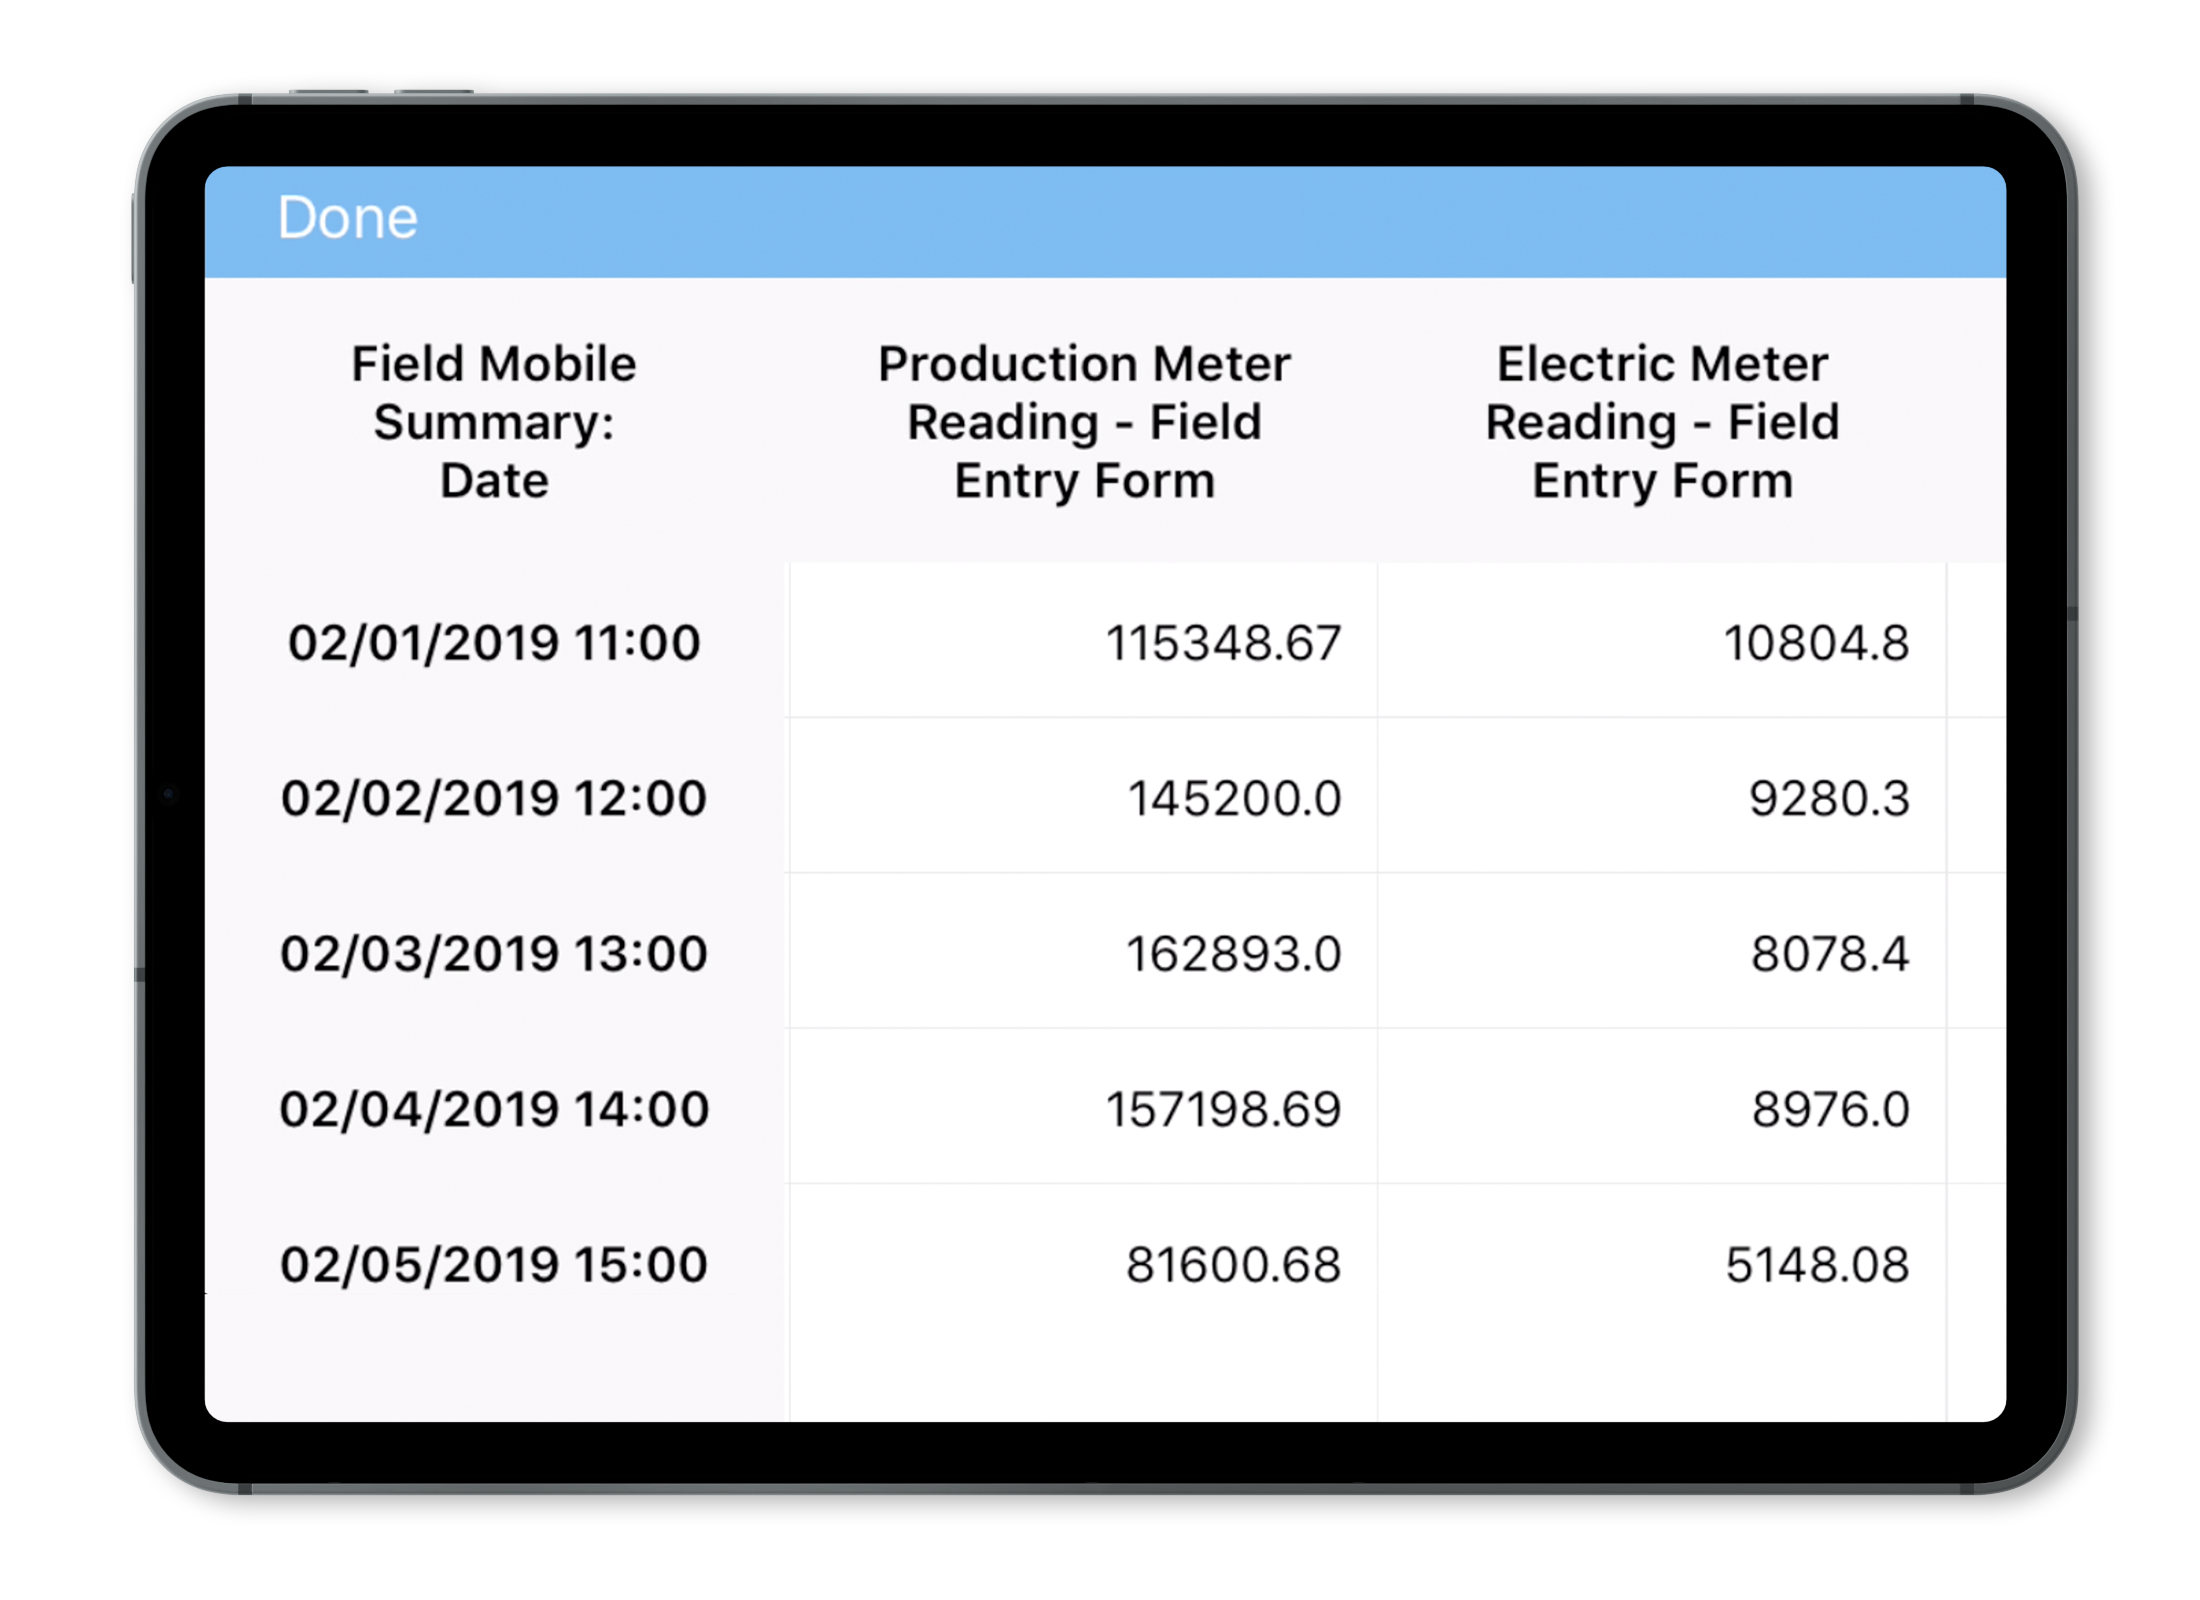
    • Automatically visualizing (charts or tables) information in near real time to make operations decisions.
    • Sharing the information with others.
    • Scheduling activities related to periodic or infrequent data collection events.
    • Receiving notifications when actions are due.
    • Automatically creating regulatory reports in prescribed formats.
    • Creating complex work flows and audited approval processes.
    • Creating intelligent forms with calculations based on past data or other criteria
    Locus Platform Mobile Summary Table

    Forms with Benefits

    Locus Platform is a configurable platform with standard applications that are easy to configure to customers unique requirements. One of its many strengths is its powerful form builder capable of creating simple or complex forms with simple or sophisticated logic. So for customers looking to move from paper and spreadsheet templates, it’s an excellent option to consider, especially if you require more than a simple “fill in the blank” form for transmittal using mobile devices. Best of all, the data are securely stored in a database structure for reporting and alternative business uses and analyses, compared to the almost impossible management of hundreds of spreadsheets or paper forms.

    Here are some examples where sophisticated forms are integrated with a flexible database:

    • Water Utilities – Tracking chlorination and aerobic digestion processes with daily inputs/outputs with a monthly summary and chart, and tracking well production across well fields.
    • Water Utilities – Tracking periodic sewer discharges and water samples for permit compliance.
    • Agriculture – Monitoring food processing equipment for compliance with optimum equipment operating parameters for air permits.
    • Pharmaceutical/Chemical Manufacturing Facilities- Tracking EHS daily, weekly, monthly, etc. investigations and in-house audits.
    • Universities – tracking chemical inventories.
    • Facility Engineering – Documenting O&M activities for groundwater treatment systems.
    • Electric Utilities – Monitoring water/energy/gas usage from old style meters for sustainability reporting with data entry validation.
    • Refineries and Terminals – Collecting O&M, usage and wastewater data.
    Locus Mobile integrates with Locus Platform

    If you still rely on paper forms and template spreadsheets and are ready to streamline your process and enhance the value of your data, give us a call and we can show you a range of options that will retire the paper forms for good!


    Contact us to learn more about Locus Platform

      Name

      Company Email

      Phone

      Tell us about your company's needs

      Locus is committed to preserving your privacy.

      Make your O&M mobile apps work harder for you!

      Mobile apps for water and wastewater operation and maintenance (O&M) activities have been around for some time now. Most users are familiar with the benefits such as instant data collection and access to reference information for better, more reliable O&M monitoring. However, as new software tools are consistently becoming more powerful and more accessible, that “ground-breaking” mobile app that you purchased five years ago may now be looking a little dated.  When you are ready to upgrade, here are some of the features that are the new “must haves”.

      Unique and custom forms

      For many O&M programs, you may have your own data collection needs that are specific to your facility or industry.  Mobile O&M apps now allow you to tailor your input forms to add new data fields, remove unwanted fields, change some of the logic like making certain fields required, and make certain fields tied into established pick lists.  Even better, you can match the mobile form to the original paper form, making the transition to mobile simple and intuitive for staff.  And, the more the merrier, as modern mobile apps let you have multiple forms on the same app so you have everything you need in one place.

      Real-time entry validation

      It is not enough to just enter your O&M information into a mobile device.  You also want to make sure you are entering correct data.  Current O&M mobile tools can check your entry as you enter it and validate against whatever criteria are established for that data.  So you make sure that you’re entering a pH reading of 7.2, rather than 72.  You can also use configurable pick lists to limit data entry to your specific desired entries and not have to correct misspellings or 16 different ways to say “out of service”.  Make sure that pick lists are configurable and can be shared with each of your company’s devices.

      Barcode and QR code scanning

      You are probably already using your phone to compare prices at your local store.  It is amazingly easy to simply scan a product’s barcode and instantly see the best available price locally or online.  Since virtually every phone/tablet now has a built-in camera, you can use that to scan barcodes or QR codes to associate data entry with a tagged sampling port or asset. This can save you from possible mismatch errors that can occur when simply selecting from a list or typing in data.

      Use your voice

      We are starting to use voice recognition technology in our mobile devices to quickly send out text messages.  Why not use it for recording inspection/audit comments or field issues?  Voice recognition is improving every year, and can provide your comments onto a data collection form much faster than typing and can be especially useful for conditions where gloves are required and typing or stylus input is not practical.  Using the phone’s native abilities, take advantage of voice feature to streamline note taking, knowing that you can always fix up any issues back in the office.

      Review, Sync, Repeat

      Mobile apps should have a summary screen to review your data before sending it back to your database, such as a summary form for all data collected during a shift.  And once you do sync your data back to the main database (you have a main database right???), instantly reset the form for the next day data collection event so you are always ready.

      No Internet?  No Problem!

      Mobile apps that won’t function when there is no connection should be abandoned.  You need to be able to collect data no matter the location and the signal strength.  Look for mobile apps that function with zero connectivity, and save the data until a signal is found.  Not every location at modern water and wastewater facilities has a hot spot, so be prepared with the right app.

      [sc_button link=”https://www.locustec.com/applications/mobile-field-data-collection/” text=”Learn more about Locus Mobile” link_target=”_self” background_color=”52a6ea” centered=”1″ separator_style=”double”]

      Celebrating 55 years of GIS-based EHS data insights

      GIS Day was established in 1999 to showcase the power and flexibility of geographical information systems (GIS).  In celebration of the 55th birthday of GIS, we’ve compiled a brief history of the evolution of this powerful technology, with a special focus on how it can be used in EHS applications to make environmental management easier.

      Not only is GIS more powerful than ever before—it is also vastly more accessible.  Anyone with Internet access can create custom maps based on publicly available data, from real-time traffic conditions to environmental risk factors, to local shark sightings. Software developers, even those at small companies or startups, now have access to APIs for integrating advanced GIS tools and functionality into their programs.

      Origins of GIS

      Before you can understand where GIS is today, it helps to know how it started out. This year is the 55th anniversary of the work done by Roger Tomlinson in 1962 with the Canada Land Inventory. We consider this the birth of GIS, and Mr. Tomlinson has been called the “father of GIS”.

      The original GIS used computers and digitalization to “unlock” the data in paper maps, making it possible to combine data from multiple maps and perform spatial analyses. For example, in the image shown here from the Canada Land Inventory GIS, farms in Ontario are classified by revenue to map farm performance.
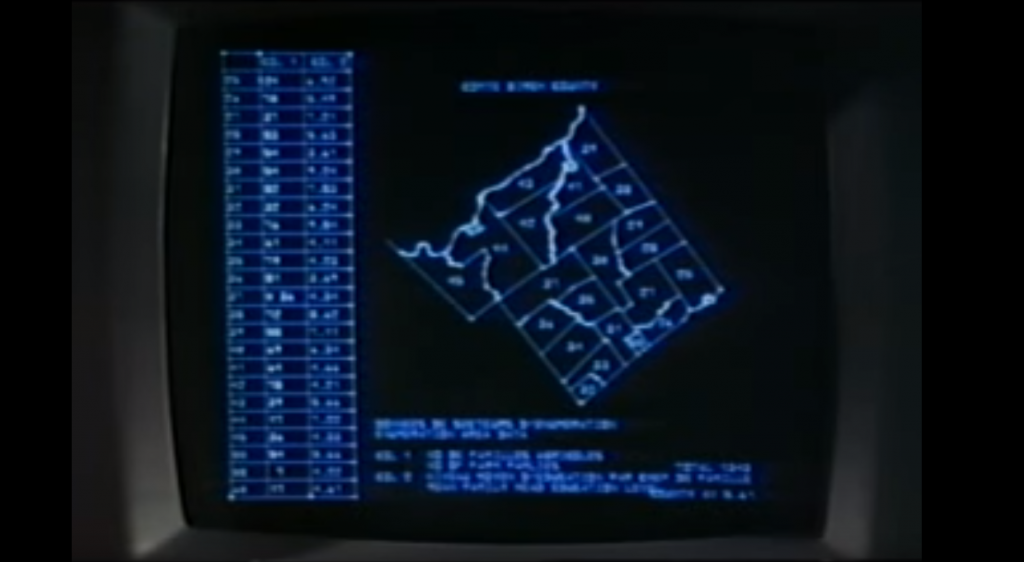
      An early GIS system from the Canada Land Inventory, in Data for Decisions, 1967

      An early GIS system from the Canada Land Inventory, in Data for Decisions, 1967
      Photo: Mbfleming. “Data for Decisions (1967).” YouTube, 12 Aug. 2007, https://youtu.be/ryWcq7Dv4jE.
        Part 1, Part 2, Part 3

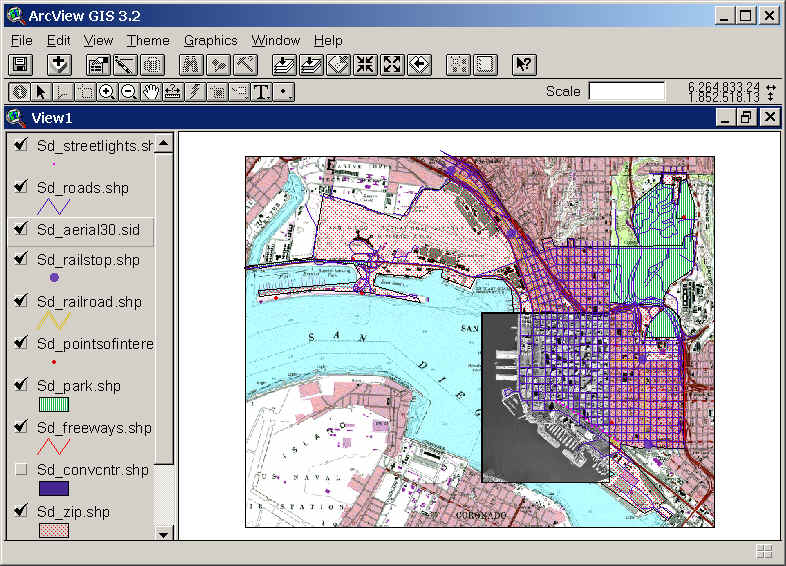
      In 1969, Jack Dangermond founded Esri, which became the maker of, arguably, the world’s most popular commercial GIS software. Esri’s first commercial GIS, ARC/INFO, was released in 1982, and the simpler ArcView program followed in 1991. Many of today’s most skilled GIS software developers can trace their roots back to this original GIS software.

      Back then, GIS work required expensive software packages installed on personal computers or large mainframe systems. There was no Google Maps; all map data had to be manually loaded into your software. Getting useful data into a GIS usually required extensive file manipulation and expertise in coordinate systems, projections, and geodesy.

      While the government, utility, and resource management sectors used GIS heavily, there was not much consumer or personal use of GIS. Early GIS professionals spent much of their time digitizing paper maps by hand or trying to figure out why the map data loaded into a GIS was not lining up properly with an aerial photo. This may sound familiar to those who have been in the environmental industry for awhile.

      Esri’s ArcView 3.2 for desktop computers (from the 1990s)

      Esri’s ArcView 3.2 for desktop computers (from the 1990s)
      https://map.sdsu.edu/geog583/lecture/Unit-3.htm

      The Google Revolution

      How much has changed since those early days! After the release of OpenStreetMap in 2004, Google Maps and Google Earth in 2005, and Google Street View in 2007, GIS has been on an unstoppable journey—from only being used by dedicated GIS professionals on large computers in specific workplaces, to be accessible to anyone with an internet browser or a smartphone. High-quality map data and images—often the most expensive item in a GIS project in the 1990’s — are now practically free.

      Just think how revolutionary it is that anyone can have instant access to detailed satellite images and road maps of almost anywhere on Earth! Not only can you perform such mundane tasks as finding the fastest route between two cities or locating your favorite coffee shop while on vacation—you can also see live traffic conditions for cities across the globe; view aerial images of countries you have never visited; track waste drums around your facility; and get street level views of exotic places. Back in 1991, such widespread access to free map data would have seemed like something straight out of science fiction.
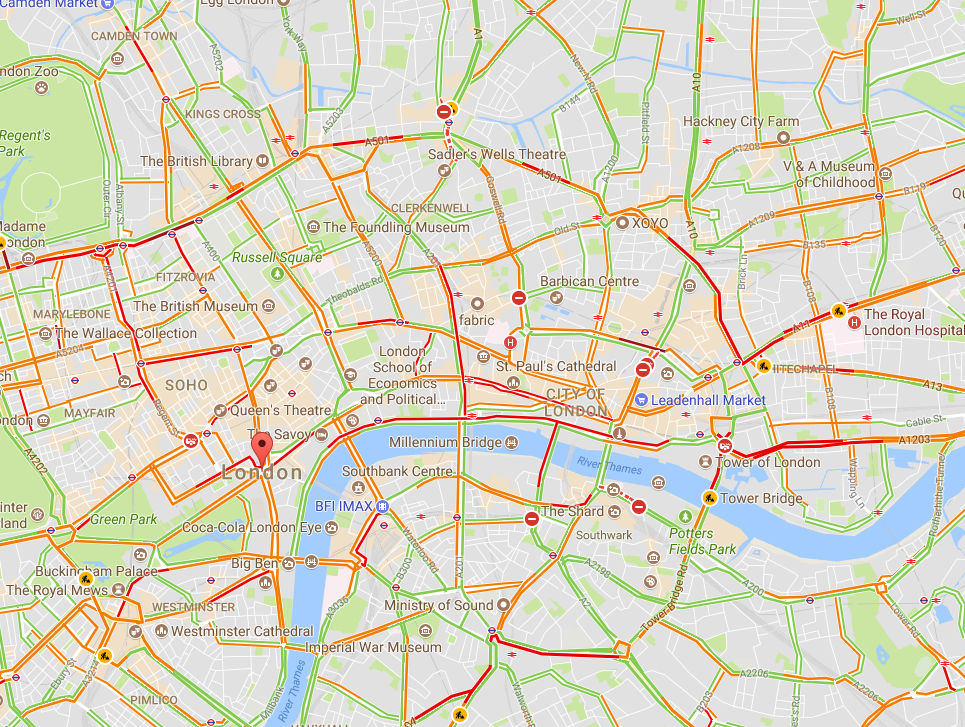
      Traffic conditions in London, 3:30 pm 10/16/2017, from Google Maps

      Traffic conditions in London, 3:30 pm 10/16/2017, from Google Maps

      South Base Camp, Mount Everest, Google StreetView

      South Base Camp, Mount Everest, Google StreetView

      Mashups in the cloud

      Obviously, the amount of spatial data needed to provide detailed coverage of the entire globe is far too large to be stored on one laptop or phone. Instead, the data is distributed across many servers “in the cloud.” Back in the 1990s, everything for one GIS system (data, processing engine, user interface) needed to be in the same physical place—usually one hard drive or server. Now, thanks to the internet and cloud computing, the data can be separate from the software, creating “distributed” GIS.

      The combination of freely available data with distributed GIS and the power of smart phones has led us to the age of “neogeography”—in which anyone (with some technical knowledge) can contribute to online maps, or host their maps with data relevant to their personal or professional needs. GIS no longer requires expensive software or cartographical expertise; now, even casual users can create maps linking multiple data sources, all in the cloud.

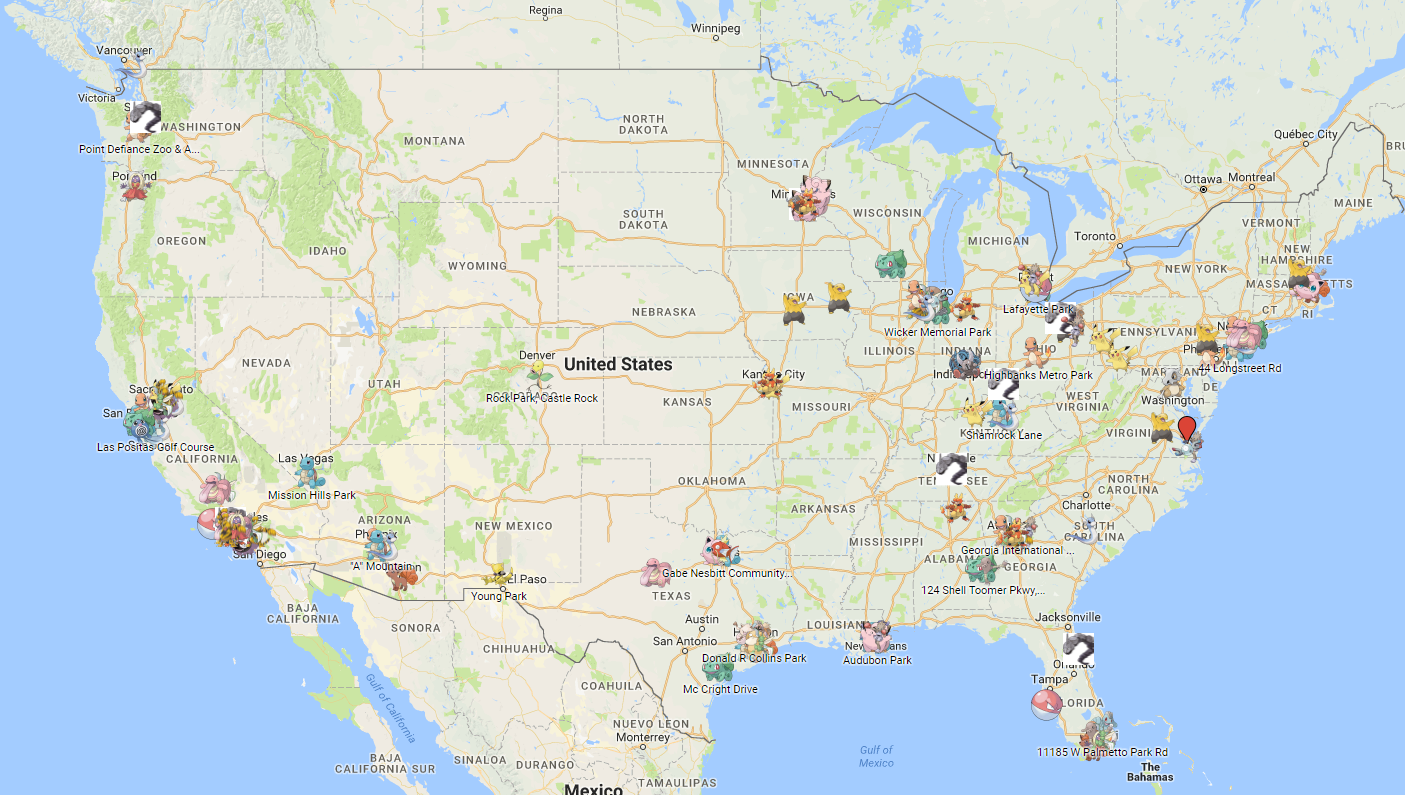
      Google’s MyMaps is an example of a tool for easily making your maps. Maps can range from the playful, such as locations of “Pokemon nests,” to the serious, such as wildfire conditions.

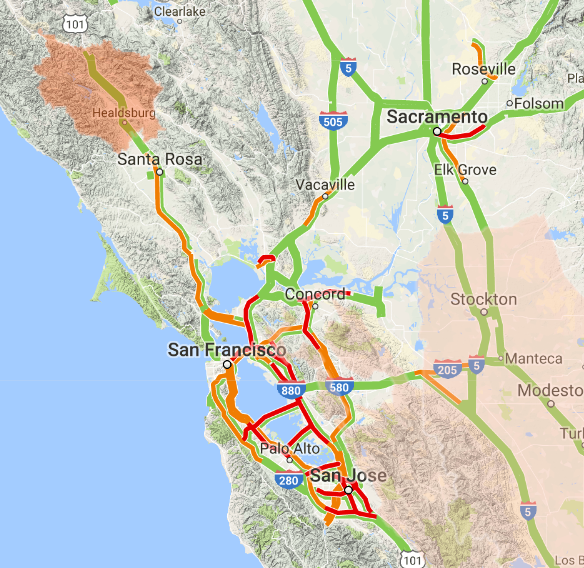
      These online maps can be updated in real time (unlike paper maps) and therefore kept current with actual conditions. Such immediate response is instrumental in emergency management, where conditions can change rapidly, and both first responders and the public need access to the latest data.

      Map showing wildfire and traffic conditions in northern California, 10/16/2017

      Map showing wildfire and traffic conditions in northern California, 10/16/2017
      https://google.org/crisismap/us-wildfires

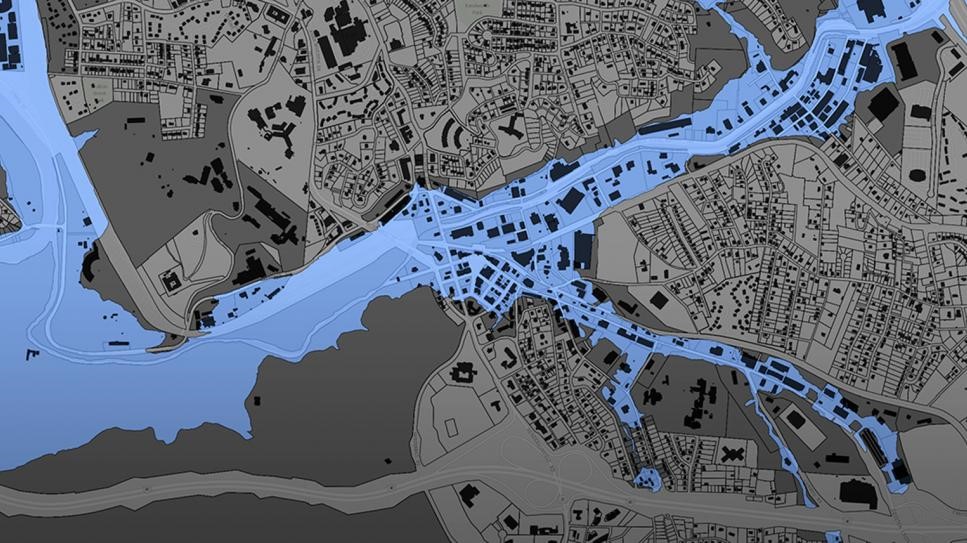
      Furthermore, software programmers have created online GIS tools that let non-coders create their maps. These tools push the boundaries of distributed GIS even further by putting the processing engine in the cloud with the data. Only the user interface runs locally for a given user. During this period of GIS history, it became easy to create “mashups” for viewing different types of disparate data at once, such as natural hazard risks near offices, pizza stores near one’s neighborhood, EPA Superfund sites near one’s home, property lines, flood plains, landslide vulnerability, and wildfire risk.

      Floodplain data for Buncombe County, NC

      Floodplain data for Buncombe County, NC
      https://buncombe-risk-tool.nemac.org

      Programming GIS with APIs

      Another significant advance in GIS technology is the ability to integrate or include advanced GIS tools and features in other computer programs. Companies such as Google and Esri have provided toolkits (called APIs, or application programming interfaces) that let coders access GIS data and functions inside their programs. While neogeography shows the power of personal maps created by the untrained public, computer programmers can use APIs to create some very sophisticated online GIS tools aimed at specific professionals or the public.

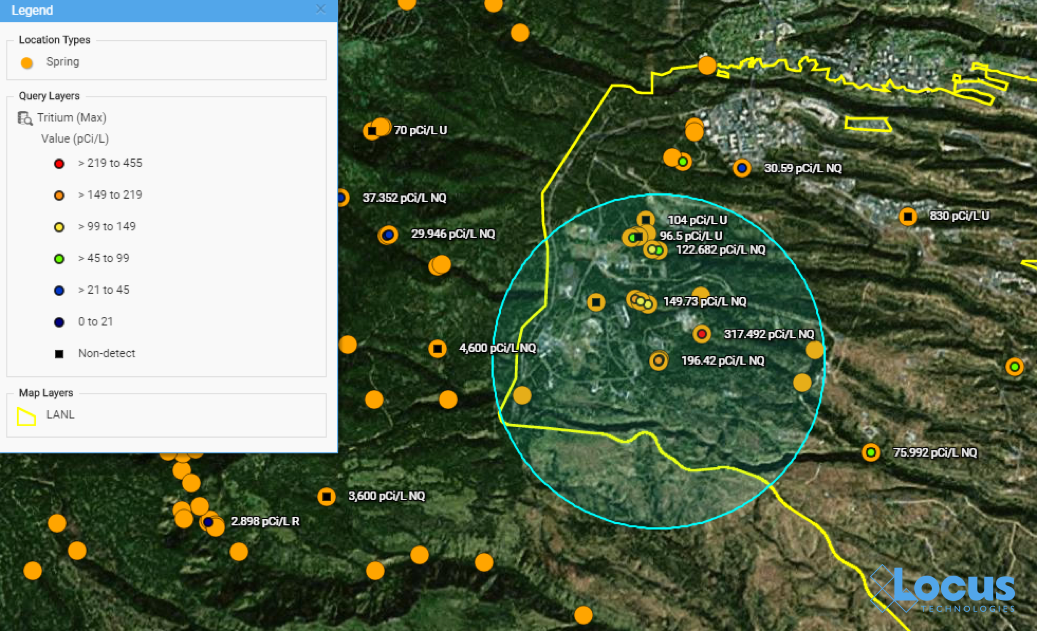
      One example is the publicly-available Intellus application that Locus Technologies developed and hosts for the US Department of Energy’s Los Alamos National Laboratory. It uses an Esri API and distributed GIS to provide access to aerial images and many decades of environmental monitoring data for the Los Alamos, NM area. Users can make maps showing chemical concentrations near their home or workplace, and they can perform powerful spatial searches (e.g., “find all samples taken within one mile of my house in the last year”). The results can be color-coded based on concentration values to identify “hot spots”.

      Map from Intellus showing Tritium concentrations near a specified location

      Map from Intellus showing Tritium concentrations near a specified location
      https://www.intellusnmdata.com

      Another example of more sophisticated forms of analysis is integration of GIS with environmental databases. Many government facilities and private vendors incorporate GIS with online data systems to let public users evaluate all types of information they find relevant.

      For example, contour lines can be generated on a map showing constant values of groundwater elevation, which is useful for determining water flow below ground. With such powerful spatial tools in the cloud, any facility manager or scientist can easily create and share maps that provide insight into data trends and patterns at their site.
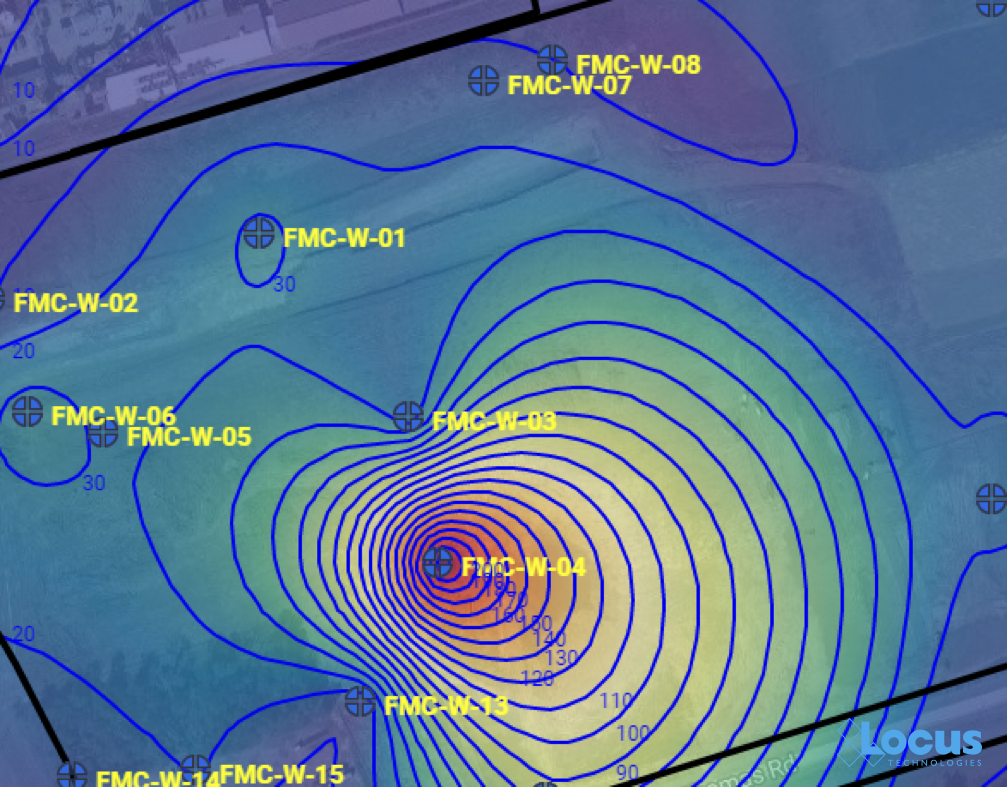
      Groundwater contour map

      Groundwater contour map where each line is a 10 ft. interval, from the Locus EIM system

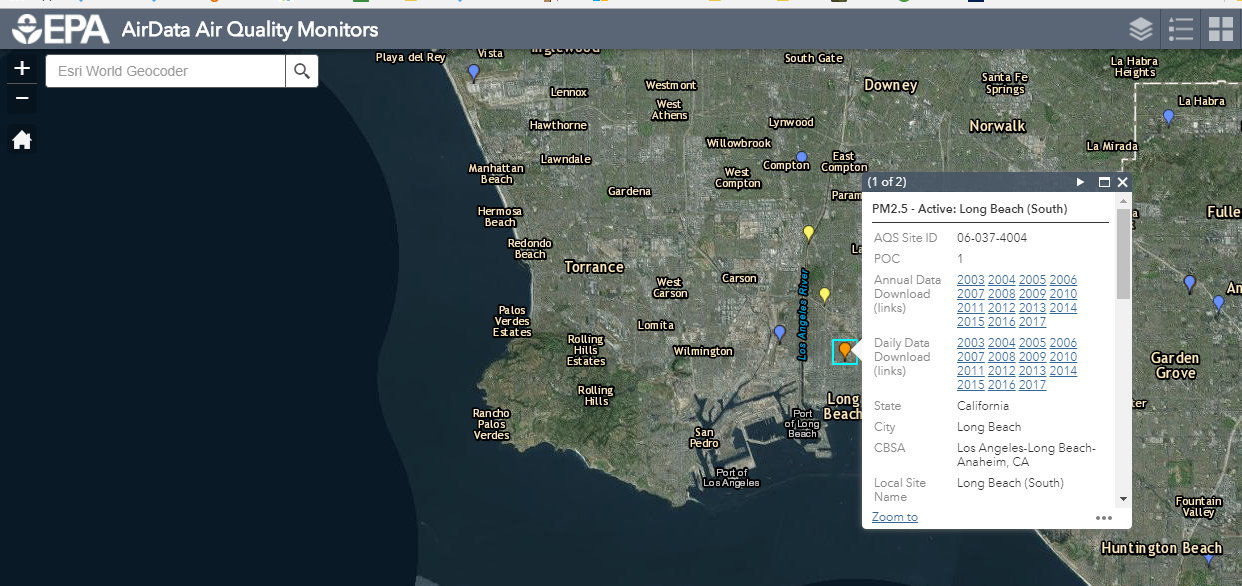
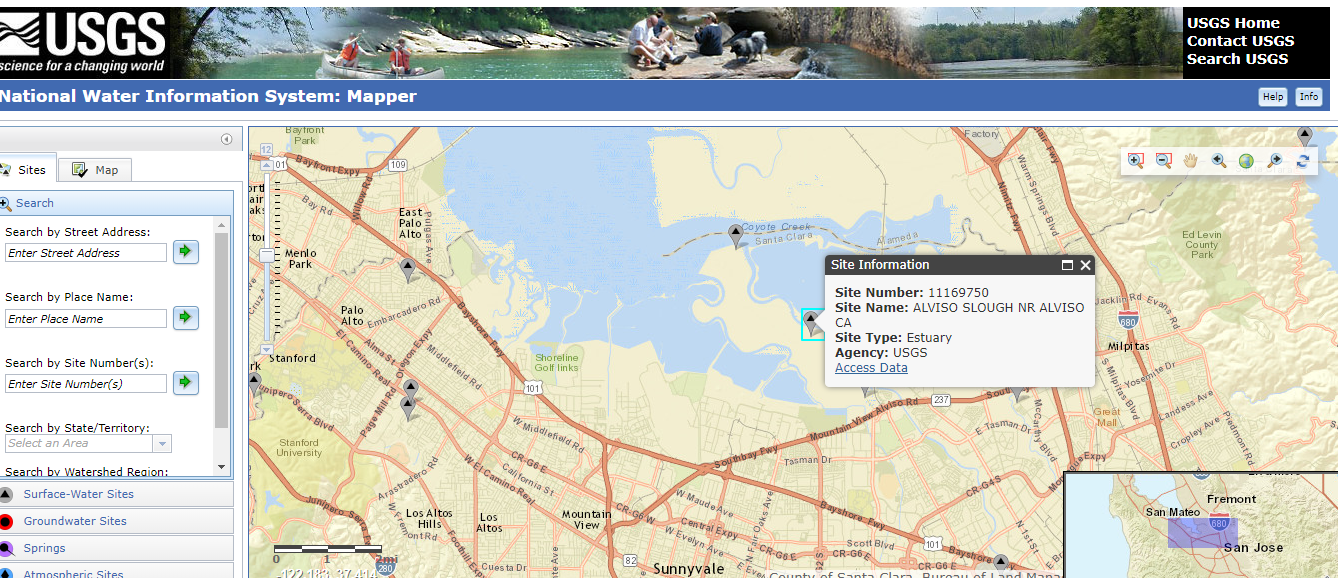
      Other examples include monitoring air emissions at monitoring sites (like US EPA’s AirData Air Quality Monitors, shown below) and actual stream conditions from the USGS (also shown below).

      Screen capture of air quality data from US EPA AirData GIS app

      Screenshot from US EPA AirData Air Quality Monitors interactive GIS mapping platform, showing Long Beach, California


      Screen capture of USGS National Water Information System interactive GIS map tool

      Screen capture of USGS National Water Information System interactive GIS map tool, showing a site in Mountain View, California

      There’s a (map) app for that

      One particularly exciting aspect of GIS today is the ability to use GIS on a smartphone or tablet. The GIS APIs mentioned above usually have versions for mobile devices, as well as for browsers. Programmers have taken advantage of these mobile APIs, along with freely available map data from the cloud, to create apps that seamlessly embed maps into the user experience. By using a smartphone’s ability to pinpoint your current latitude and longitude, these apps can create personalized maps based on your actual location.

      A search in the Apple AppStore for “map” returns thousands of apps with map components. Some of these apps put maps front-and-center for traditional navigation, whether by car (Waze, MapQuest, Google), public transit (New York Subway MTA Map, London Tube Map), or on foot (Runkeeper, Map My Run, AllTrails). Other apps use maps in a supporting role to allow users to find nearby places; for example, banking apps usually have a map to show branches near your current location.

      What’s really exciting are the apps that allow users to enter data themselves via a map interface. For example, HealthMap’s Outbreaks Near Me not only shows reports of disease outbreaks near your location, but it also lets you enter unreported incidents. The GasBuddy app shows the latest gasoline prices and lets you enter in current prices. This “crowdsourcing” feature keeps an app up-to-date by letting its users update the map with the latest conditions as they are happening.
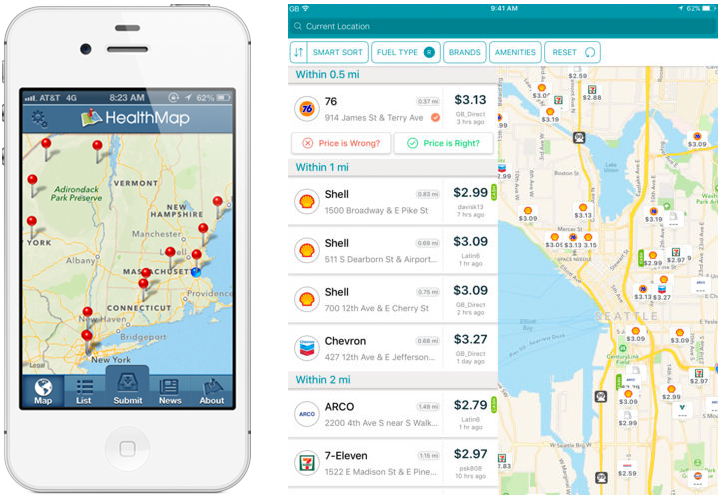
      The Outbreaks Near Me app for phones (left) and the GasBuddy app for tablets (right)

      The Outbreaks Near Me app for phones (left) and the GasBuddy app for tablets (right)

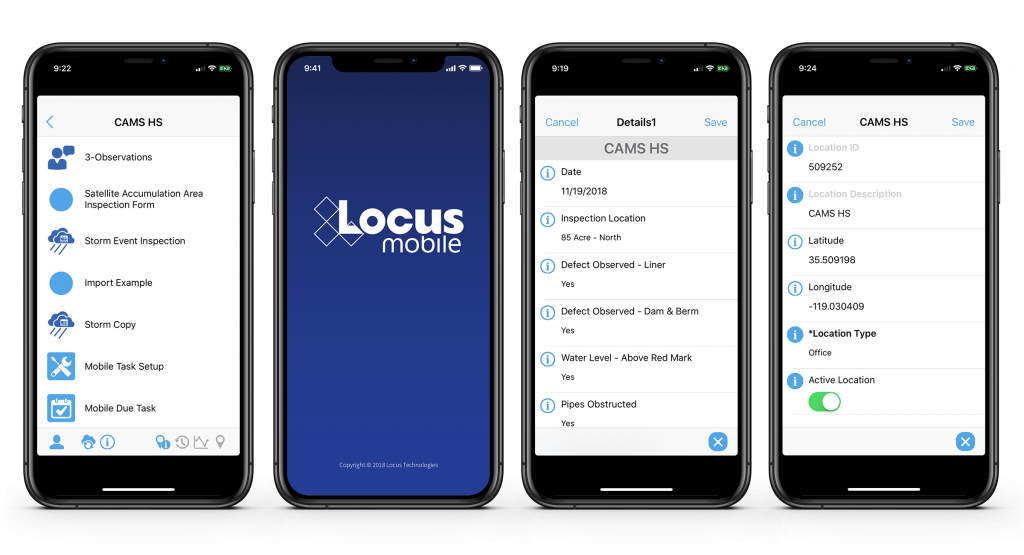
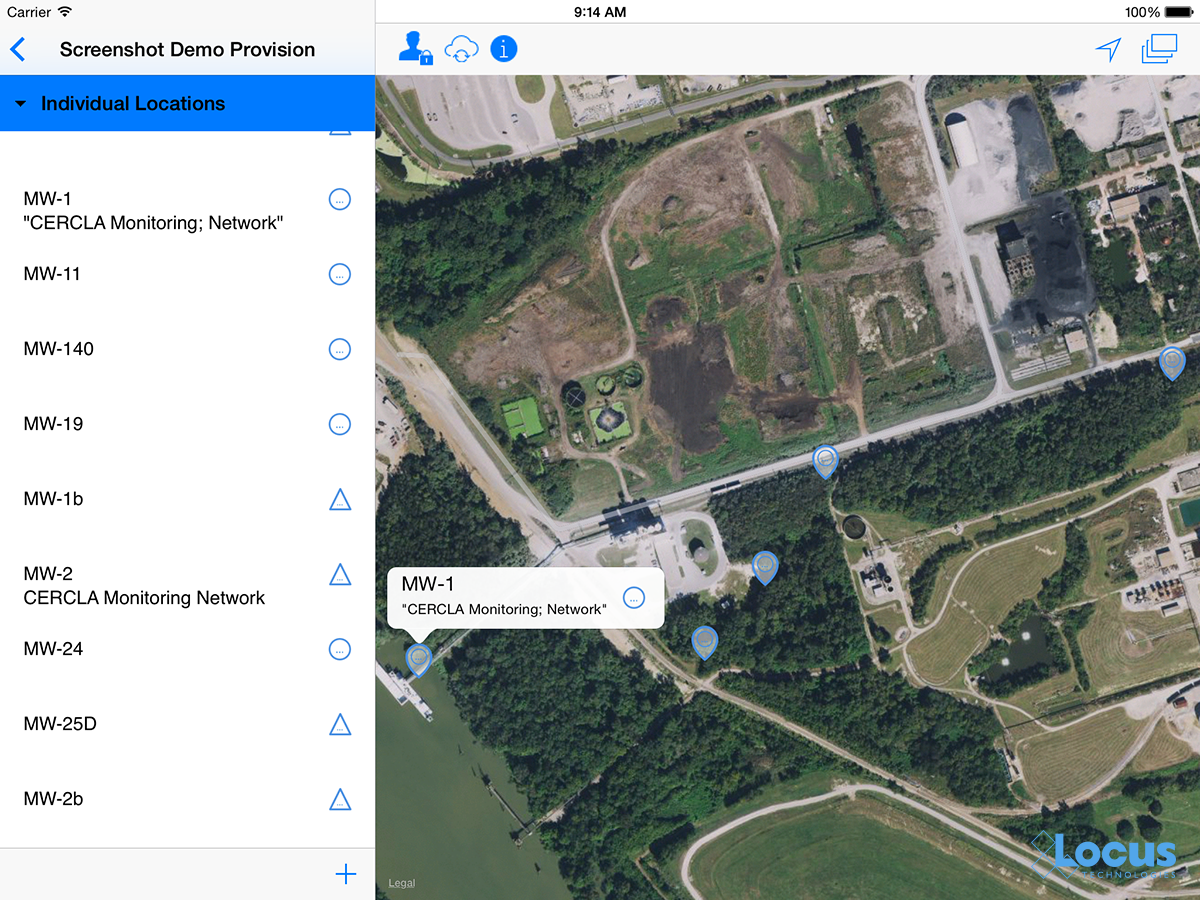
      EHS professionals can further harness the power of GIS using mobile applications.  For example, in the Locus Mobile app for field data collection, users can enter environmental data—such as temperature or pH measurements—from a sampling location, then upload the data back to cloud-based environmental management software for immediate review and analysis. Mobile apps can also support facility compliance audits, track current locations of hazardous waste drums, collect on-scene incident data (complete with photos), and record exact locations for mapping by colleagues back in the office.

      GIS-enabled mobile apps also typically include a map interface for navigating to data collection points and tracking visited locations. Other key features to look for include ad hoc location creation for capturing unplanned data—this lets users create new data collection points “on the fly” simply by clicking on the map.
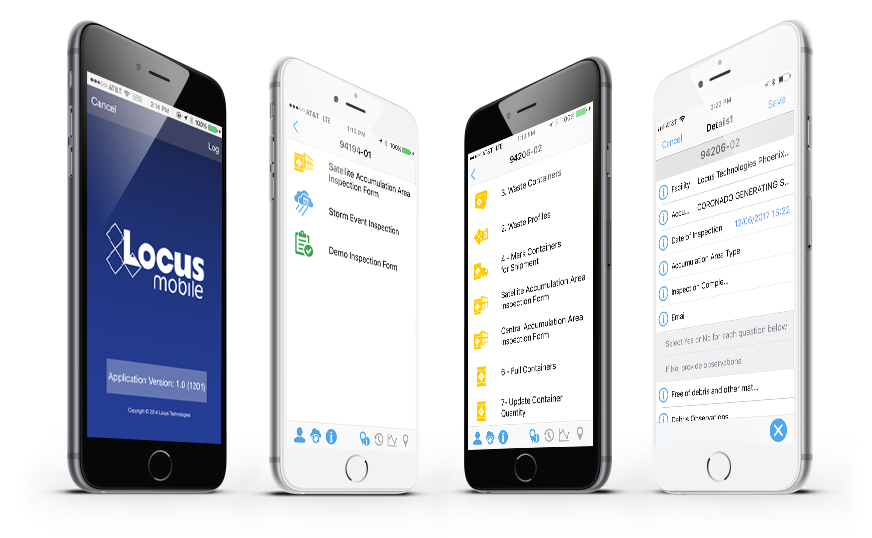
      Locus Mobile App

      Views of many different mobile app use cases from tracking drums to collecting field data

      A bright future for GIS applications within EHS software

      Where will GIS as a whole go from here? It’s possible that augmented reality, virtual reality, and 3D visualization will continue to expand and become as ubiquitous as the current “2D” maps on browsers and phones. Also, the “internet of things” will surely have a GIS component because every physical “thing” can be tied to a geographical location. Similarly, GIS can play an important role in “big data” by providing the spatial framework for analysis.

      GIS is one of the most effective ways to convey information to a wide range of users, from corporate managers looking at the company’s key metrics to operational personnel looking for incidents across facilities and trying to find trends. It is a highly intuitive data query interface that empowers users to explore the data hidden deep in enterprise EHS databases. The examples presented above are just the tip of the iceberg for the range of possibilities to simplify communication of information and look more broadly across enterprises to identify where real or potential issues lie.

      An EHS software system should have many ways to extract data and information to form insights beyond a few “canned” reports and charts. A spatially-accurate picture can often provide more actionable insight than tables and text. Imagine being able to see spill locations, incident locations, environmental monitoring stations for air quality, wastewater outfalls, central and satellite waste accumulation area locations, and PCB and asbestos equipment and/or storage locations—all visually represented on an actual map of your facility and its surroundings. All these types of maps are invaluable in an enterprise EHS software system and should be a critical item on your checklist when selecting software for your EHS needs.

      Thanks to the GIS Timeline for providing some of the history for this article.


      Locus employee Todd PierceAbout guest blogger— Dr. Todd Pierce, Locus Technologies

      Dr. Pierce manages a team of programmers tasked with development and implementation of Locus’ EIM application, which lets users manage their environmental data in the cloud using Software-as-a-Service technology. Dr. Pierce is also directly responsible for research and development of Locus’ GIS (geographic information systems) and visualization tools for mapping analytical and subsurface data. Dr. Pierce earned his GIS Professional (GISP) certification in 2010.


      [jwplayer mediaid=”16590″]

      Interested in Locus’ GIS solutions?

      Introducing Locus GIS+. All the functionality you love in EIM’s classic Google Maps GIS for environmental management— now integrated with the powerful cartography, interoperability, & smart-mapping features of Esri’s ArcGIS platform!

      Learn more about GIS+
       

      Celebrating 55 years of improving spatial thinking with GIS technology

      Today, November 15, is GIS Day—an annual celebration established in 1999 to showcase the power and flexibility of geographical information systems (GIS).

      Not only is GIS more powerful than ever before—it is also vastly more accessible.  Anyone with Internet access can create custom maps based on publicly available data, from real-time traffic conditions to environmental risk factors, to local shark sightings. Software developers, even those at small companies or startups, now have access to APIs for integrating advanced GIS tools and functionality into their programs.

      As the Director of EIM and GIS Development at Locus, I lead efforts to integrate GIS with our software applications to deliver our customers’ spatial data using the latest GIS technology. Let us take a look at how far GIS has come since I started working with it and at some of the new and exciting possibilities on the horizon.

      Origins of GIS

      Before you can understand where GIS is today, it helps to know how it started out. This year is the 55th anniversary of the work done by Roger Tomlinson in 1962 with the Canada Land Inventory. We consider this the birth of GIS, and Mr. Tomlinson has been called the “father of GIS”.

      The original GIS used computers and digitalization to “unlock” the data in paper maps, making it possible to combine data from multiple maps and perform spatial analyses. For example, in the image shown here from the Canada Land Inventory GIS, farms in Ontario are classified by revenue to map farm performance.

      An early GIS system from the Canada Land Inventory, in Data for Decisions, 1967

      An early GIS system from the Canada Land Inventory, in Data for Decisions, 1967
      Photo: Mbfleming. “Data for Decisions (1967).” YouTube, 12 Aug. 2007, https://youtu.be/ryWcq7Dv4jE.
        Part 1, Part 2, Part 3

      In 1969, Jack Dangermond founded Esri, which became the maker of, arguably, the world’s most popular commercial GIS software. Esri’s first commercial GIS, ARC/INFO, was released in 1982, and the simpler ArcView program followed in 1991. That year, 1991, is also the year I started working with GIS, although I used the TransCAD system from Caliper before starting with Esri software a few years later.

      Back then, GIS work required expensive software packages installed on personal computers or large mainframe systems. There was no Google Maps; all map data had to be manually loaded into your software. Getting useful data into a GIS usually required extensive file manipulation and expertise in coordinate systems, projections, and geodesy.

      While the government, utility, and resource management sectors used GIS heavily, there was not much consumer or personal use of GIS. As for me, I spent a lot of time in my first job digitizing paper maps by hand or trying to figure out why the map data I had loaded into a GIS was not lining up properly with an aerial photo.

      Esri’s ArcView 3.2 for desktop computers (from the 1990s)

      Esri’s ArcView 3.2 for desktop computers (from the 1990s)
      https://map.sdsu.edu/geog583/lecture/Unit-3.htm

      The Google Revolution

      How much has changed since those early days! After the release of OpenStreetMap in 2004, Google Maps and Google Earth in 2005, and Google Street View in 2007, GIS has been on an unstoppable journey—from only being used by dedicated GIS professionals on large computers in specific workplaces, to be accessible to anyone with an internet browser or a smartphone. High-quality map data and images—often the most expensive item in a GIS project in the 1990’s — are now practically free.

      Just think how revolutionary it is that anyone can have instant access to detailed satellite images and road maps of almost anywhere on Earth! Not only can you perform such mundane tasks as finding the fastest route between two cities or locating your favorite coffee shop while on vacation—you can also see live traffic conditions for cities across the globe; view aerial images of countries you have never visited, and get street level views of exotic places. Back in 1991, such widespread access to free map data would have seemed like something straight out of science fiction.

      Traffic conditions in London, 3:30 pm 10/16/2017, from Google Maps

      Traffic conditions in London, 3:30 pm 10/16/2017, from Google Maps

      South Base Camp, Mount Everest, Google StreetView

      South Base Camp, Mount Everest, Google StreetView

      Mashups in the cloud

      Obviously, the amount of spatial data needed to provide detailed coverage of the entire globe is far too large to be stored on one laptop or phone. Instead, the data is distributed across many servers “in the cloud.” Back in the 1990s, everything for one GIS system (data, processing engine, user interface) needed to be in the same physical place—usually one hard drive or server. Now, thanks to the internet and cloud computing, the data can be separate from the software, creating “distributed” GIS.

      The combination of freely available data with distributed GIS and the power of smart phones has led us to the age of “neogeography”—in which anyone (with some technical knowledge) can contribute to online maps, or host their maps with data relevant to their personal or professional needs. GIS no longer requires expensive software or cartographical expertise; now, even casual users can create maps linking multiple data sources, all in the cloud.

      Google’s MyMaps is an example of a tool for easily making your maps. Maps can range from the playful, such as locations of “Pokemon nests,” to the serious, such as wildfire conditions.

      These online maps can be updated in real time (unlike paper maps) and therefore kept current with actual conditions. Such immediate response is instrumental in emergency management, where conditions can change rapidly, and both first responders and the public need access to the latest data.

      Map showing wildfire and traffic conditions in northern California, 10/16/2017

      Map showing wildfire and traffic conditions in northern California, 10/16/2017
      https://google.org/crisismap/us-wildfires

      Furthermore, software programmers have created online GIS tools that let non-coders create their maps. These tools push the boundaries of distributed GIS even further by putting the processing engine in the cloud with the data. Only the user interface runs locally for a given user. During this period of GIS history, I created several mashups, including one for viewing natural hazard risks for my hometown. For this application, I combined several data types, including property lines, flood plains, landslide vulnerability, and wildfire risk.

      Floodplain data for Buncombe County, NC

      Floodplain data for Buncombe County, NC
      https://buncombe-risk-tool.nemac.org

      Programming GIS with APIs

      Another significant advance in GIS technology is the ability to integrate or include advanced GIS tools and features in other computer programs. Companies such as Google and Esri have provided toolkits (called APIs, or application programming interfaces) that let coders access GIS data and functions inside their programs. While neogeography shows the power of personal maps created by the untrained public, computer programmers can use APIs to create some very sophisticated online GIS tools aimed at specific professionals or the public.

      During my 10 years at Locus, I have helped create several such advanced GIS tools for environmental monitoring and data management. One example is the publicly-available Intellus application that Locus Technologies developed and hosts for the US Department of Energy’s Los Alamos National Laboratory. It uses an Esri API and distributed GIS to provide access to aerial images and many decades of environmental monitoring data for the Los Alamos, NM area. Users can make maps showing chemical concentrations near their home or workplace, and they can perform powerful spatial searches (e.g., “find all samples taken within one mile of my house in the last year”). The results can be color-coded based on concentration values to identify “hot spots”.

      Map from Intellus showing Tritium concentrations near a specified location

      Map from Intellus showing Tritium concentrations near a specified location
      https://www.intellusnmdata.com

      Locus Technologies also provides more sophisticated forms of analysis in its EIM cloud-based environmental management system. For example, contour lines can be generated on a map showing constant values of groundwater elevation, which is useful for determining water flow below ground. With such powerful spatial tools in the cloud, anyone at the organization, from facility managers to scientists, can easily create and share maps that provide insight into data trends and patterns at their site.

      Groundwater contour map

      Groundwater contour map where each line is a 10 ft. interval, from the Locus EIM system

      There’s a (map) app for that

      One particularly exciting aspect of GIS today is the ability to use GIS on a smartphone or tablet. The GIS APIs mentioned above usually have versions for mobile devices, as well as for browsers. Programmers have taken advantage of these mobile APIs, along with freely available map data from the cloud, to create apps that seamlessly embed maps into the user experience. By using a smartphone’s ability to pinpoint your current latitude and longitude, these apps can create personalized maps based on your actual location.

      A search in the Apple AppStore for “map” returns thousands of apps with map components. Some of these apps put maps front-and-center for traditional navigation, whether by car (Waze, MapQuest, Google), public transit (New York Subway MTA Map, London Tube Map), or on foot (Runkeeper, Map My Run, AllTrails). Other apps use maps in a supporting role to allow users to find nearby places; for example, banking apps usually have a map to show branches near your current location.

      What’s really exciting are the apps that allow users to enter data themselves via a map interface. For example, HealthMap’s Outbreaks Near Me not only shows reports of disease outbreaks near your location, but it also lets you enter unreported incidents. The GasBuddy app shows the latest gasoline prices and lets you enter in current prices. This “crowdsourcing” feature keeps an app up-to-date by letting its users update the map with the latest conditions as they are happening.

      The Outbreaks Near Me app for phones (left) and the GasBuddy app for tablets (right)

      The Outbreaks Near Me app for phones (left) and the GasBuddy app for tablets (right)

      Here at Locus Technologies, we use the power of GIS in our Locus Mobile app for field data collection. Users can enter environmental data, such as temperature or pH measurements from a monitoring well, and upload the data back to the EIM cloud for later review and analysis. The Locus Mobile app includes a map interface for navigating to data collection points and tracking visited locations. The app also lets users create new data collection points “on the fly” simply by clicking on the map.

      Locus Mobile map interface

      The map interface in the Locus Mobile app; blue dotted circles indicate locations that are not yet started.

      Looking to the future

      Where will GIS go from here? It’s possible that augmented reality, virtual reality, and 3D visualization will continue to expand and become as ubiquitous as the current “2D” maps on browsers and phones. Also, the “internet of things” will surely have a GIS component because every physical “thing” can be tied to a geographical location. Similarly, GIS can play an important role in “big data” by providing the spatial framework for analysis. It will be interesting to see where GIS is when we celebrate the 20th GIS Day in 2019!

      Thanks to the GIS Timeline for providing some of the history for this article.


      Locus employee Todd PierceAbout guest blogger— Dr. Todd Pierce, Locus Technologies

      Dr. Pierce manages a team of programmers tasked with development and implementation of Locus’ EIM application, which lets users manage their environmental data in the cloud using Software-as-a-Service technology. Dr. Pierce is also directly responsible for research and development of Locus’ GIS (geographic information systems) and visualization tools for mapping analytical and subsurface data. Dr. Pierce earned his GIS Professional (GISP) certification in 2010.


      [jwplayer mediaid=”16590″]

      Interested in Locus’ GIS solutions?

      Introducing Locus GIS+. All the functionality you love in EIM’s classic Google Maps GIS for environmental management— now integrated with the powerful cartography, interoperability, & smart-mapping features of Esri’s ArcGIS platform!

      Learn more about GIS+


      Top 10 cool features in EIM (that you probably didn’t know about)

      1. “Show locations on map” from a grid

      In many locations in EIM, you can make a map directly from your query results. Click on the “folded map” icon on a results grid anywhere in EIM to open the GIS application, where you can then view and save your results as a map query layer.

      So if you’re looking at TCE in specific locations, you can quickly map them and see what other parameters are present.

      Locus EIM - Show locations on map


      2. Save custom grid configurations

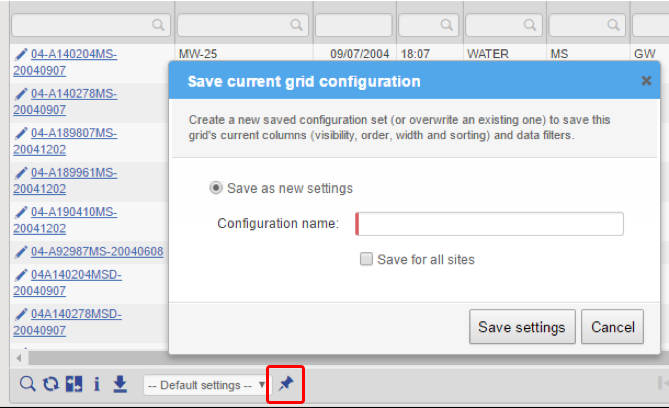
      When you see a pushpin icon below a grid, that means you can name and save your current configuration in the grid, including column visibility, column order, sorting, and column width.

      So if you use certain grids all the time, and prefer to view the data in a specific way, just click the pushpin and save your configuration for future use.

      Locus EIM - Save custom grid


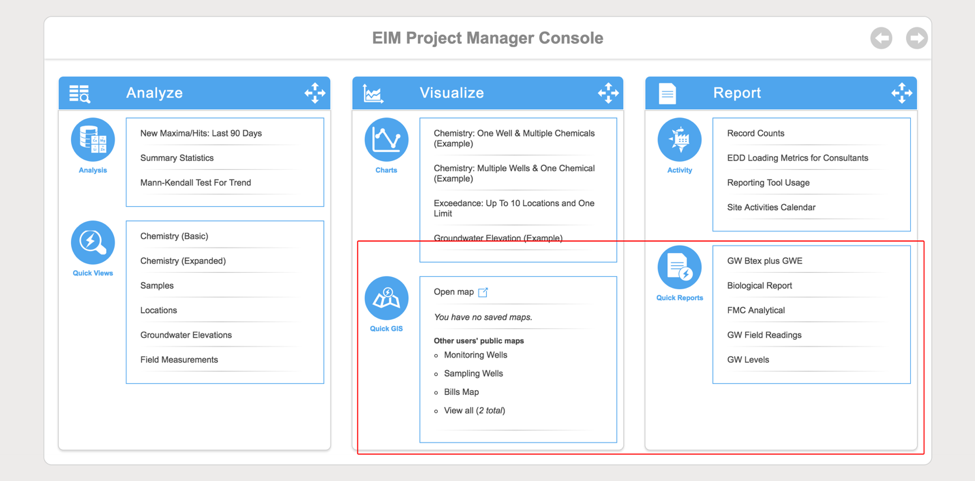
      3. Save and share maps and reports on the dashboard

      You can share saved maps and formatted reports with your colleagues and team members on the Project Manager Console dashboard. Saved maps and quick reports will show up under the sections “Quick Reports” and “Quick Maps”.

      See Tip #4 to learn how to make this dashboard your default homepage.

      Locus EIM - Save and share maps


      4. Set your homepage and your preferred default grid row count

      EIM user options includes some very cool features. You can access your user options from the EIM menu: just click [your username] > Manage Profile.

      Here, you can set your preferred homepage, enable filter options for easier login, and— our favorite— the option to adjust the default number of records to display in all EIM grids (20 is just never enough!)

      Locus EIM - Set your homepage


      5. Lab Invoice Tracking

      Full invoice tracking down to the parameter delivered level, to help you confirm that the lab gave you what you ordered, and that they’re charging you for exactly what they gave you.

      You can find these forms at Input > Analytical > Lab Invoices.

      Locus EIM - Lab invoice tracking


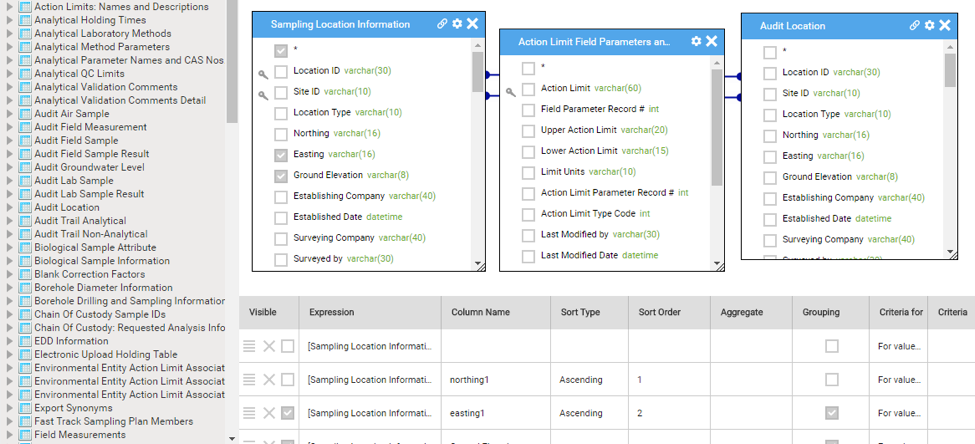
      6. Simple or complex query building in a drag-and-drop interface

      For users wanting to go beyond the standard “out-of-the-box” queries, EIM has an advanced query builder that lets SQL lovers go wild and share their results with other. You can even query data across multiple EIM sites to which you have access.

      Locus EIM - Query builder


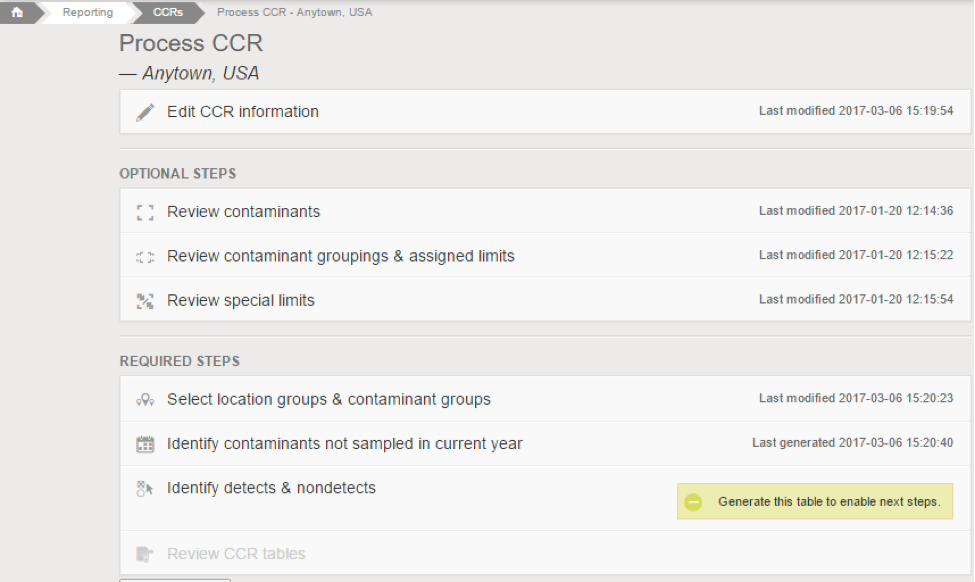
      7. Easy data preparation for annual Consumer Confidence Reports (CCRs)

      If you have the Locus EIM Water configuration, you will be able to prepare data tables for the CCR reports that all water providers are required to prepare annually. This is a huge timesaver compared to manually preparing these data summaries that are required by the Safe Drinking Water Act.

      Locus EIM - CCR


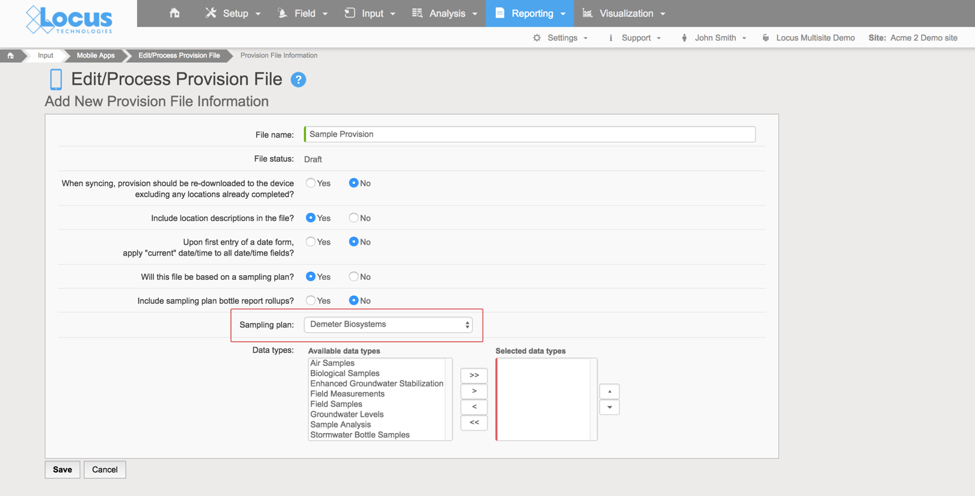
      8. Send your sampling plan directly to your mobile device

      With EIM’s integration with mobile, you can create a sampling plan in EIM and send that plan to one or more people to perform field sampling. This saves mountains of time and ensures your field teams have the correct information they need to collect their field data.

      The sampling team can sync anytime to have team members back in the office review the interim data.

      Locus EIM - Mobile sample plan


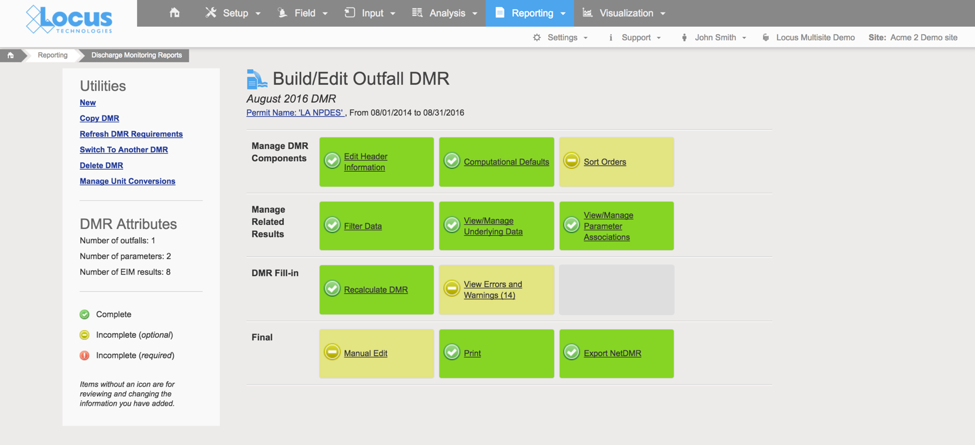
      9. Create NetDMR submittals directly from EIM

      If you have to submit EPA NPDES DMRs, EIM can create the electronic NetDMR output, saving you time and effort and banishing (hopefully) those old, complex, and overly difficult paper forms.

      Locus EIM - DMR


      10. Support menu alerts you when new user guides, cheat sheets, training videos, or FAQs are posted

      Locus is always busy creating new guide documents and help materials for our users, but it was hard to know when we added some new content.  Now, our Support menu itself will flag you as soon as something new is posted so you can check it out!

      Locus EIM - Suport menu alerts