The Promise and Challenge of an AI Chatbot for Environmental Data Management
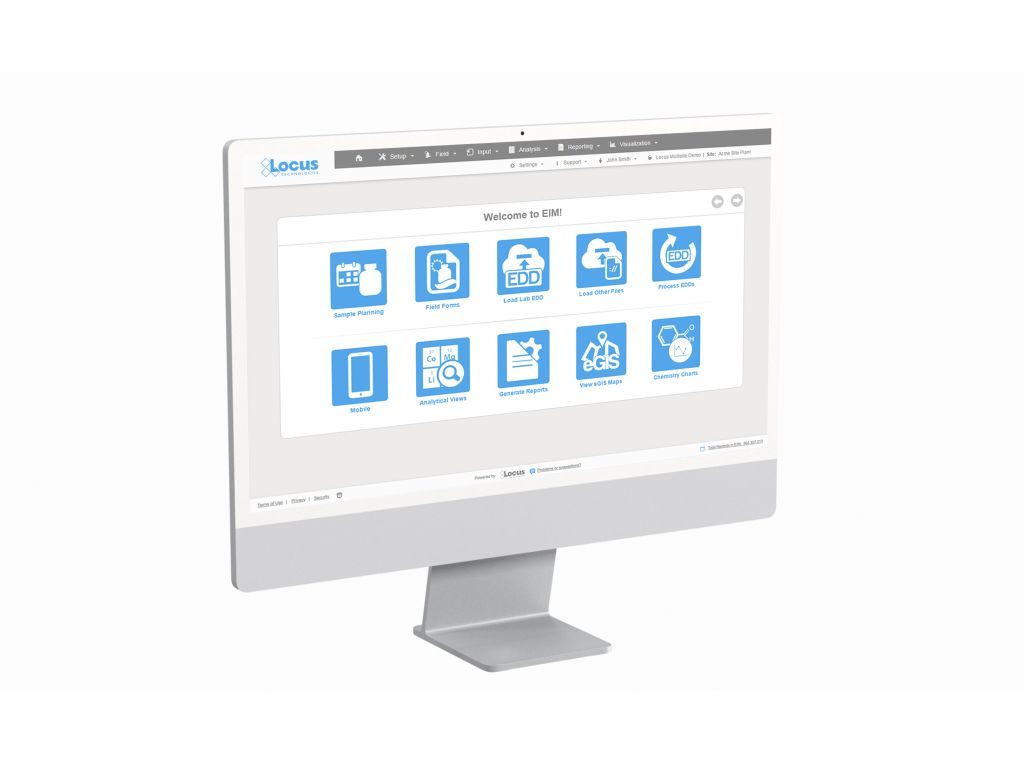
Locus Technologies continues to explore new frontiers such as a “natural language” AI chatbot for data stored in Locus software.
Locus Technologies continues to explore new frontiers such as a “natural language” AI chatbot for data stored in Locus software.
The GIS visualization shows how the chlorine levels near our product manager’s home have normalized over the past 6 weeks.
When looking for a GHG reporting program, there is one element that is typically overlooked. This short video gives us more insight.
2022 has given us a wealth of new features and growth! Both of our platforms have undergone improvements to enhance our client’s user experience. Let’s look at all the new features for 2022.

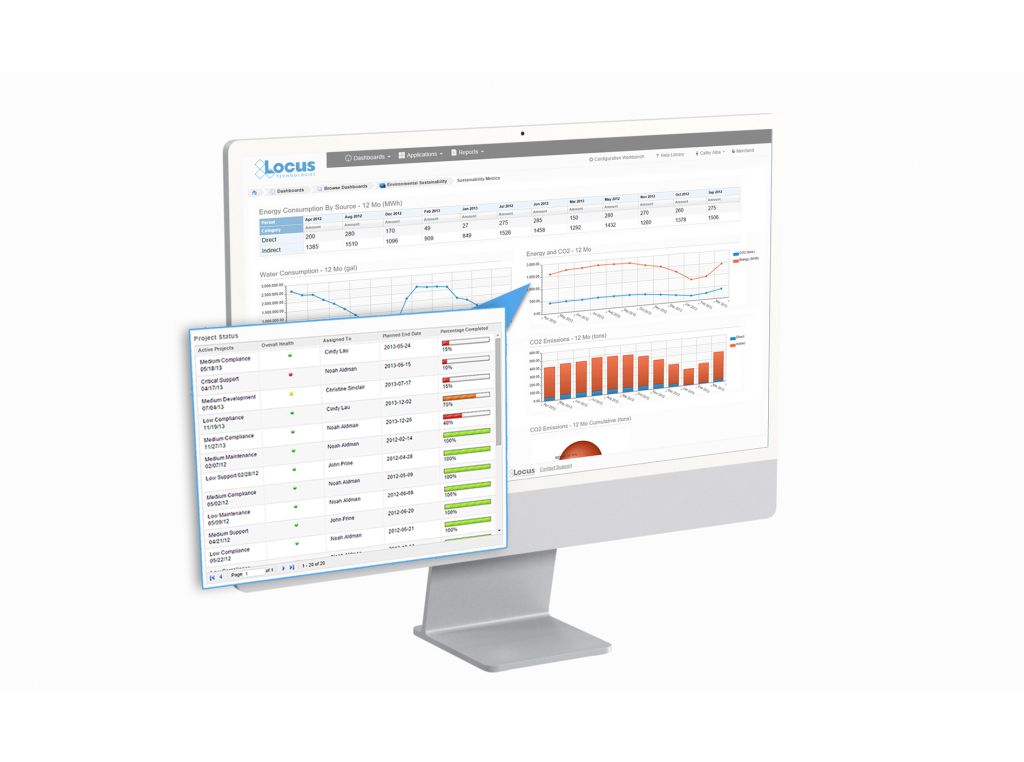
1. New Site Metrics dashboard allows immediate visibility into your data with clickable mapping. This is especially powerful for customers with multiple sites where they want to keep track of site activity and usage.
2. Finding data can sometimes be overwhelming especially when you have hundreds, if not thousands, of locations and numerous analytical parameters to review. Locus added advanced database search tools to support multiple search terms and ‘exact match’ searches, making it easy to find exactly what you want with a couple of key words and a click. Never has finding the right results from large complex datasets been so easy.
3. Locus has enhanced its API functionality to enable easier integration with external BI tools, including Tableau, PowerBI, and other apps. Now, customers that rely on external business analytical tools will have quick and easy access to data to combine with other internal data sources.
4. Locus document management has been taken to the next level by allowing customers to link documents from any external library directly into their sites, monitoring locations, samples, and more. This means with a simple click, users can go to lab reports, regulatory reports, and any other current or historical document associated with the site. If you are using SharePoint, for example, to manage documents – they can be accessed directly from Locus software. Document access and security will be preserved by existing document library access controls.
5. 2022 was the year of “help”. In addition to the advanced search, Locus added a new Help Browser to provide access to comprehensive documentation for every feature of the software. It is similar to the familiar “site map”, only the links take you to help content. With this new feature, users can view help in a single location vs having to access the information on each individual screen. For new users, or infrequent users, this will be their new favorite feature.

1. Locus’ Survey/Questionnaire tool enables you to securely & easily obtain data globally without the burdens of training or maintaining user lists. The survey system effortlessly supports data entry from external organizations (such as suppliers) or even occasional users internal to your organization, with a simple link click.
2. Locus released a new pivot table tool that enables you to perform full data analysis on any query in the system. Data may be grouped and organized by any value. Output options include bar charts, heatmaps, tables, area charts, scatter charts, and tree maps. In support of the output options, Locus has improved the ability for users to create dashboards more easily.
3. Complex inspection and audit forms require branching, sophisticated, scoring, and automated responses. Locus added new question types to its inspection/ audit module, including conditional questions based on responses to one or more previous questions. Locus augmented the scoring calculation mechanism and automated creation and tracking of corrective action.
4. In today’s world, users need access to environmental data on the go. Locus augmented its mobile offerings to include configurable layouts for mobile users, with compact forms specially designed for smartphone and tablet access.
5. Today’s managers want immediate access to the data they need. Locus’ new Landing Page feature makes it simple to configure the dashboards, bookmarks, and record lists. This enables the user to review just the areas they need to see and navigate efficiently to complete the work.
MOUNTAIN VIEW, Calif., 14 February 2023 — Locus Technologies, the leading EHS Compliance, and ESG software provider, today announced that San Jose Water (SJW), an investor-owned public utility providing water service to a population of approximately one million people in the Santa Clara Valley, has expanded Locus’ environmental information management software to use Locus GIS+ for advanced GIS analysis.
SJW has been using Locus SaaS and mobile app since 2014 to manage its field data collection, water quality compliance, and regulatory reporting. SJW also uses Locus to track sewer discharges and well blow-offs.
“Our responsibility is to ensure our customers receive the highest quality drinking water from their taps. We monitor the quality and cleanliness of our water in terms of state and federal regulatory requirements. In 2021, our highly experienced staff collected more than 1,000 regulatory and non-regulatory samples from our distribution system and treatment plant, generating over 23,000 data points. To manage this data effectively, we used Locus’ cloud-based software. GIS mapping capabilities are essential for our environmental data analysis. Locus GIS+ will allow quick data visualization and is a quantum leap forward with advanced analysis tools that use Esri’s Smart Mapping technology,” said Suzanne DeLorenzo, the Director of Water Quality at San Jose Water.
“Locus’s mission is to help organizations, such as San Jose Water, to achieve their business goals by providing them the software tools to manage key data associated with water quality and compliance reporting,” said Neno Duplan, CEO of Locus. “With GIS+, SJW will have all the tools they need to perform a wide range of geospatial data analysis across their distribution system. Our water quality management cloud-based software, coupled with GIS+ and Locus Mobile for field data collection, provides our customers with a highly scalable and feature-rich application that gives water utilities strong analytical power and advanced GIS capabilities.”
Locus GIS+ is powered by Esri’s ArcGIS platform and offers various advanced features— including enhanced cartography, comprehensive spatial data analysis, and the ability to use the customer’s map data through integration with ArcGIS Online and Portal for ArcGIS.
ABOUT SAN JOSE WATER
Founded in 1866, San Jose Water is an investor-owned public utility and is one of the largest and most technically sophisticated urban water systems in the United States. Serving over one million people in the greater San Jose metropolitan area, San Jose Water also provides services to other utilities, including operations and maintenance, billing, and backflow testing. San Jose Water is owned by SJW Group, a publicly-traded company listed on the New York Stock Exchange under the symbol SJW. SJW Group also owns Connecticut Water Company in Connecticut; Maine Water Company in Maine; and SJWTX, Inc. (dba Canyon Lake Water Service Company) in Texas. To learn more about San Jose Water, visit www.sjwater.com.
MOUNTAIN VIEW, Calif., 11 April 2022 — Locus Technologies, the leading EHS Compliance and ESG software provider, today celebrates the 25th anniversary of its founding, and with it, a quarter-century of customer success. Locus looks back on its founding as a Silicon Valley leader in EHS & ESG software with pride in its leadership through expertise, stability, and innovation.
Locus was founded in 1997 with a revolutionary vision that set the framework for what is now widely known as environmental, social, and corporate governance (ESG) and environmental, health, and safety (EHS). Locus envisioned a simplified and data-driven approach, offering software in the cloud, on mobile devices, and as a service. The company pioneered SaaS (Software as a Service) model in EHS, ESG, and water quality management spaces in 1999 and never installed its software on customers’ premises.
Over 25 years, Locus has pioneered cloud environmental solutions, online and mobile GIS (Geographic Information System) services, has revolutionized environmental information management, and AI and IoT technologies for organizations ranging from Fortune 500 companies to forward-facing municipalities and the US Government.
Locus recently broke new ground by releasing the first Visual Calculation Engine for ESG Reporting. Locus’s visual calculation engine helps companies quickly set up and view their entire ESG data collection and reporting program, enabling full transparency and financial-grade auditability throughout the entire process.
As the industry continues to evolve, competitors merge and disappear. New markets emerge and grow. Locus remains a constant in the environmental space, an innovative and independent pioneer.
“For 25 years now, Locus has brought together industry-leading experts in EHS, sustainability, and technology. Although regulations and requirements have changed over the years, that combination remains at the core of what Locus does, as demonstrated by our stability and long-term customer partners. We look forward to continuing our path of growth using those same values for the next 25 years.” said Wes Hawthorne, Locus President.
Locus Founder and CEO, Neno Duplan is proud to look back on the growth of Locus over the last 25 years. He said, “Locus did not start in the clouds, but back in 1997, we had a rather good view. Locus’s vision for better global environmental stewardship has not changed since its inception. We focus on empowering organizations to track better and mitigate the environmental impact of their activities. That vision has come to fruition through the Locus software services used by some of the world’s largest companies and government organizations. Locus’ SaaS has been ahead of the curve in helping private and public organizations in not only managing their water quality, EHS compliance or ESG reporting but also turning their environmental information into a competitive advantage in their operating models.”
MOUNTAIN VIEW, Calif., 17 March 2020 — Locus Technologies, industry leader in environmental software, today announced that Evergreen Natural Resources, a privately-held energy company based in Denver, Colorado, has chosen Locus environmental software for their data collection and management.
Evergreen Natural Resources has selected Locus’ environmental software, EIM, after proof of concept and usability testing. They will seek to utilize Locus EIM as a laboratory database management system, and for regulatory report generation, while also taking advantage of Locus’ premium GIS tool, GIS+, as well as Locus Mobile.
“With over 2,600 unique locations that require routine sampling, Locus’ environmental and GIS software allows us to collect, manage, visualize, and analyze data. Locus EIM aligns with our strategy to increase availability and reduce our internal application infrastructure footprint,” said Cesar Zayas, IT Director of Evergreen.
“Evergreen Natural Resources is a rapidly emerging company in the energy sector, and their decision to utilize Locus’ powerful environmental software shows their objective to manage their data quality at the highest level. Our scalable software will match their continued growth,” said Wes Hawthorne, President of Locus.
299 Fairchild Drive
Mountain View, CA 94043
P: +1 (650) 960-1640
F: +1 (415) 360-5889
Locus Technologies provides cloud-based environmental software and mobile solutions for EHS, sustainability management, GHG reporting, water quality management, risk management, and analytical, geologic, and ecologic environmental data management.
