Emissions Management Software: GHG Reporting Deadline for the Year 2024 Extended from March 31, 2025, to May 30, 2025
Greenhouse Gases (GHG) Reporting Deadline for the Year 2024 Extended from March 31, 2025, to May 30, 2025.
Greenhouse Gases (GHG) Reporting Deadline for the Year 2024 Extended from March 31, 2025, to May 30, 2025.
The US EPA’s Clean Ports Program offers support for emissions reduction initiatives as port-related environmental challenges increase.
Locus Data Managers, Marian Carr and Jen Grippa, voice some common issues and frustrations with regulatory reporting.
Attention all water providers: the EPA’s UCMR 5 list includes 30 contaminants (29 PFAS and lithium) that both small and large water systems have to test for and report. Can your current environmental solution handle it?
Locus EIM environmental software can handle new chemicals and analyses seamlessly. Both the standard Locus EIM configuration and the Locus EIM Water configuration (specially tailored to water utilities) are built with ever-changing regulations in mind.
We’ve put together some helpful background and tips for water providers preparing for UCMR 5 monitoring.
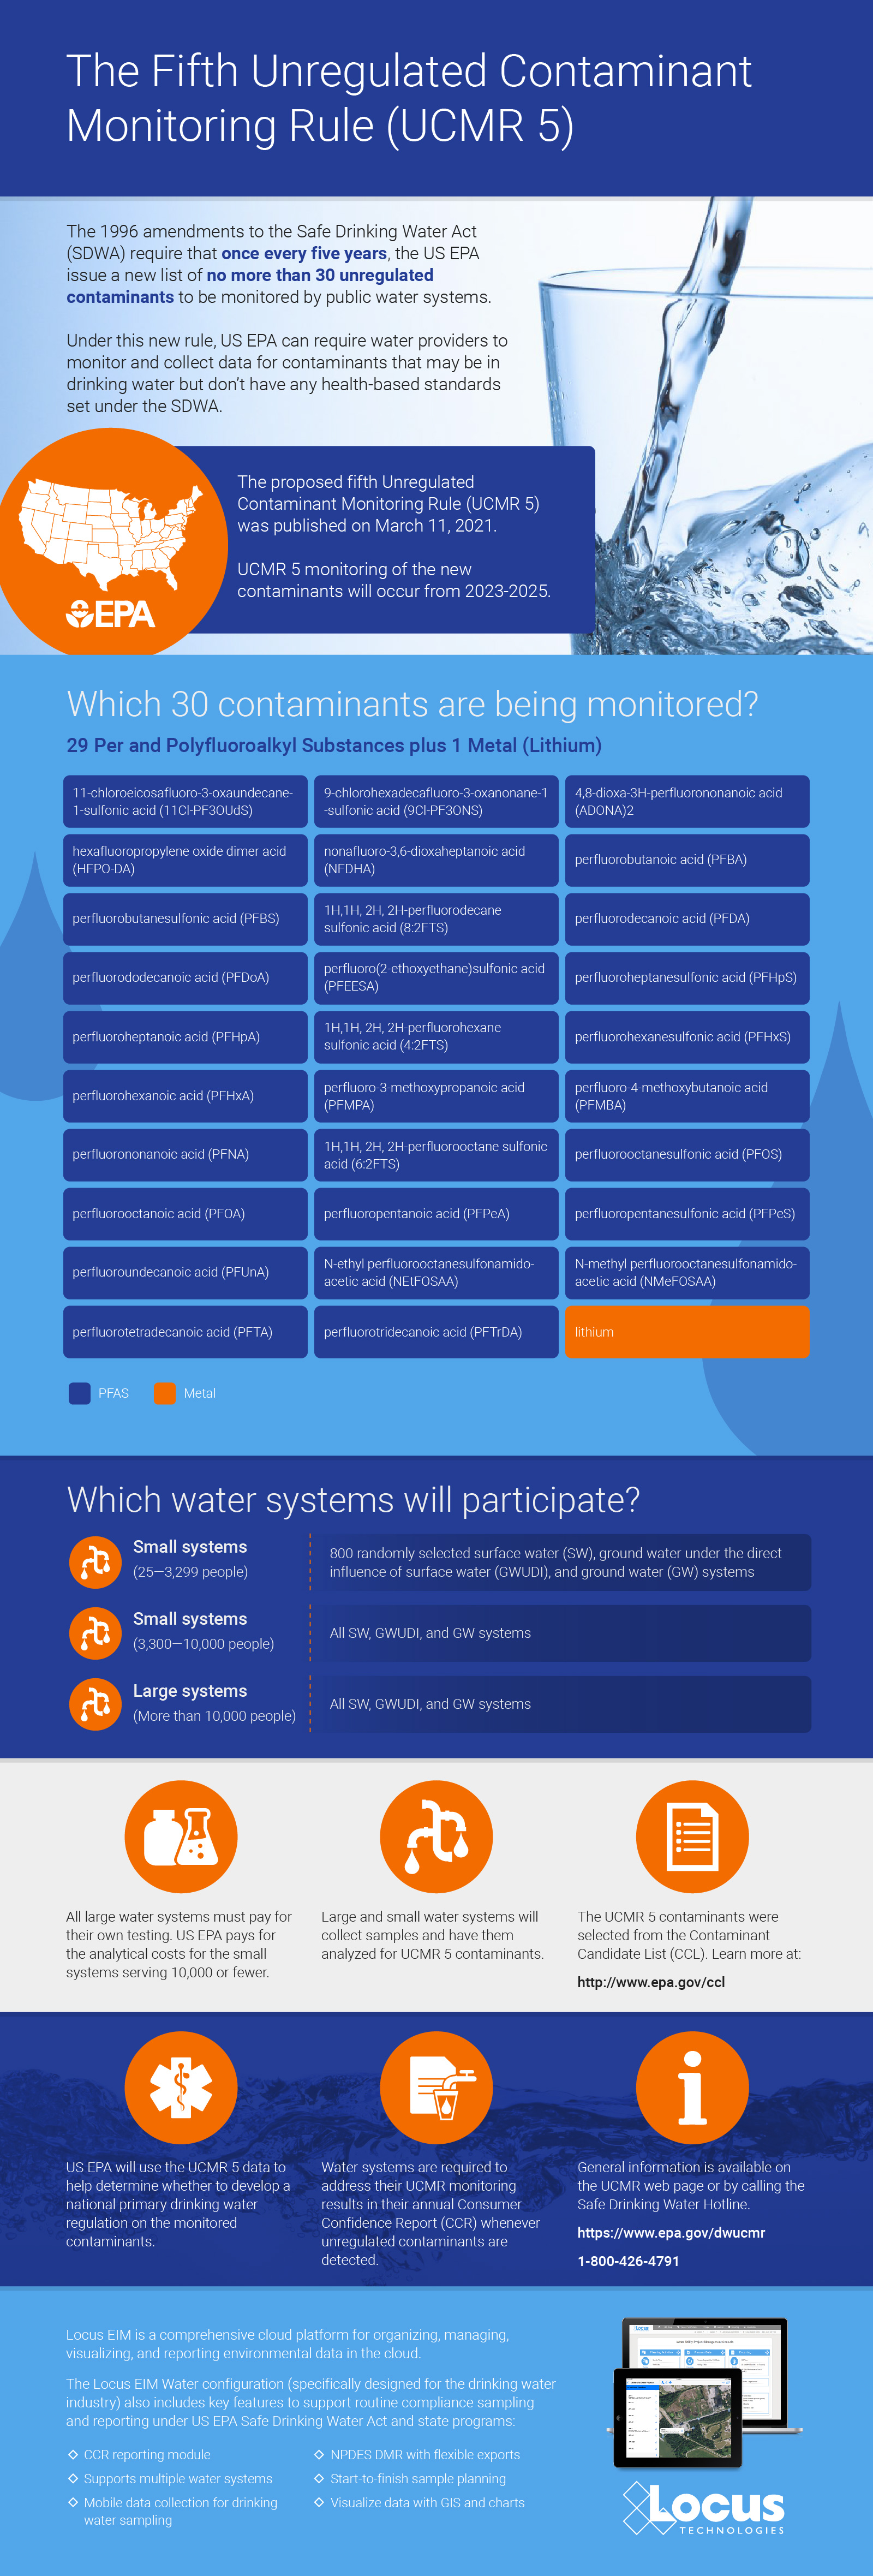
In 1996, Congress amended the Safe Drinking Water Act with the Unregulated Contaminant Monitoring Rule (UCMR). Under this new rule, US EPA can require water providers to monitor and collect data for contaminants that may be in drinking water but don’t have any health-based standards set (yet) under the SDWA.
More than 150,000 public water systems are subject to the SDWA regulations. US EPA, states, tribes, water systems, and the public all work together to protect the water supply from an ever-growing list of contaminants.
However, under the UCMR, US EPA is restricted to issuing a new list every five years of no more than 30 unregulated contaminants to be monitored by water providers.
This helps reduce the burden on water providers, since monitoring and testing for the existing long list of regulated contaminants already requires a significant investment of time and resources.
Throughout the course of this monitoring, US EPA can determine whether the contaminants need to be officially enforced— but this would require regulatory action, routed through the normal legislative process.
Contact your Locus Account Manager for help setting up your EIM database in advance of your sampling schedule, and we’ll make sure you’re equipped for UCMR 5!
Not yet a customer? Send us a quick note to schedule a call or a demo to find out how Locus software can completely streamline your water sampling and reporting.
More helpful links:
In today’s world, organizations must measure and report their environmental performance and adherence to corporate social responsibility (CSR) and environmental, social, and governance (ESG) principles. Stakeholders, including regulators, investors, customers, rating agencies, research analysts, NGOs, and the public, are all starting to evaluate non-financial criteria in addition to companies’ financial health and performance. Companies also must comply with EHS regulations in the jurisdictions in which they operate. While most environmental regulations have been around for half a century, the gathering and reporting of sustainability, CSR, and ESG data is relatively new and is becoming an essential part of corporate annual reports.
Companies are increasingly discovering that data-driven ESG reporting has gone from a “nice to have” to a business requirement. But it’s challenging to keep up with such reporting when a company’s data is in spreadsheets or numerous unconnected silo applications. Companies suffer when their domain experts and others rely on manual and outdated processes to accomplish ever-increasing reporting requirements.
It appears imminent that the U.S. Securities and Exchange Commission (SEC) will in near future regulate ESG disclosure as a requirement by using some kind of universal reporting framework.
Wouldn’t it be nice to have a single enterprise and cloud-based software system to perform all EHS, ESG, and CSR reporting from a single software platform? That is what this article is about.
Until recently, it was common to refer to sustainability and ESG interchangeably. But over time, their meanings have grown apart. Sustainability can mean many different things, depending on the discussion context, whereas ESG has become the preferred term for capital markets and has frequently appeared in the headlines. The transition from sustainability to ESG performance indicates a maturation of business practices leading to more precise measurements of a company’s performance, its impact on the environment, and the risk it carries for investors when there is a low environmental performance or spotty compliance with EHS regulations. As a result, companies need to improve the way they collect and track metrics for ESG reporting.
To compare companies relative to their impacts on the planet’s climate or well-being, one must take a holistic approach that includes many factors. Among those to consider when assigning a score to a company are:
This holistic approach requires new, integrated, and interactive software tools. Such software, equivalent to the ERP (Enterprise Resource Planning) software that made its appearance in the early nineties, should provide complex tracking of all kinds of emissions linked to company-owned assets and services in real-time (Scope 1 emissions). It should also include emissions attributable to its supply chain, known as Scope 2 and Scope 3 emissions. Old ERP software applications integrate the processes needed to run a company in a single system: planning, purchasing inventory, sales, marketing, finance, and human resources. However, they do not typically integrate any technical information or activity related to emissions, waste, climate, environmental compliance, etc. Never mind that much of the ERP software in the market today is obsolete, running on the outdated technology of the seventies and eighties, and hard to integrate with anything.
The traditional approach of bolting-on another application to an existing software infrastructure is not the road to go down concerning ESG data collection and to report. Emissions tracking, sustainability, and other environmentally related verticals are typically “heavier” and more resource-intensive than antiquated ERP systems can handle without significant investment. Many legacy ERP systems, caving in under their weight, are hugely and unnecessarily complicated and are slowly being deprecated. New, cloud-based Software as a Service (SaaS) technologies hold more promise as they allow for the fast deployment and easy integration and sharing with third-party applications, suppliers, consultants, and even regulators. One such example is the Locus Platform or only LP. It is a SaaS that automates data collection, management, and reporting. It is of financial-grade, auditable, available, and actionable 24/7 from anywhere. This platform integrates EHS compliance and ESG reporting applications under a single system of record, giving users all necessary tools to optimize their compliance, sustainability management, and reporting.
To kill two birds with one stone! Or perhaps a friendlier version for bird-lovers is a German version, “mit einer Klappe zwei Fliegen schlagen” – which means to kill two flies with one swat. Or kill two mosquitoes with one slap! This English language idiom is not to be taken literally but instead refers to a single activity or action that accomplishes two (or more) goals or tasks. And that is precisely what any advanced EHS/ESG software should do.
Over the last twenty or so years, companies have spent considerable resources (in both time and money) buying and installing such EHS compliance-related verticals as permit management, waste, incident reporting, water quality, air emissions, greenhouse gases (GHG), sustainability, and so on.
More than one acquisition is often needed to cover their reporting needs, resulting in an assortment of tools that may or may not be compatible with one another.
As I mentioned at the beginning of this blog, a new acronym, ESG, has recently shot to prominence. C-level executives are asking their EHS managers a question “Do we need more software to manage our ESG reporting? Smart companies should not rush and start searching Google for “ESG Software.” Instead, they should take a hard look at what they have on EHS compliance and sustainability management and augment it with ESG reporting. After all, everything that needs reporting or is worth reporting under the ESG acronym probably already exists and is hidden in their EHS compliance software, provided they selected the right one. Companies that have implemented integrated EHS compliance and sustainability management systems may already have most of the ESG data they need to report within their existing applications. If they do not, or if they have a “mutual fund” portfolio of EHS software already installed in unconnected silo applications, this is the time to clean house and switch to a unified reporting platform that integrates EHS and ESG into a single system of record and reporting. Companies that head down this path would not just be “killing two birds” but more: they would lower their costs, meet their new reporting needs, gain a better understanding of their environmental impacts, and potentially enhance their ESG reputation.
Locus specifically built its configurable Locus Platform to unify many current and future applications on a single SaaS platform. The LP offers a wide range of features and functionality to power sustainability measurement, management, and reporting across the entire corporation. But it also provides a launching pad for EHS-related and unrelated apps that are interoperable and share relevant information, thus avoiding any double input. Among its features are the following:
While EHS compliance applications are more comprehensive and dive deeper into the root causes of contamination and emissions, ESG reporting is much less complicated and requires fewer data to report and less scrutiny of such data. For example, federal and state standards such as Discharge Monitoring Reports (DMRs) require detailed water quality reporting, requiring companies to prove that their releases fall within allowable quantities (flow volume) and that chemicals in discharge samples do not exceed regulatory limits for the chemicals of concern. Consequently, the software to manage water quality for EHS reporting needs to provide automated tools to prove that: samples were collected correctly, sample holding time was not exceeded, the receiving laboratory tested samples using proper protocols, lab equipment, etc. Labs also must maintain calibration logs for equipment used in testing, testing details, and so forth.
None of these QC results and associated metadata are necessary for ESG reporting under voluntary reporting protocols such as the Carbon Disclosure Project (CDP), the Global Reporting Initiative (GRI), The Climate Registry (TCR), or GRESB, the leading ESG benchmark for real estate and infrastructure investments. Those protocols mainly require information to be assembled on volumes (quantities) of clean water used, water sources, and contaminated water discharge volumes. They may also include some identification of chemicals in releases but with no details and no testing protocols required. The GRI 303 standard on water and effluents, for example, requires companies to collect information on water use from withdrawal to consumption and discharge and to report on associated impacts on people and ecosystems, including at a local level. This standard enables investors to assess a company’s overall exposure to water risk, as it addresses the whole supply chain.
There are plenty of overlaps in this undertaking. Smart software like the Locus Platform can help avoid any double input between EHS compliance data and ESG reporting. For example, once inputted, facility information is instantly available to all apps, whether the final output of the app is for EHS or ESG reporting. If a spill incident is created and recorded in the EHS Incident App, another app for waste or groundwater contamination can track and manage that spill’s consequential emissions. Even a small spill could become costly if the spill creates long-lasting contamination of soil and groundwater below it. Reporting for spill under EHS compliance regulations is very different from reporting for ESG, yet the two can use the same database. Examples like this are numerous.
Locus continuously adds new features to its Locus Platform to expand EHS, Sustainability, and ESG interoperability and avoid and minimize data’s double input. Companies need a single system of record to house their sustainability data, EHS Compliance, and ultimately report ESG information across multiple reporting standards. Locus’ ESG SaaS delivers in this regard. Moreover, it can grow with customers’ needs thanks to its off-the-shelf configurability.
In short, the Locus Platform is an all-in-one sustainability management software tool that helps companies streamline data collection, improve data quality, benchmark performance, and communicate more effectively with internal and external stakeholders. Locus’s software automates collecting, reducing, and managing data to monitor and track critical metrics around EHS, CSR, and ESG performance. Once the data is in the Locus Platform, the software creates ESG, sustainability, and other reports adhering to multiple reporting standards to improve communications with stakeholders and show greater transparency.
Many large companies must report to various regulatory or voluntary bodies. A company’s software of choice should support all the major reporting requirements to avoid double input or separate calculations for some jurisdictions. This is particularly true for GHG reporting.
When selecting its software system of record for EHS and ESG reporting, a company should strive to “enter once, report many times.” The gold standard is to have a system configured to report to multiple agencies from a single dataset. Before selecting software, companies should review their reporting requirements to see if their software handles them. Essential reporting requirements include state or federal regulations, internal CSR, and ESG based on whatever standard their organization adheres to, such as CDP, GRI, or more recent World Economic Forum (WEF) attempt to standardize many voluntary standards.
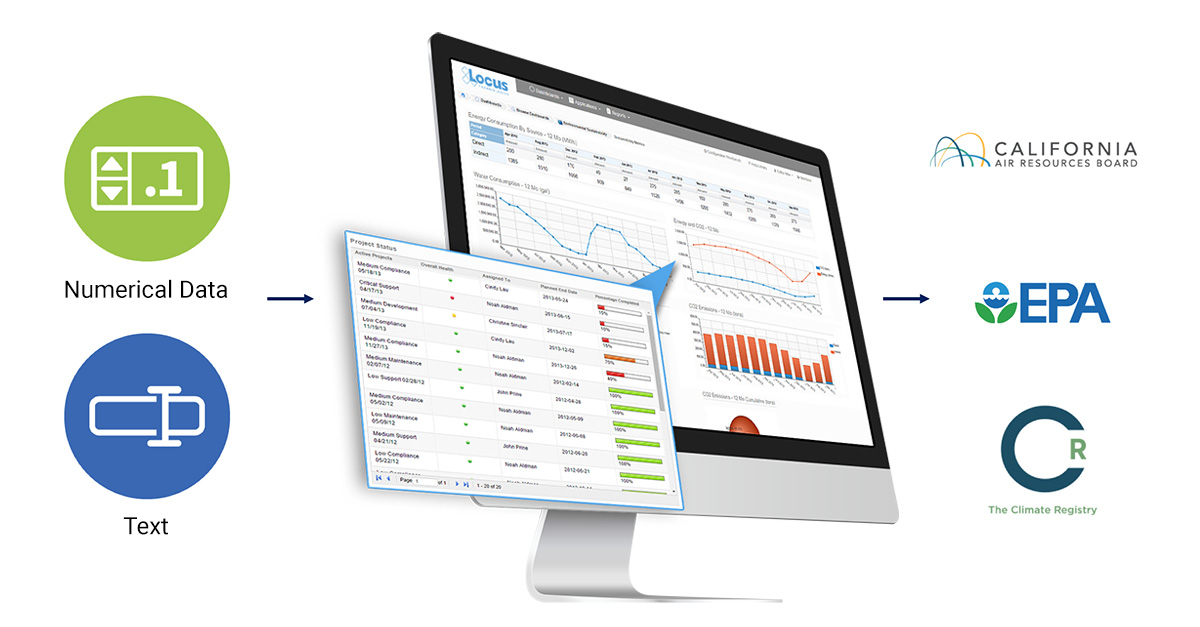
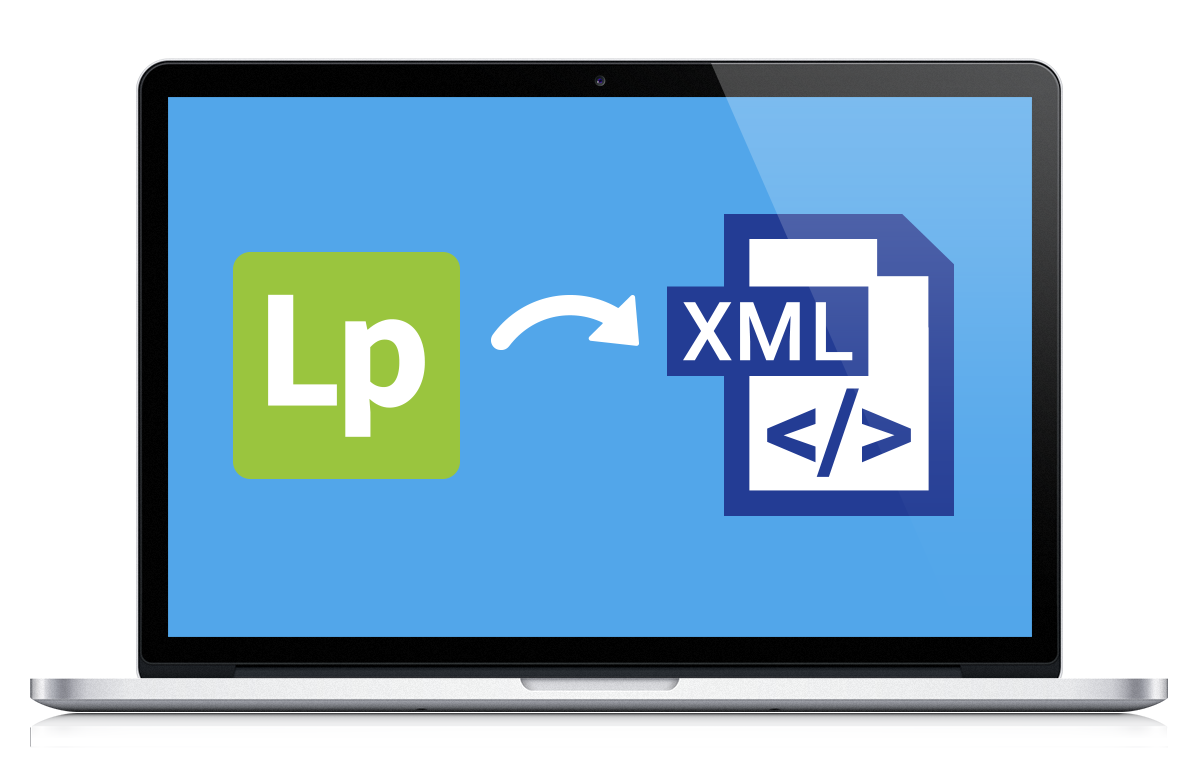
Companies also must consider export formats. For example, when selecting a GHG management software, the company must ensure their software of choice includes exports to XML, a standard format for Environmental Protection Agency (EPA) and California Air Resources Board (CARB) reporting, and an option for reporting to other agencies. Having such outputs easily generated from the software will save time and money during the reporting season. The XML report generation capability allows facilities to directly upload their GHG data instead of completing the complex web forms found in the EPA Electronic Greenhouse Gas Reporting Tool (e-GGRT) and CARB reporting worksheets (Cal e-GGRT).
Locus provides direct XML exports to the GHG application in its Locus Platform software. Locus is the only software vendor that is an approved GHG verifier by the California Air Resources Board (CARB) under AB 32, the California Global Warming Solutions Act of 2006. Since the program’s inception, Locus has performed more GHG verifications than any other company and learned much by observing GHG reporting practices at many companies. As a result, Locus has prioritized enhancing its GHG software to make it easier for customers to manage GHG emission inventory tracking and reporting requirements. Locus’ GHG application is fully integrated with compliance tracking, asset management, and IoT automation (including remote sensing). This ability to generate XML reports further streamlines customers’ report submission process to the EPA and CARB.
For example, data entry for EPA and CARB is consolidated in the GHG application, eliminating the need to maintain separate agency spreadsheets and software. This supports robust trend tracking and reporting, reducing data entry, reporting time, and error opportunities. For many greenhouse gas subparts, including Subparts C, D, W, and NN, the software automatically generates XML reports. These can be easily configured for any greenhouse gas industry segment.
From our experience, many of our customers have experienced frustration with the speed and difficulty of entering their data into the state and federal GHG reporting tools. The Locus Platform XML reporting tool lets customers bypass those clumsy interfaces completely. This saves time, helps companies avoid transcription errors, and ensures consistency with GHG data submitted to multiple reporting programs. As more and more regulatory and voluntary programs embrace automated report submittal through the XML format, Locus continues to expand this functionality to simplify reporting for our customers.
ESG reporting and EHS compliance are inherently cross-functional and coupled activities. Managing them together rather than separately is better. Locus built its platform on a highly secure, scalable, configurable, and efficient multi-tenant software platform. The traditional approaches to using a separate app or a spreadsheet for EHS compliance, sustainability management, or ESG reporting were ripe for digital transformation to a single platform of record. This is the main reason that we built the Locus Platform from scratch to take advantage of the latest cloud technologies and flexible and domain-driven reporting requirements.
Quality of data and standard protocols remain one of the biggest challenges to evaluating companies’ ESG performance. Such data are only credible if they come from the existing sources of EHS compliance data that are much more scrutinized and verified by regulators. Any potential conflict between two sets of the same data can spell disaster for the reporting entity. The perceived value of sustainable investments and practices is inevitably linked to data accuracy, consistency, and reproducibility.
The Locus Platform empowers companies to gain a holistic view of their sustainability performance by providing the means for them to assemble and report their EHS and ESG data from within a single system. Sustainability managers need comprehensive digital tools and real-time, AI-driven insights to keep up with the latest ESG disclosure requirements, trends, and stakeholder requests for information. Whether an organization is just getting started with sustainability initiatives or doing it for a while, Locus Technologies combined EHS and ESG software, explicitly tailored for multi-jurisdictional and multi-media reporting, can help companies make better and faster decisions and reduce the reporting cycle time. By quickly transforming corporate EHS compliance to ESG reporting, companies can improve their ESG score while lowering operational risks and costs. Locus software breaks down silos and provides a stable platform to work collaboratively with diverse teams of experts across the customer organization, its consultants, and its suppliers.
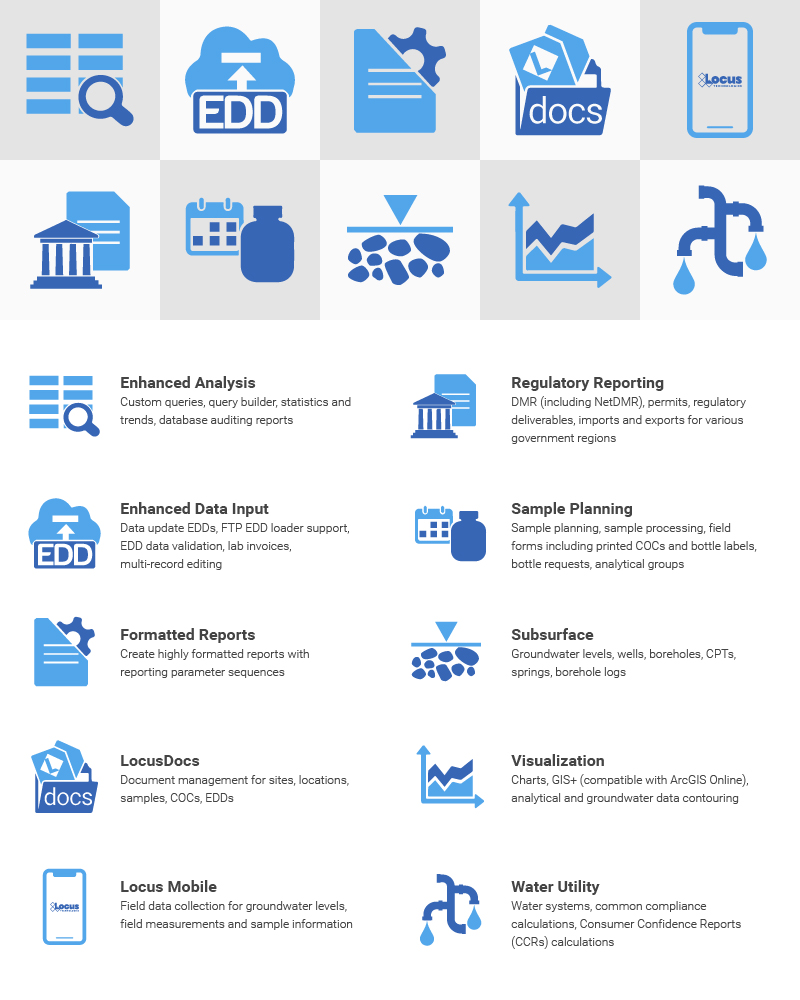
Let’s look back on the most exciting new features and changes made in EIM, Locus’ environmental data management software, during 2019!
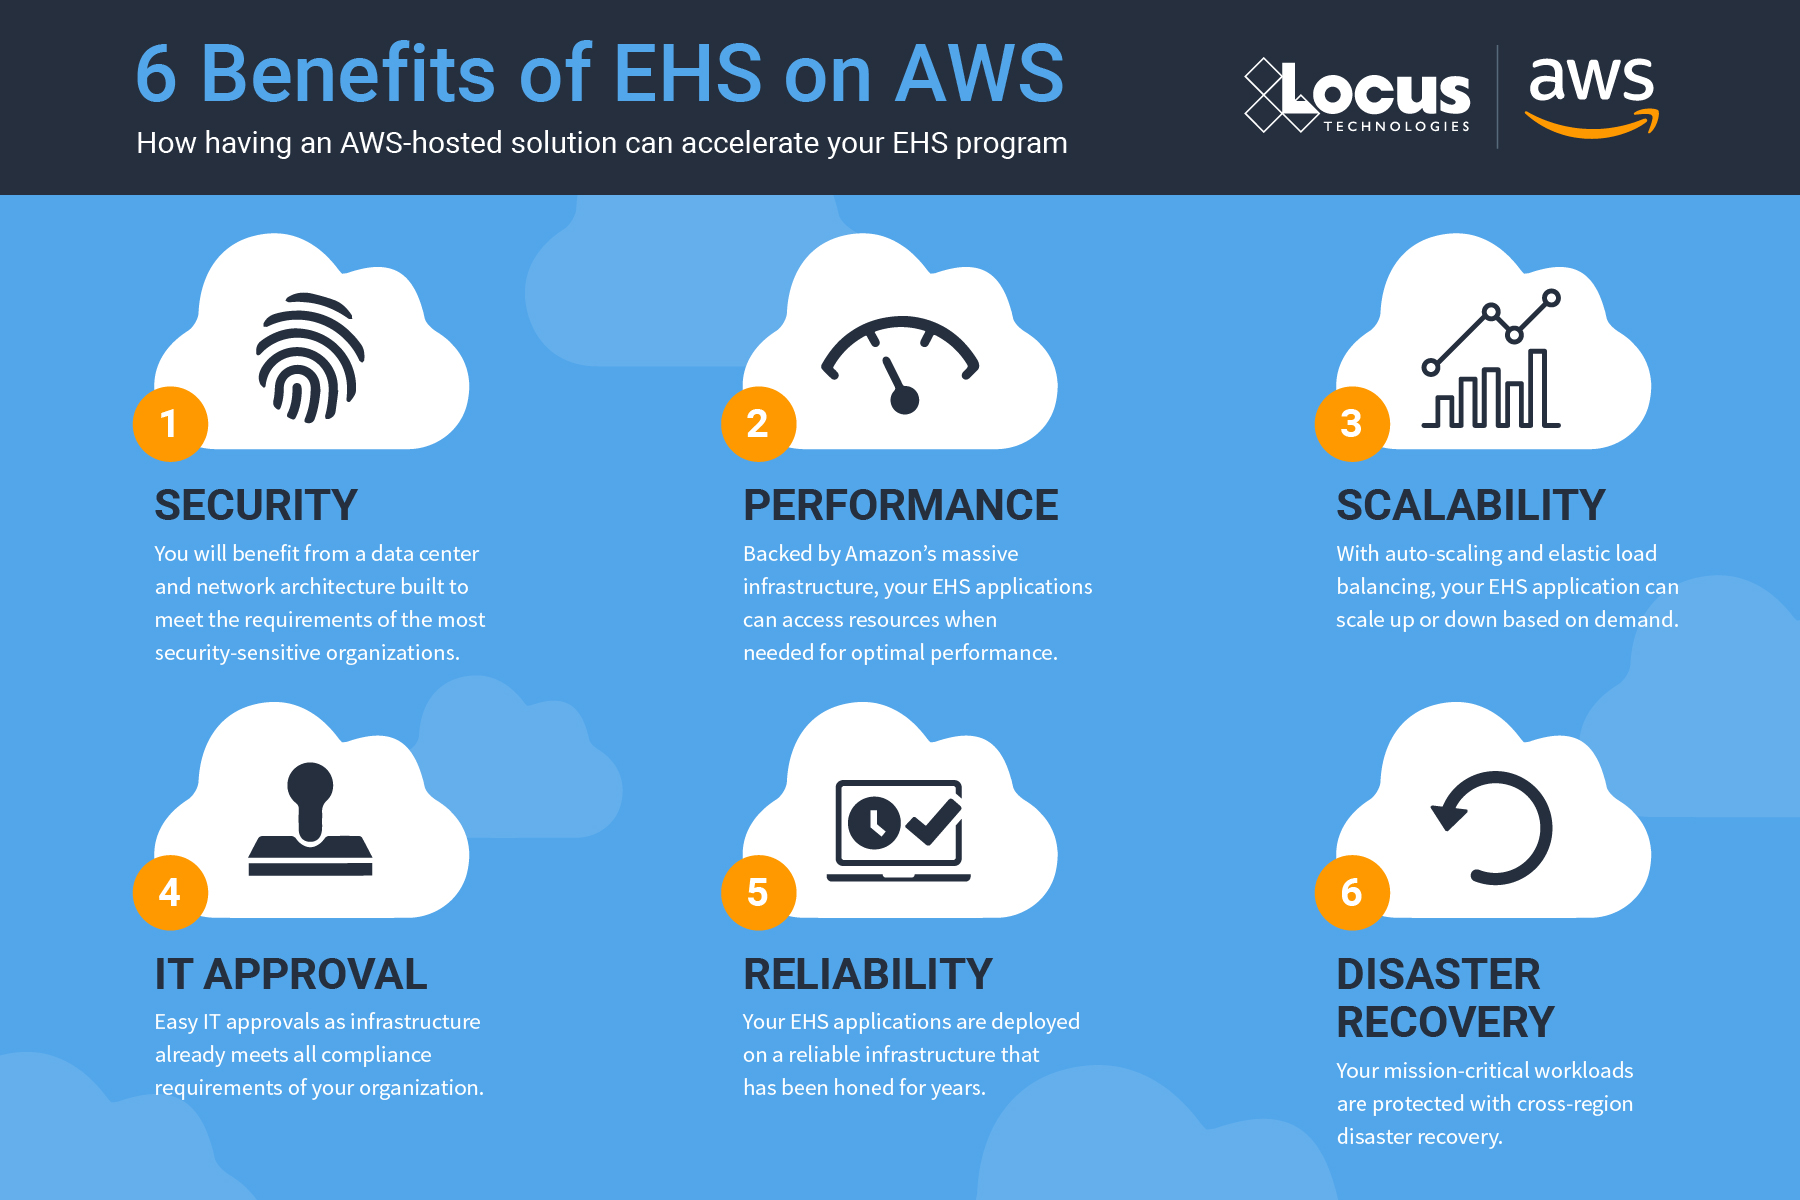
In August, Locus migrated EIM into the Amazon Web Services (AWS) cloud. EIM already had superior security, reliability, and performance in the Locus Cloud. The move to AWS improves on those metrics and allows Locus to leverage AWS specific tools that handle big data, blockchain, machine learning, and data analytics. Furthermore, AWS is scalable, which means EIM can better handle demand during peak usage periods. The move to AWS helps ensure that EIM remains the world’s leading water quality management software.
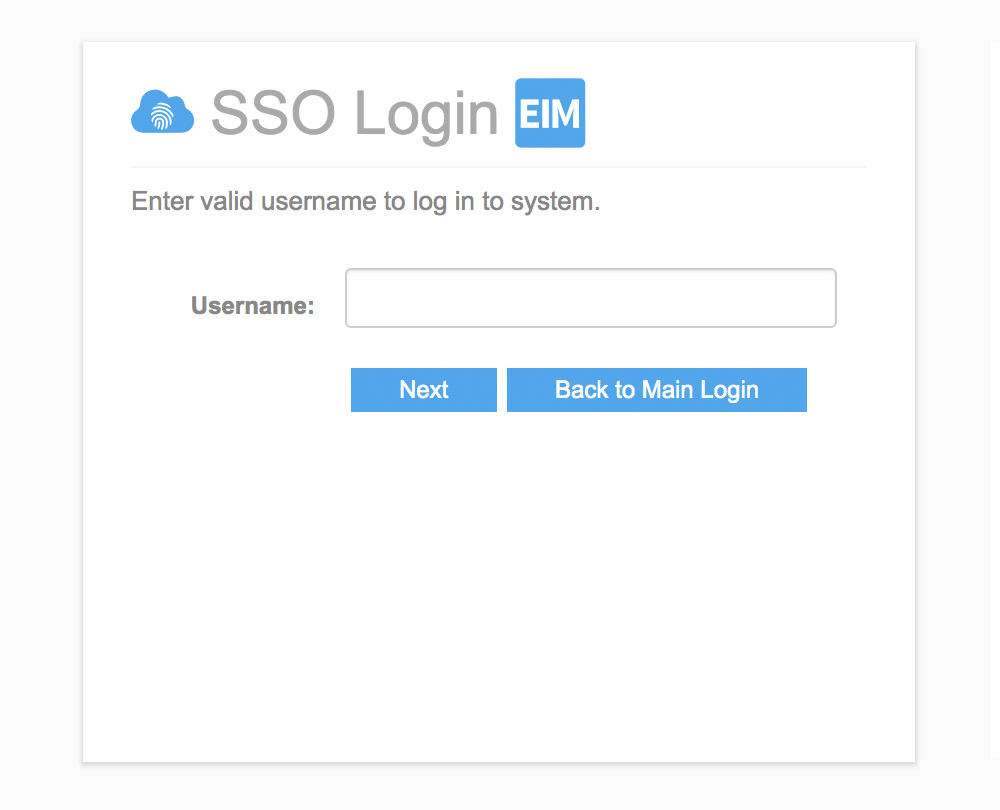
EIM now supports Single Sign-On (SSO), allowing users to access EIM using their corporate authentication provider. SSO is a popular security mechanism for many corporations. With SSO, one single login allows access to multiple applications, which simplifies username and password management and reduces the number of potential targets for malicious hacking of user credentials. Using SSO with EIM requires a one-time configuration to allow EIM to communicate with a customer’s SSO provider.
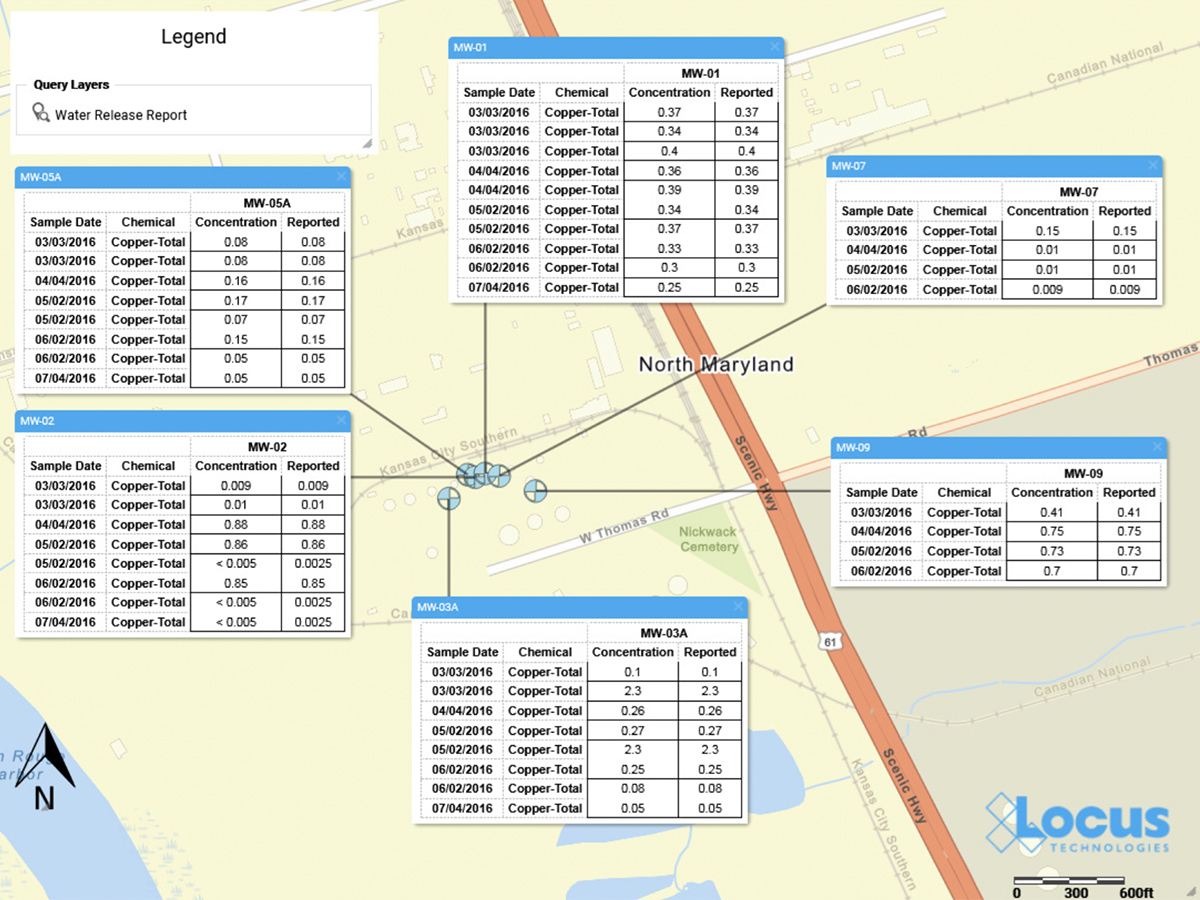
The Locus GIS+ solution now supports creating data callouts, which are location-specific crosstab reports listing analytical, groundwater, or field readings. A user first creates a data callout template using a drag-and-drop interface in the EIM enhanced formatted reports module. The template can include rules to control data formatting (for example, action limit exceedances can be shown in red text). When the user runs the template for a specific set of locations, EIM displays the callouts in the GIS+ as a set of draggable boxes. The user can finalize the callouts in the GIS+ print view and then send the resulting map to a printer or export the map to a PDF file.
For customers who don’t require the full EIM package, Locus now offers EIM One, which gives the ability to customize EIM functionality. Every EIM One purchase comes with EIM core features: locations and samples; analytical and field results; EDD loading; basic data views; and action limit exceedance reports. The customer can then purchase add-on packages to get just the functionality desired–for example a customer with DMR requirements may purchase the Subsurface and Regulatory Reporting packages. EIM One provides customers with a range of pricing options to get the perfect fit for their data management needs.
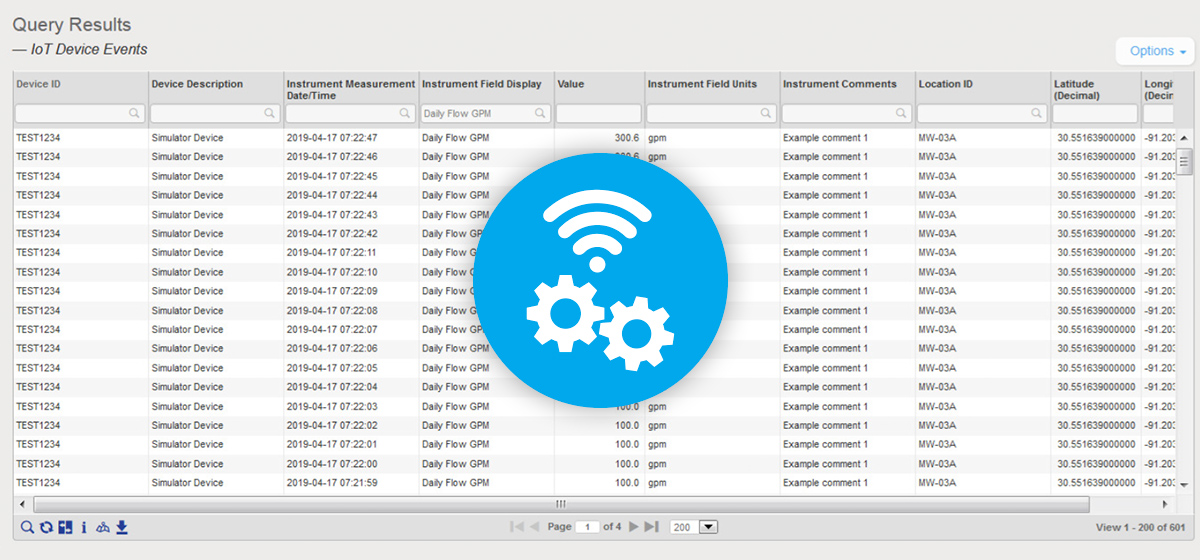
EIM can now be configured to accept data from IoT (internet of things) streaming devices. Locus must do a one-time connection between EIM and the customer’s IoT streaming application; the customer can then use EIM to define the devices and data fields to capture. EIM can accept data from multiple devices every second. Once the data values are in EIM, they can be exported using the Expert Query tool. From there, values can be shown on the GIS+ map if desired. The GIS+ Time Slider automation feature has also been updated to handle IoT data by allowing the time slider to use hours, minutes, and seconds as the time intervals.
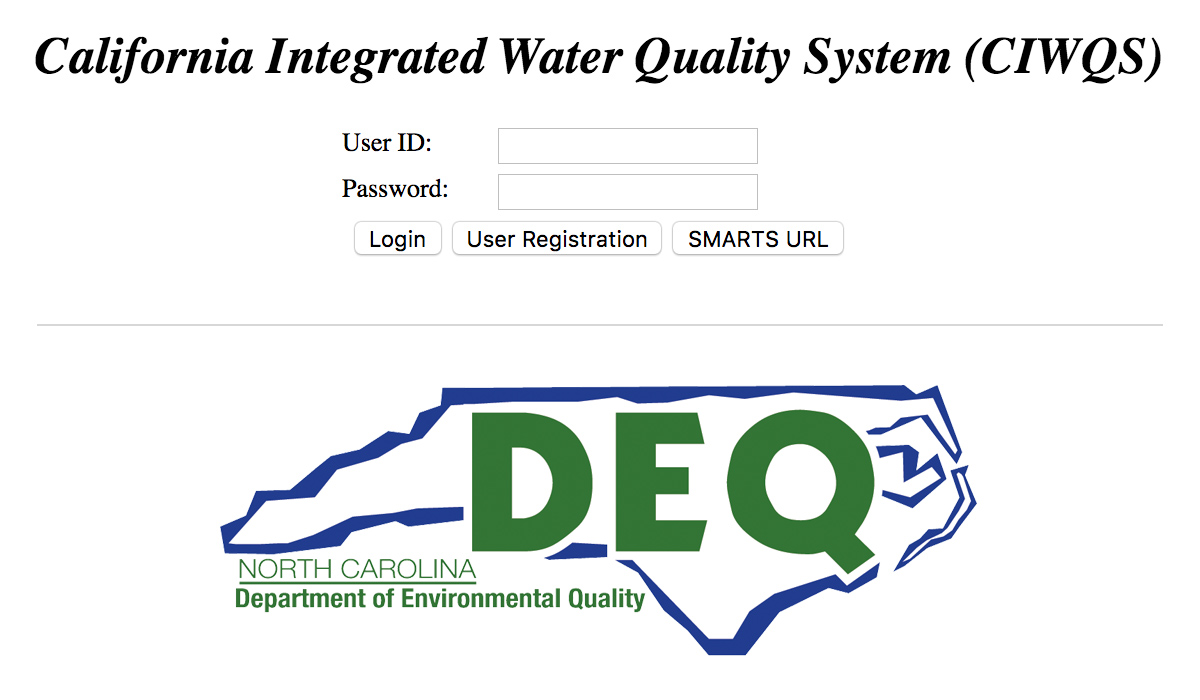
EIM currently supports several dozen regulatory agency export formats. In 2019, Locus added two more exports for CIWQS (California Integrated Water Quality System Project) and the NCDEQ (North Carolina Department of Environmental Quality). Locus continues to add more formats so customers can meet their reporting requirements.
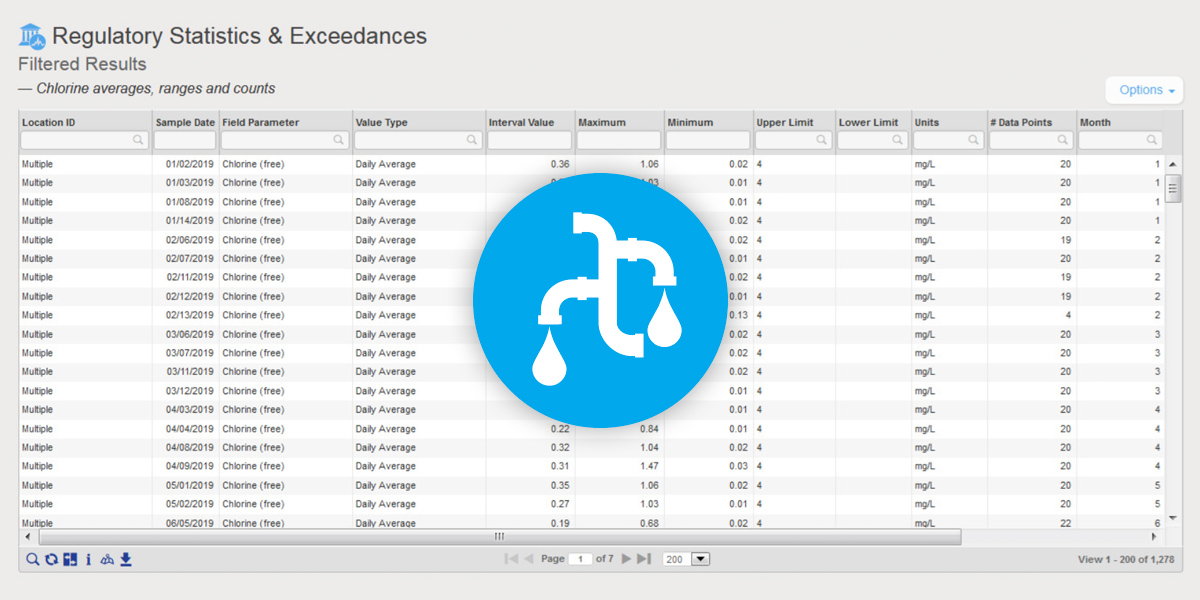
EIM is the world’s leading water quality management software, and has been used since 1999 by many Fortune 500 companies, water utilities, and the US Government. Locus added two key reports to EIM for Water in 2019 to further support water quality reporting. The first new report returns chlorine averages, ranges, and counts. The second new report supports the US EPA’s Lead and Copper rule and includes a charting option. Locus will continue to enhance EIM for Water by releasing the 2019 updates for the Consumer Confidence Report in January 2020.
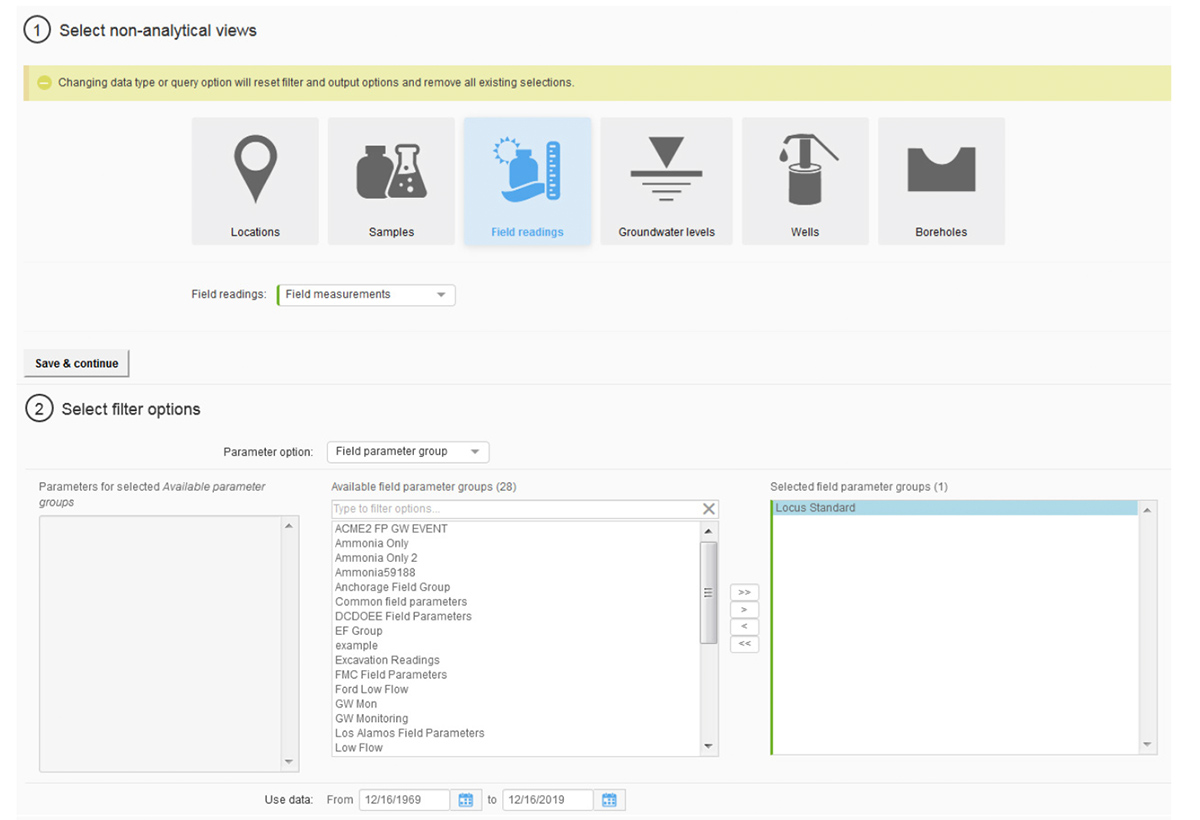
Locus continues to upgrade and improve the EIM user interface and user experience. The most noticeable change in 2019 was the overhaul of the Non-analytical Views pages in EIM, which support data exports for locations, samples, field readings, groundwater levels, and subsurface information. Roughly 25 separate pages were combined into one page that supports all these data views. Users are directed through a series of filter selections that culminate in a grid of results. The new page improves usability and provides one centralized place for these data reports. Locus plans to upgrade the Analytical Views in the same way in 2020.
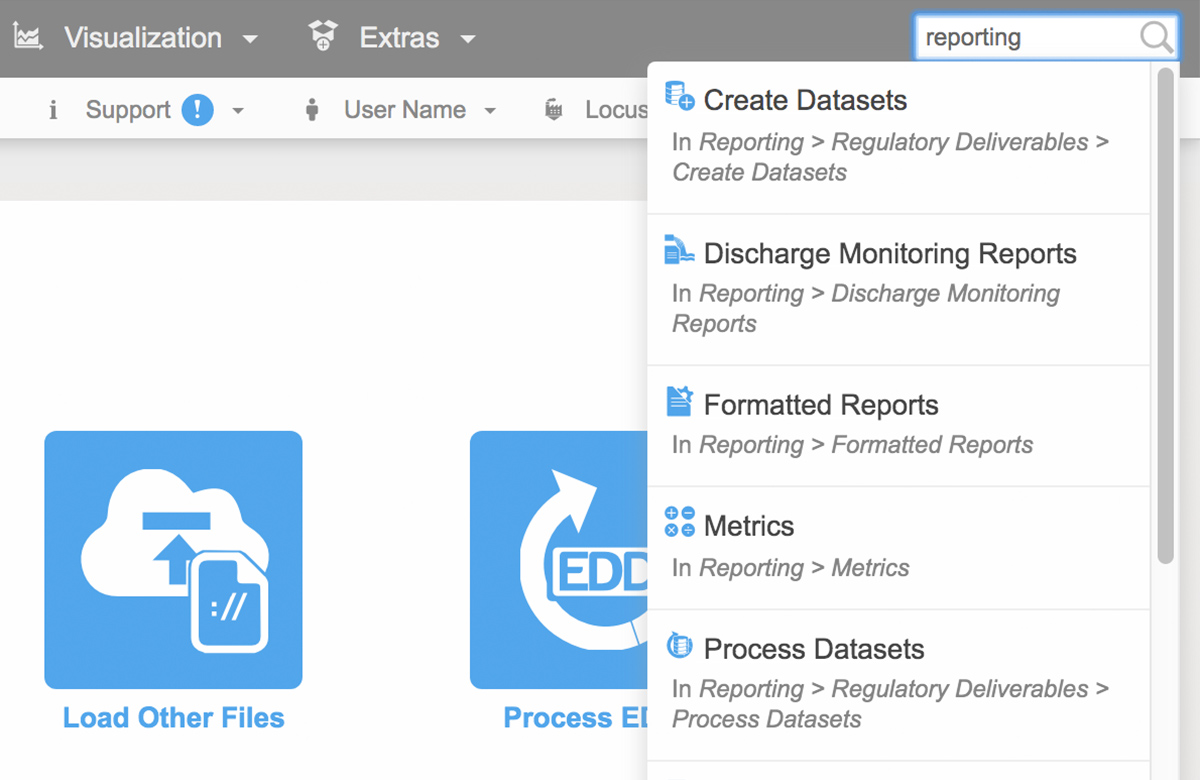
To help customers find the correct EIM menu function, Locus added a search box at the top right of EIM. The search box returns any menu items that match the user’s entered search term. In 2020, Locus will expand this search box to return matching help file documents and EDD error help, as well as searches for synonyms of menu items.
The EIM EDD loader now has a new “View history” option for viewing previously loaded data for the locations and parameters in the EDD. This function lets users put data in the EDD holding table into proper historical context. Users can check for any unexpected increases in parameter concentrations as well as new maximum values for a given location and parameter.
The Environmental Protection Agency (EPA) announced that it would impose stricter requirements on water utilities to manage lead and copper contamination in drinking water supplies. The EPA said that tackling water pollution is a core duty of the agency.
The proposed changes, the first affecting lead level in water since 1991, would also give utilities more time to replace lead pipes in their systems. Some environmental groups are not happy with the proposed rule because the change slows by 20 years the timeline for removing aging lead service pipes that could expose children to lead. Lead is a toxin known to harm developing brains. The rule slows down the removal of pipelines where lead levels exceed 15 μg/L to 33 years from the 13 years in the original law.
The new rule requires water utilities to identify and remove sources of lead when a water sample at faucet exceeds 15 micrograms per liter (μg/L). The EPA said water systems would also have to follow new, improved sampling procedures and adjust sampling sites to better target locations with higher lead levels.
Health advocates estimate that as many as six million or more lead water lines remain underground in U.S. cities and towns. Additional sampling and monitoring can help to identify affected areas, and ensure the quality of drinking water sources.
In the next few years, an opportunity exists to make significant advances in how we monitor and manage environmental emissions to the air, soil, and water, potentially resulting in significant disruptions in current approaches. Currently, industries and commercial establishments monitor their emissions and submit reports on a regular basis, often as frequently as quarterly, to federal and state agencies to demonstrate they are meeting regulatory requirements. However, no one on the generating or receiving end of these data dumps and reports is aggregating these emissions to create a more composite, inclusive picture of emissions across sources or media. The reason is that emissions of different types and to different media are reported to separate regulatory entities that, in general, do not interact or talk to one another. And although there are significant potential benefits to both generators and regulators in reviewing integrated environmental data sets, our traditional methods of storing and sharing this information make such integrations a hugely difficult effort.
Only by integrating all available data can we begin to (1) assess local, regional, and ultimately the global impacts of these emissions, and (2) identify net improvements to our environmental practices that are only apparent when looking at the combined, interconnected body of collected data. Blockchain enables the integration of these data sets for quick, yet comprehensive “big picture” assessments.
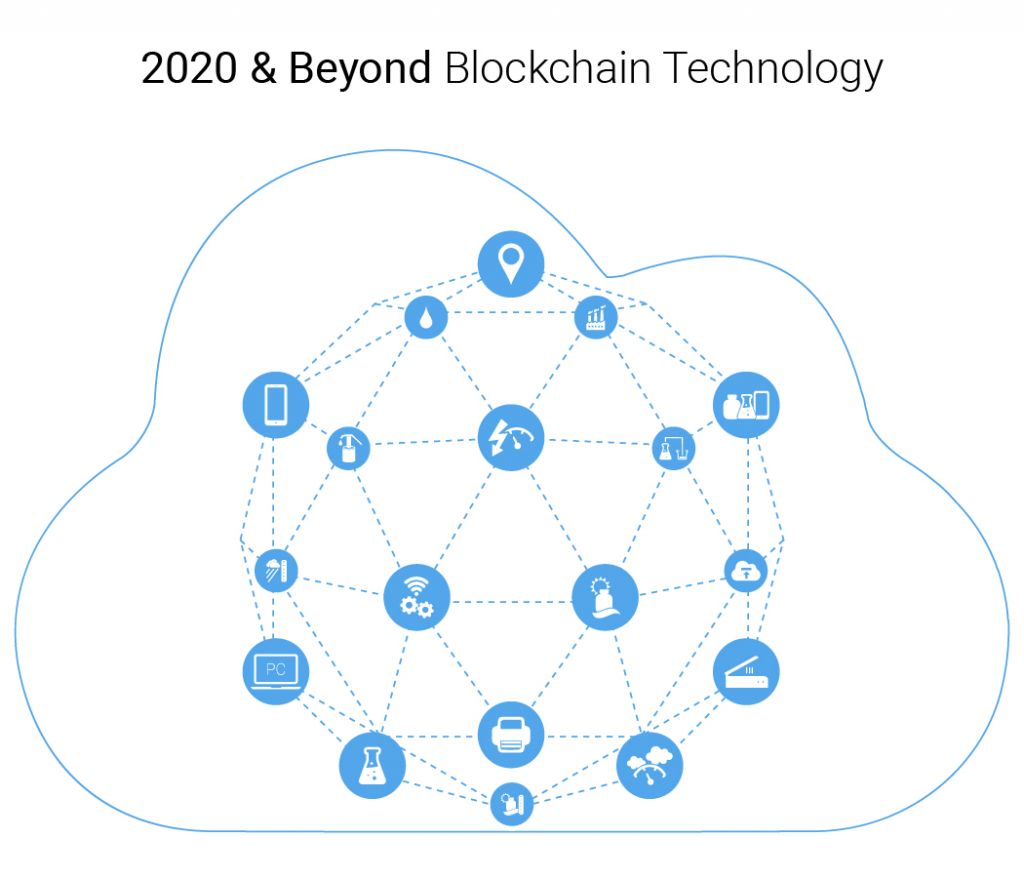
Blockchain technology is a highly disruptive technology that offers an efficient way of storing records (called blocks) which are linked using cryptography. While still in its infancy, blockchain promises to change the world as we know it, much like the internet did after its introduction in 1991. Today, the technology is most widely associated with digital currencies and money transfers. In time, however, blockchain technology will not only shift the way we use the internet, but it will also revolutionize the global economy and almost all transactional business that relies on an intermediary.
One Environment, Health, and Safety and Sustainability (EHS+S) sector well positioned to benefit from blockchain technology is emissions monitoring and reporting. I reported more on the technology and its impact on EHS space here.
Presently, companies with emissions monitor these following regulatory requirements, input the resulting data into a database or spreadsheet, perform emissions calculations on the entered readings, and then report the results of these calculations to regulators. The entire focus of this process is to (1) determine whether emissions of a single chemical or chemicals exceed prescribed levels and (2) evaluate the effect of these discharges on the media to which the compounds have been introduced by the polluting industry or other sources. There is no suitable software technology or mechanism to look at aggregate emissions across geographical areas or sectors or how emissions of one type interact with emissions of an entirely different kind. Examining such interactions could be far more critical than monitoring and assessing the impacts on human health and the environment of single parameter emissions to only one media, and may reveal new opportunities for optimizing our EHS+S practices for reduced cost with similar or improved performance.
To take a hypothetical scenario, consider the possible consequential damages when two incompatible streams of chemicals or waste mix to create even worse chemicals as a result of their chemical reaction. EPA has only recently started looking into these type of scenarios. Its Envirofacts databases allow the public to retrieve information from multiple sources of Envirofacts’ System Data relevant to your area of interest. However, each database is a separate silo of information (Figure 1). The next step that ought to be taken is to assess and as needed, report on the possible interaction of incompatible emission sources that are nearby, but are independently monitored and stored in disconnected databases (see Figure 2 below).
Figure 1: EPA Envirofacts databases allow the public to retrieve information from multiple sources, but only one source at time and disconnected from each other.
Most everyone taking prescription medicines comes to understand that interactions between drugs are quite common. Imagine something similar to the interaction of drugs in your body happening on a much larger scale in the environment. One does not have to imagine. EPA recently imposed the highest environmental fine ever at the 2,530-acre Eastern Michaud Flats Contamination Superfund site near Pocatello, Idaho. Two adjacent on-site phosphate ore processing facilities, the FMC Corporation and the J.R. Simplot Company, began operations at the site in the 1940s. The J.R. Simplot facility produces solid and liquid fertilizers using phosphate ore, sulfur, air and natural gas. The FMC plant is North America’s largest producer of elemental phosphorus which is used in a variety of products from cleaning compounds to foods.
Operations at these plants have independently contaminated both the groundwater and soil with hazardous chemicals. Both plants have received numerous environmental violations, many of which were settled with the EPA. Each of the sites has its environmental ills (and fines), but the more significant environmental problem is a combined regional plume. Everyone knows that acids and metals do not play well together. Sulphuric acid from the J.R. Simplot operation has leaked from surface impoundments into the groundwater and, on its way downstream, has leached all kinds of toxic metals from the FMC site, creating a highly poisonous plume of contaminants. An accurate assessment of the environmental disaster that exists in this area requires that the environmental impact of the two plants be examined in toto. Blockchain-based monitoring technology would allow both the public and regulators to see the resultant subsurface commingled plume and possibly pave the way to a more comprehensive remedy.
Issues involving contamination of multiple media have also arisen at sites where discharges of volatile organic compounds or VOCs have occurred. In Silicon Valley, where I live, many engineering consultants have made their living chasing plumes of VOC chemicals (e.g., TCE) and then, when deemed appropriate, have installed various groundwater treatment plants tucked in the back of parking lots of companies like Google or HP to ameliorate this contamination. Santa Clara, the central county in Silicon Valley, is home to more Superfund sites than any other county in the United States.
The process is analogous to rinsing detergent from a sponge. After many rinses, it still seems to have more in it. It is an endless process with little environmental benefit. Has anyone looked at the additional impact of the high energy demand for treatment systems that have minimal effect on improving groundwater, but can contribute significant CO2 equivalents to the atmosphere?
With blockchain technology, we could simultaneously measure the positive effect of the treatment plant removing contaminants from water and the negative impact that this same plant produces by contributing to the CO2 emissions. Quantities of removed chemicals over time could be plotted in real time vs. CO2 emissions produced resulting from high energy usage of the treatment plant. This would allow companies operating treatment plants and regulators overseeing them to determine at what point in time continued treatment could be harming, not helping the environment. It is these type of analyses that would benefit society and help with the decision to shut down a remediation process when diminishing returns of the treatment system are reached.
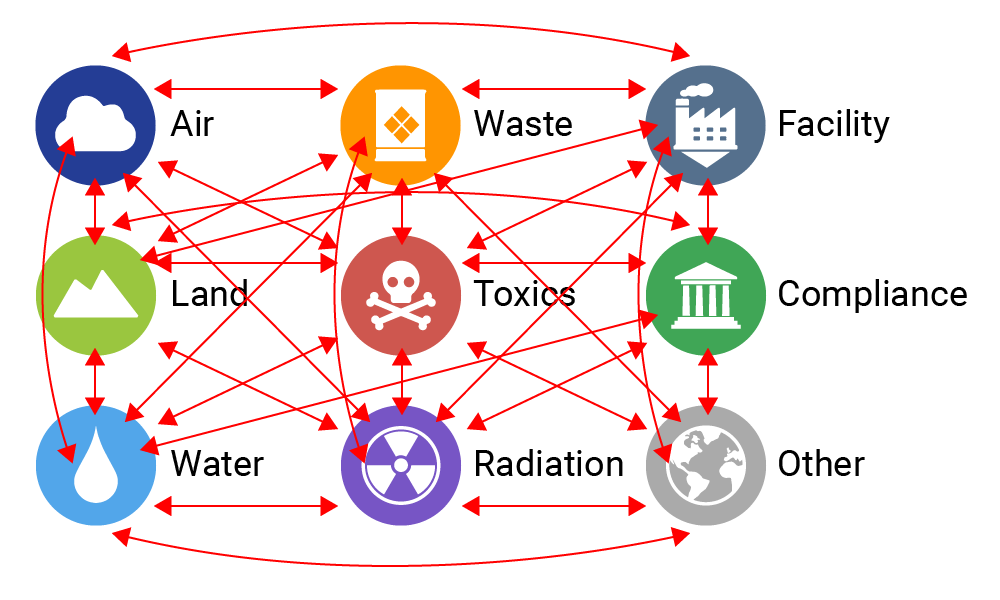
Figure 2: Interaction of incompatible emission sources is better managed if emissions are aggregated than if independently monitored and stored in disconnected databases.
How would blockchain technology help in a scenario like this? Chemical removal rate would be tracked in one block (of the chain) and CO2 emissions in another. Owner and regulator would agree on the formula to determine when the treatment process ceases to produce a significant environmental benefit. At this point, the system would be shut down. All of this would be monitored and measured in real time, and more importantly, it would be transparent to the owner, regulator, and the public.
When you think about emissions, they are generally (except incidents and accidents) operating problems that can be managed and optimized before discharges even happen. It is to the benefit of companies to do it this way. Every process that has an exhaust or smokestack for dispersing air emissions or pipelines for discharging liquids to surface receptors or water bodies could be managed to reduce harmful emissions coming out the system regardless of regulatory prescribed permissible levels. As an organization with a legacy environmental site knows, it is far more cost-effective to eliminate the original cause of emission than to spend decades of effort to remediate after the fact.
Unfortunately, many businesses are currently not genuinely looking at the aggregated data they collect about their emissions, wastewater, and energy use alongside their operational metrics. Current practices for EHS+S data management only allow for very simplistic comparison of normalized indicators between these disparate data sets. But it would benefit these operators to gather, aggregate and analyze data, and then make better, more cost-effective decisions as part of their risk-management protocols, while still maintaining their environmental compliance requirements. Blockchain technology allows for review of more detailed data when making decisions with aggregated data sources so that managers can look beyond the simple normalized performance indicators. For example, many organizations only review their environmental and sustainability performance on an annual basis, mainly because the current tools to aggregate this data require them to be evaluated on a consistent time frame, and there is a significant investment in bringing all of the relevant data together. But through blockchain technology, the data maintain their connection at every level. This allows for trend evaluation at other time frames not currently being examined. So if some short-term operational practice causes a spike in emissions, that issue can be identified and resolved immediately, rather than waiting for the end of the year, when the emissions have already happened, and the effect may not even be apparent when averaged out on an annual time frame. Then, even looking beyond the facility or organization, blockchain also allows for data aggregation across industry, region, and country, so that we will be in a better position to forecast the future and assess the viability of different measures to ameliorate the problems confronting us.
There is a growing need for companies to bring together information from their vast disconnected databases, single tenant clouds, and spreadsheets, and then mine the data they collect from these sources. In a decade or so, planet Earth may be a meshed grid of static sensors coupled with movable ones installed on people, animals (yes animals roaming in the wild), transportation devices, and other moving objects to collect data in real time. The conversation about the environmental landscape has evolved drastically over the last 50 years as we continue to understand the extent to which human activity has affected the planet. Companies and society need a collective and holistic understanding of the problems we face.
The only way to understand the full picture, and in turn to act meaningfully on a global level, is for all individuals and companies to understand the impact of their activities. It’s impossible to mitigate the net risks and effects of these activities on the planet when we have not fully assembled the data to characterize the problem and understand the full picture. Blockchain technology offers the best path forward, making it possible for environmental data be integrated at multiple levels. Any coordinated effort of this magnitude will be years in the making, but every journey starts with a first step. There are two impediments to institute a change like this: technology (until recently, blockchain did not exist) and a government with the initiative to require such technology. Just as was the case with the internet revolution of the nineties, the rate of progress in technology is surpassing politicians’ ability to come to grips with its impact on society.
So far, there have been no imposed data exchange standards; a prerequisite for a broad data exchange, land for implementation of blockchain technology. But in the meantime, progressive organizations will want to start taking advantage of this technology to look at their operations and make more informed EHS+S decisions.
Perhaps blockchain technology is not ready for prime time. Some may argue that it creates a secondary problem of additional energy consumption much like water treatment systems described earlier. This is a theme that is advocated by some media outlets and blockchain skeptics who argue that the computer algorithms require significant amounts of electricity to power the servers on which they run. Estimates of blockchain’s soaring energy use are likely overstating the electric power used as the current debate on power consumption is not backed by hard data. When it comes to technology, history has consistently shown that the cost will always decrease, and the impact will still increase over time. It is inevitable that blockchain technology will become more accessible with reduced infrastructure over the next few years.
Blockchain could completely change how companies run their businesses and present new opportunities far beyond sustainability and environmental emissions management.
We are living in a world where companies and governmental agencies are not able to comprehensively analyze EHS+S information efficiently. Using blockchain technology will allow organizations to track, store, rollup, gain insights into, and also share their data with other interested parties as needed. It has the potential to put accurate and verifiable information into the hands of companies and regulating agencies more quickly. To make better progress on how we use EHS+S information, regulators will need to find ways that reward positive and proactive behaviors. We are not going to solve these issues by fining emitters until they behave. Blockchain technology can help us move us away from the punitive approach and toward a more collaborative one by assisting companies to reduce their emissions while lowering their operating costs at the same time. Social sharing elements may also play a role here, giving companies that benefit from the fruits of blockchain technology a valuable marketing and PR advantage over those who do not adopt this technology, and as such, lag behind in their progress on environmental issues.
EPA is establishing a national system for tracking hazardous waste shipments electronically. This system, known as “e-Manifest,” will modernize the nation’s cradle-to-grave hazardous waste tracking process. EPA is on schedule to launch e-Manifest on June 30, 2018.
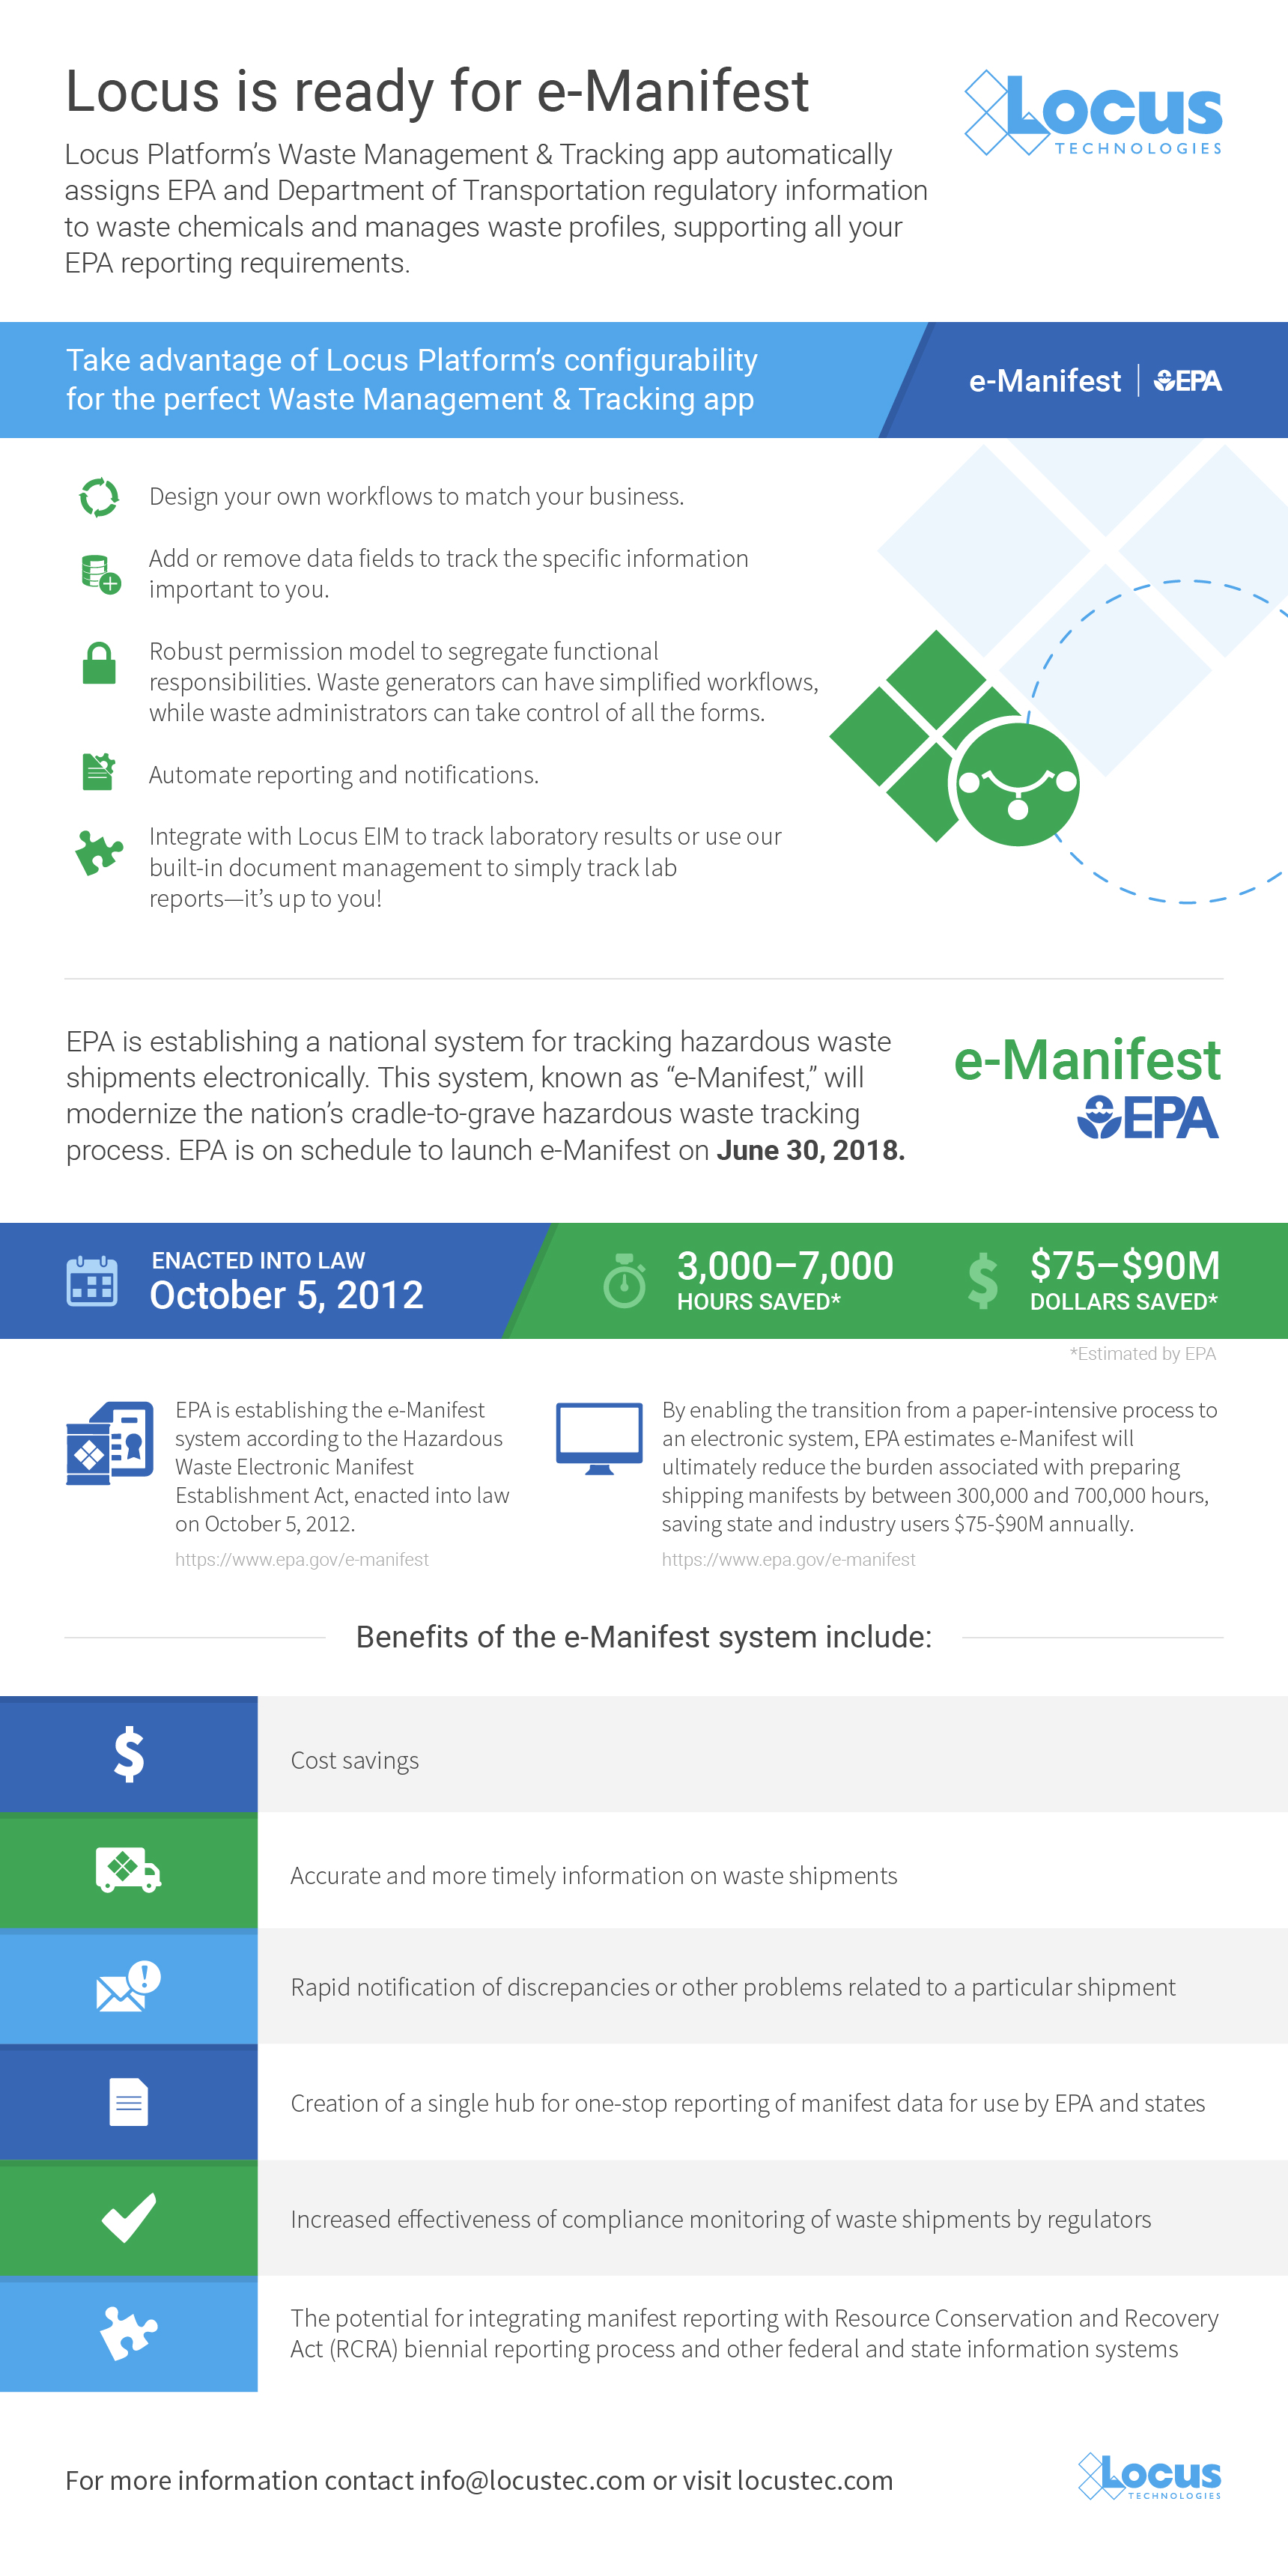
Learn more about Locus’ Waste Management application.
US EPA fenceline monitoring data collection officially begins on January 30, 2018. We have put together an infographic to show you some of the ways Locus EIM can help you streamline, consolidate, and take control of all your important environmental information using maps, data reports, formatted outputs, charts, and more!
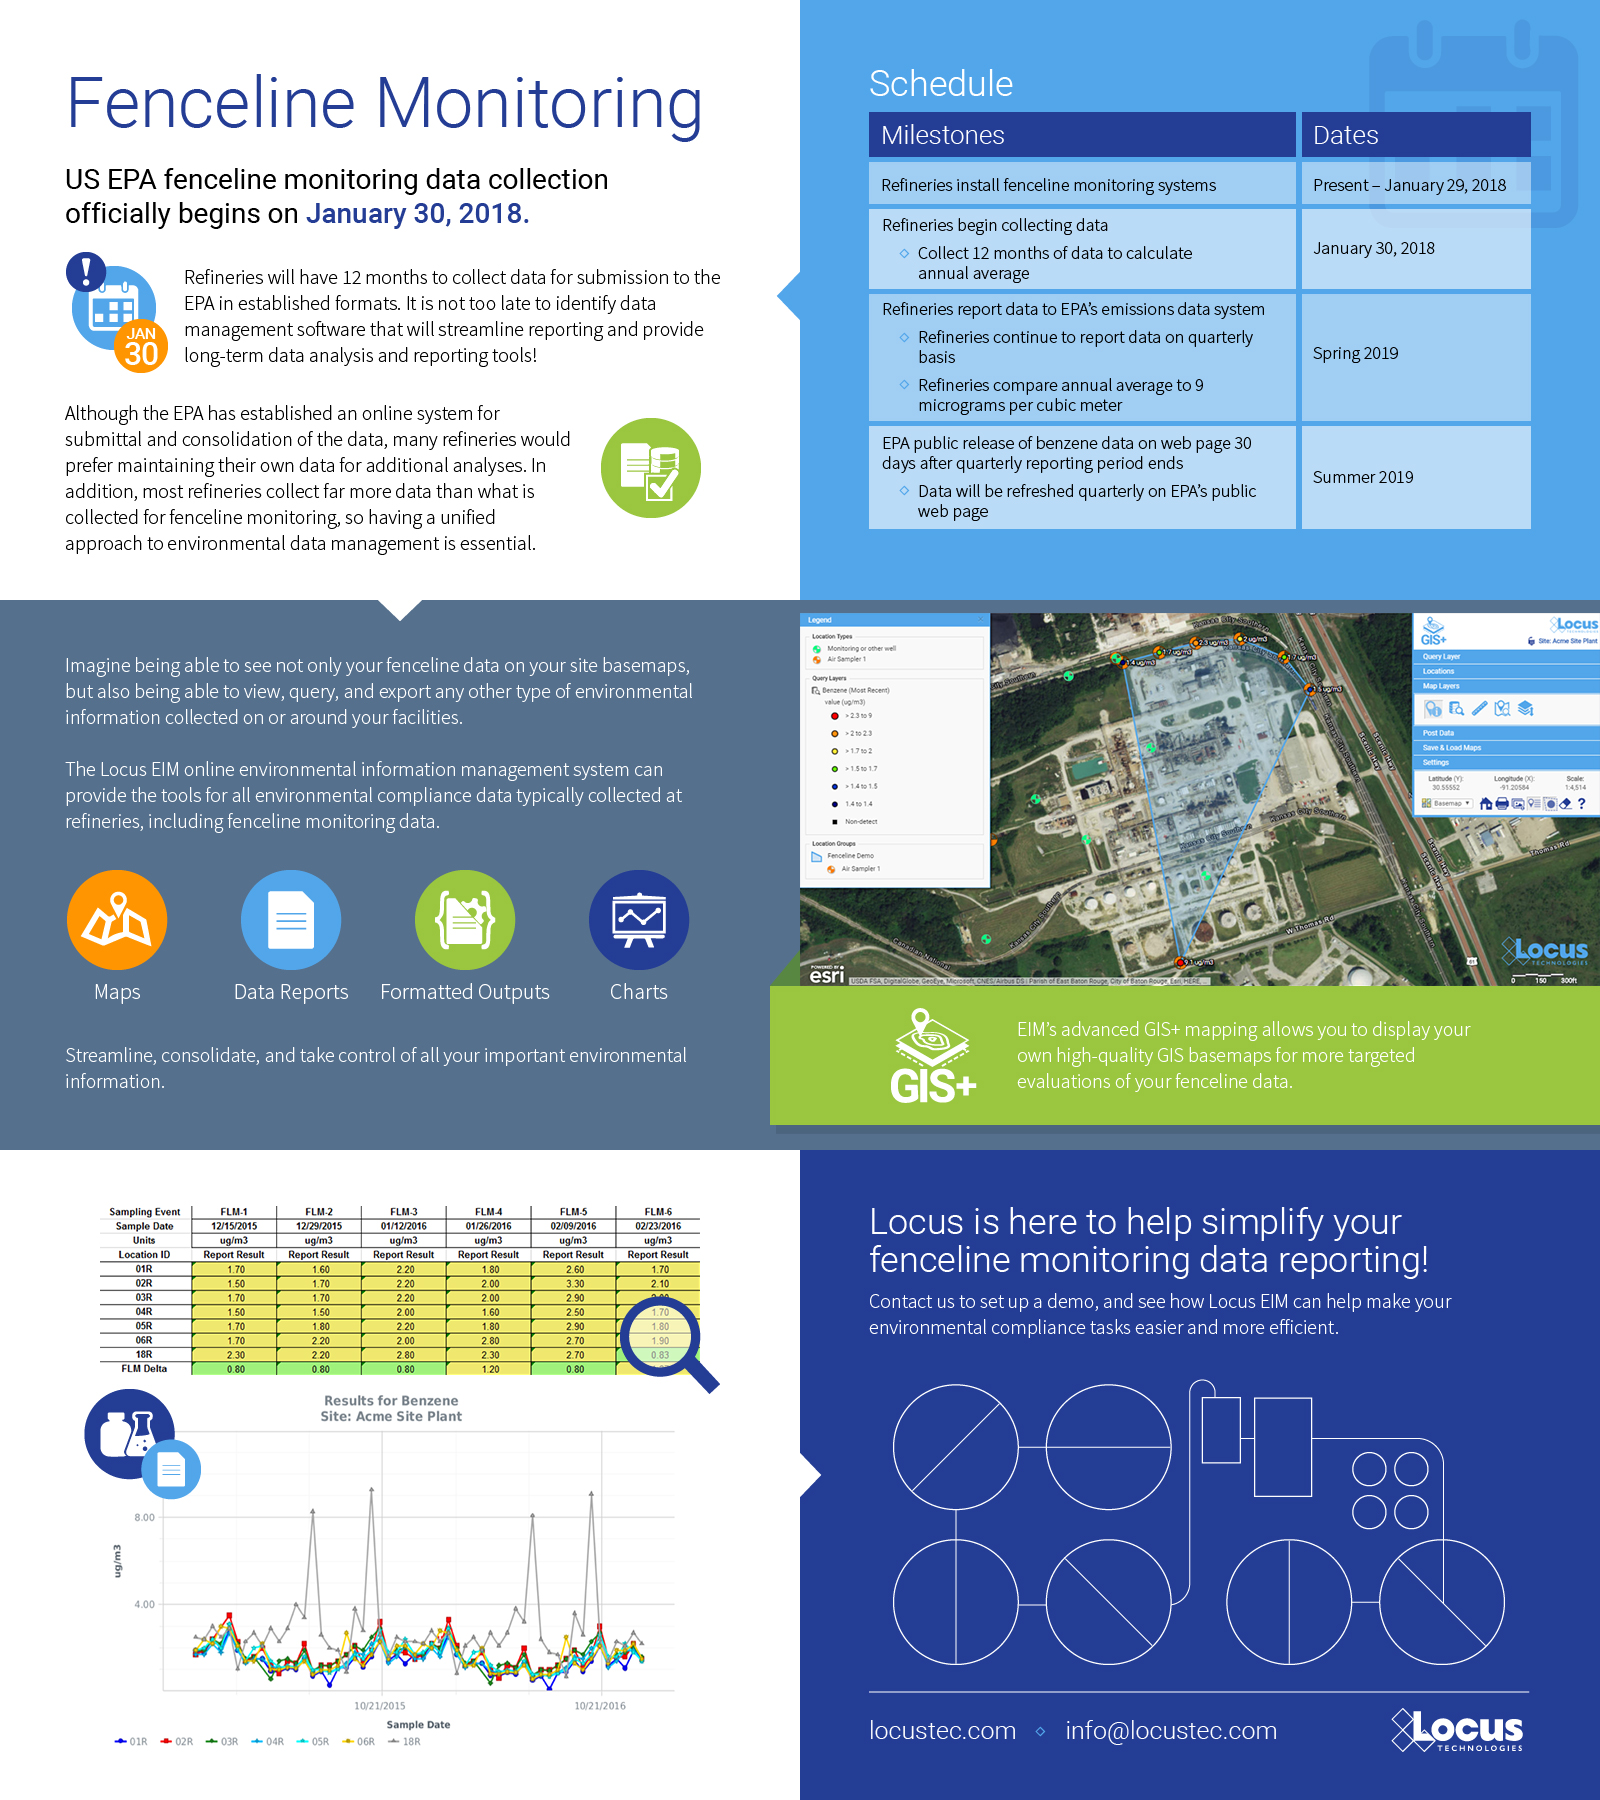
Click image for larger version
Locus’s global team delivers software, training, and ESRS data standardization support for enterprises affected by the EU’s Corporate Sustainability Reporting Directive.
MOUNTAIN VIEW, Calif., January 21, 2025 —Locus Technologies, the sustainability and Environmental Health and Safety (EHS) compliance software leader, today announced it has doubled its European headcount in response to growing demand for Corporate Sustainability Reporting Directive (CSRD) compliance solutions among large companies based in Europe and abroad. New and dedicated resources in Europe will help international clients assess their obligations under CSRD, effectively collect and process material data spanning worldwide locations, and adhere to the rigorous European Sustainability Reporting Standards (ESRS) that are central to CSRD. Locus Technologies’ is headquartered in Silicon Valley, CA, with satellite locations in the Czech Republic and Croatia.
“Managing CSRD compliance outside of Europe is virtually impossible,” said Neno Duplan, CEO and Founder of Locus Technologies. “That’s why Locus has established a dedicated team in the heart of the EU to assist our U.S. and international customers in tackling this transformative and far-reaching regulation.”
Locus’s CSRD Practice Group helps multi-national clients evaluate the applicability of the regulation to their businesses; streamline the collection of the most difficult types of data, including emissions, waste, water, and social equity metrics; configure Locus CSRD & ESG software to support the organization’s material data; and train the organization’s stakeholders to administer their CSRD compliance obligations going forward.
With over 30 years of expertise in collecting, managing, and organizing massive and complex datasets for some of the world’s largest organizations, Locus is uniquely equipped to help businesses meet these new EU requirements.
“The CSRD mandates an extraordinarily wide range of information, much of which is traditionally siloed within organizations and across their regional outposts,” said Dr. Zvonimir Dadić, head of the CSRD Practice Group for Locus Technologies Europe. “While certain data, such as financial metrics, may already adhere to strict standards, other required information can be elusive, complex, and difficult to interpret. Our cross-border team understands the intricacies of environmental, social, and governance data, and can properly map those datasets to meet CSRD requirements.”
Locus’s CSRD Practice Group provides complimentary CSRD-readiness resources to help organizations prepare for the hurdles of data collection, double materiality, and reporting. To discuss CSRD solutions configured to your organization, or to speak with our EU-based or US-based teams, please contact us.
About Locus Technologies
Locus Technologies, the global environmental, social, governance (ESG), sustainability, and EHS compliance software leader, empowers companies of every size and industry to be credible with ESG reporting. From 1997, Locus pioneered enterprise software-as-a-service (SaaS) for EHS compliance, water management, and ESG credible reporting. Locus apps and software solutions improve business performance by strengthening risk management and EHS for organizations across industries and government agencies. Organizations ranging from medium-sized businesses to Fortune 500 enterprises, such as Sempra, Corteva, Chevron, DuPont, Chemours, San Jose Water Company, The Port Authority of New York and New Jersey, Port of Seattle, and Los Alamos National Laboratory, have selected Locus. Locus is headquartered in Mountain View, California. For further information regarding Locus and its commitment to excellence in SaaS solutions, please visit www.locustec.com or email info@locustec.com.
Locus’s cloud-based software helps organizations comply with stricter requirements
MOUNTAIN VIEW, Calif., October 29, 2024 —Locus Technologies, the sustainability and Environmental Health and Safety (EHS) compliance software leader, today announced the release of Locus Refrigerant Management software, the cloud-based, mobile-friendly product that generates exceedance alerts, facilitates leak detection, and automates response protocols in addition to providing comprehensive tracking of fluorinated greenhouse gases (F-gases), chlorofluorocarbons (CFCs), hydrochlorofluorocarbons (HCFCs), and substitutes like hydrofluorocarbons (HFCs). The software empowers companies to manage complex refrigerant phasedowns with accuracy and confidence, ultimately avoiding excessive emissions. The software also positions Locus clients to comply with tougher US federal regulations taking effect 14 months from now and to easily adapt as US and EU rules evolve in the future.
On September 20, 2024, EPA Administrator, Michael S. Regan, signed the final rule Phasedown of Hydrofluorocarbons: Management of Certain Hydrofluorocarbons and Substitutes under of the American Innovation and Manufacturing (AIM) Act which indicates tougher requirements will be phased in starting January 1, 2026. Refrigerants are the most potent of greenhouse gases, with some varieties having a global warming potential hundreds and even thousands of times greater than CO2. Even small leaks pack a big punch on the environment, which is why stricter regulations are emerging.
“These next 12 months will be critical for companies to articulate their refrigerant management plans, train their technicians, and adopt technology that will help them avoid costly errors and get this right,” said Mark Harbin, veteran refrigerant compliance expert and Locus product designer. “Locus is pleased to bring to market refrigerant management software as well as refrigerant management training and certification to help each client manage the phase down and transition successfully.”
Immediate regulatory priorities include detecting leaks and resolving them within mandated timeframes; comprehensive record keeping of equipment, inspections, refrigerant inventories, and rates of use; and meticulously disposing and reclaiming used refrigerants. Locus Refrigerant Management software simplifies these challenges. Locus manages everything from service records to cylinder barcodes and automatically alerts users when any dates or datapoints are out of compliance. Immediate notifications and dynamic dashboards deliver real-time insights, and the software’s fully configurable components flex to future demands.
“Refrigeration and air conditioning cause up to 10 percent of global carbon emissions, and the leaks alone produce more carbon than all the air travel worldwide, which is why waiting on periodic reports pulled from static refrigerant databases just won’t cut it,” said Wes Hawthorne, President of Locus Technologies. “Locus software enables clients to act quickly; the software immediately alerts users of potential problems with their equipment so that issues can be resolved before becoming disastrous.”
Locus Refrigerant Management is one of several integrated applications available in Locus software. Other Locus offerings include EHS risk and compliance, sustainable construction, waste management, water quality, incident management, ESG reporting, and robust environmental data management software. This collection of specialized and unified SaaS applications enables clients to manage every facet of refrigerant management and environmental data in one place. To learn more about Locus Refrigerant Management or the full suite of applications, please visit www.locustec.com.
About Locus Technologies
Locus Technologies, the global environmental, social, governance (ESG), sustainability, and EHS compliance software leader, empowers companies of every size and industry to be credible with ESG reporting. From 1997, Locus pioneered enterprise software-as-a-service (SaaS) for EHS compliance, water management, and ESG credible reporting. Locus apps and software solutions improve business performance by strengthening risk management and EHS for organizations across industries and government agencies. Organizations ranging from medium-sized businesses to Fortune 500 enterprises, such as Sempra, Corteva, Chevron, DuPont, Chemours, San Jose Water Company, The Port Authority of New York and New Jersey, Port of Seattle, and Los Alamos National Laboratory, have selected Locus. Locus is headquartered in Mountain View, California. For further information regarding Locus and its commitment to excellence in SaaS solutions, please visit www.locustec.com or email info@locustec.com.
Locus Simplifies Reporting for Buy Clean Programs and Embodied Carbon Emissions
MOUNTAIN VIEW, Calif., August 27, 2024 —Locus Technologies, the sustainability and Environmental Health and Safety (EHS) compliance software leader, today announced that its Sustainable Construction application is compatible with Environmental Product Declarations (EPDs), including those that will be produced and enriched during Phase 1 of the US EPA labeling program that was announced earlier this month. The EPA program will enable purchasers to easily identify and procure verified low embodied carbon construction materials and cite the Global Warming Potential (GWP) of a single unit of the material, as recorded in the EPD. Construction contractors connect the EPDs for their selected materials, spanning multiple product categories such as steel, glass, concrete, asphalt, and discrete mixes, into Locus software, along with data pertaining to the quantity of each material that enters the construction site. Locus calculates the emissions across infinite EPDs and quantity-records to effectively track the environmental impact of building and transportation projects, and to easily demonstrate compliance with low carbon targets.
“Our clients are accurate and credible in every environmental, health, safety, and sustainability pursuit, including clean construction,” said Wes Hawthorne, President of Locus. “Considering the magnitude of construction projects, especially those for government infrastructure, there may be big differences between the predicted emissions in the design phase, and the actual reporting that comes directly from tracking EPDs and verified material quantities.”
The significance, volume, and quality of EPDs is expected to grow subsequent to the EPA labeling program. Locus Sustainable Construction software supports several API integrations, empowering contractors to source EPDs directly from the EC3 database or the EPA’s future EPD and labeling registry. The software also helps to “simplify the process for specifiers and contractors to track compliance with directives to procure and use these materials and products,” as outlined in the EPA announcement, and to demonstrate the cumulative impacts. Locus manages this data across individual infrastructure projects or a portfolio of development sites.
“While the rollouts of the EPA label program will focus on A1 to A3 stages of a Life Cycle Assessment, Locus software is designed with flexibility to manage GHG and other EPD data from your choice of endpoints: Cradle to Gate, Cradle to Laid, and Cradle to Grave,” said Dorian Bailey, former Chief of Clean Construction for the Port Authority of New York and New Jersey and the current Customer Success Director at Locus Technologies. “Net zero ambitions are generally limited to operational carbon, like a building’s energy use, so we are pleased to help A/E and Construction Contractors simplify the work of reducing embodied carbon as well.”
Locus Sustainable Construction is one of several integrated applications available in Locus software. Other Locus offerings include EHS risk and compliance, waste management, water quality, incident management, ESG reporting, and robust environmental data management software. This collection of specialized tools enables clients to manage every facet of sustainable construction and environmental data in one place. To learn more about Locus Sustainable Construction or the full suite of applications, please visit www.locustec.com.
About Locus Technologies
Locus Technologies, the global environmental, social, governance (ESG), sustainability, and EHS compliance software leader, empowers companies of every size and industry to be credible with ESG reporting. From 1997, Locus pioneered enterprise software-as-a-service (SaaS) for EHS compliance, water management, and ESG credible reporting. Locus apps and software solutions improve business performance by strengthening risk management and EHS for organizations across industries and government agencies. Organizations ranging from medium-sized businesses to Fortune 500 enterprises, such as Sempra, Corteva, Chevron, DuPont, Chemours, San Jose Water Company, The Port Authority of New York and New Jersey, Port of Seattle, and Los Alamos National Laboratory, have selected Locus. Locus is headquartered in Mountain View, California. For further information regarding Locus and its commitment to excellence in SaaS solutions, please visit www.locustec.com or email info@locustec.com.
MOUNTAIN VIEW, Calif., 1 March 2022 — Locus Technologies, the leading EHS Compliance, and ESG software provider, today announced the industry-first visual calculation engine for ESG reporting. Locus’s visual calculation engine helps companies easily set up and view their entire ESG data collection and reporting program, enabling full transparency throughout the entire process. Through an interactive branching interface, ESG professionals can quickly identify areas where to focus efforts to improve their ESG performance. Companies that set goals in line with the Science-Based Targets initiative (SBTi) can use Locus’s ESG software to track progress to reach those goals in a transparent and credible manner.
Having a visual calculation engine reduces the burden, time, and potential inaccuracies associated with ESG reporting. The environmental portion of ESG reports includes complex calculations, factors, and numerous data inputs. The visual calculation engine goes beyond GHG (Greenhouse Gas) and addresses any calculations that are part of ESG reporting such as waste generation, resources, and water consumption. Through the visual hierarchical tree, companies can easily get to the sources of any raw data, factors, and formulas used to generate reported ESG metrics.
With an increased focus on ESG reporting and transparency, ensuring accurate reporting is more important than ever. Locus’s award-winning ESG data tracking, analysis, reporting, and visualization software aims at helping organizations plan, implement, and accelerate net-zero strategies. Choosing the right calculation engine plays a crucial part in remaining compliant with rapidly evolving requirements and regulations. In the US, the SEC’s proposed rules expected this year will likely require public companies to report emissions from their operations, energy usage, and resources they consume. The SEC requirements are being driven by the fact that many investors are considering ESG disclosures in their investment decisions. With those requirements, there is an expectation that these reports will be subject to some form of auditing to ensure accuracy. Locus’ accredited GHG verifier designed the visual calculation engine to support this impending requirement. It provides a single consolidated view of all input data, referenced factors, and calculations that went into the ESG report. Through the calculation engine, raw data can be traced back to the user input, integrated external database, utility API, supplier attestation, or any other data source.
Locus’s visual calculation engine supports simultaneous calculations using multiple methods so that users can input data once and report to federal, state, and voluntary reporting programs according to each proper protocol. Once raw data is in the Locus ESG app, reporting can be performed to several different reporting standards such as U.S. EPA Mandatory Reporting Rule, European Union Emissions Trading Scheme (EU ETS) or GRI, SASB, CDP, DJSI, GRESB, and DNSH.
“Locus’ visual calculation engine builds upon over a decade of experience performing verification of ESG data for many companies. Coupled with Locus SaaS Platform it provides all necessary tools to simplify data management, reporting, and visualization of necessary carbon and other calculations in real-time. It provides full transparency for calculations, which become part of an organization’s ESG reporting. As financial-grade audits are applied to ESG reporting, this becomes a critical feature for organizations needing a reliable ESG reporting tool.,” said Wes Hawthorne, President of Locus.
MOUNTAIN VIEW, Calif., 20 November 2015 — Locus Technologies (Locus), the leader in cloud-based environmental compliance and sustainability management software, introduces an all-new calculation engine to its newest platform to redefine how companies organize, manage, and calculate their greenhouse gas (GHG) inventories. The Locus Platform offers a highly configurable, user-friendly interface to fully meet individual organizations’ environmental management needs.
With an increased focus on the role that GHG emissions play in climate change, ensuring that companies’ emissions are reported accurately is more important than ever. GHG emissions reports are coming under increased scrutiny from regulators, stakeholders, verifiers, and financial auditors. Choosing the right calculation engine plays a critical part in remaining compliant with these rapidly evolving requirements and regulations.
GHG inventories may be the result of mandatory state, regional, or national reporting programs, such as California Air Resource Board (AB32), U.S. EPA Mandatory Reporting Rule, or European Union Emissions Trading Scheme (EU ETS). Organizations need a GHG calculation engine that can calculate GHGs automatically and accurately from all emission-producing activities at all of their facilities anywhere in the world. The new Locus calculation engine supports simultaneous calculations using multiple methods so that users can input data once and report to federal, state, and voluntary reporting programs according to each proper protocol.
“The requirements and procedures for GHG reporting are varied, complex, and rapidly evolving. To ensure compliance, companies need a calculation engine that can handle complex equations using appropriate emission factors, conversion factors, and calculation methodologies for each reporting program. The right calculation engine can reduce the stress, time, and potential inaccuracies found in home-grown accounting methods,” said Neno Duplan, President and CEO of Locus.
As a leading accredited GHG verification company in California, Locus observed challenges that many companies experience with GHG inventory calculation, coupled with the gross inadequacy of tools previously available in the market. Informed by the verification of hundreds of inventories, Locus developed the new calculation engine.
“Besides spreadsheets, many calculation engines are proprietary to software vendors and are not transparent. For GHG calculations to pass audits and meet cap & trade requirements, transparency is absolutely required. Some of these ’black box‘ calculation tools have not been sufficiently stress-tested in the market and are generating errors that cause enterprises to fail their GHG verifications. Locus’ calculation engine addresses these deficiencies and capitalizes on the architecture of the highly scalable Locus platform. All calculations are viewable and traceable through the tool to the original data inputs,” said J. Wesley Hawthorne, Locus’ Senior Vice President of Operations and an accredited GHG verifier.
When evaluating carbon management software with built-in calculation engines, companies must ensure that users are able to define both the calculation rules and display of calculated data for the purpose of reporting to various regulators. By giving end users the power to view, analyze, and make changes to analytic model data, Locus helps companies emphasize the transparency of the process and ensure that calculations are correct and that the company meets all verification requirements.
“We listened to industry users and created a configurable calculation engine that is easy to use, dynamically driven, transparent, provides reproducible calculations, and is easy to verify. This calculation engine, along with the Locus Platform, will improve companies’ data collection, analysis, and most importantly, reporting capabilities,” added Duplan.
Locus will conduct live demonstrations of the Locus Platform and calculation engine at the Locus booth at the National Association for Environmental Management (NAEM) 2016 Sustainability Software and Data Management Conference from March 15-16, 2016 in Tampa, FL.
“Taming Environmental Data” by Neno Duplancic and Gregory Buckle. Originally published in Civil Engineering magazine, August 1992.