At Locus, we are constantly exploring innovative ways to visualize and analyze large datasets, empowering users to derive insights with ease. One crucial aspect of data analysis is ensuring the accuracy and reliability of the data being collected. Field readings and groundwater measurements taken using various instruments can sometimes produce values that deviate from established historical trends. To address this, Locus has developed a service utilizing the open-source Prophet time series forecasting model to identify outliers in groundwater elevation data.
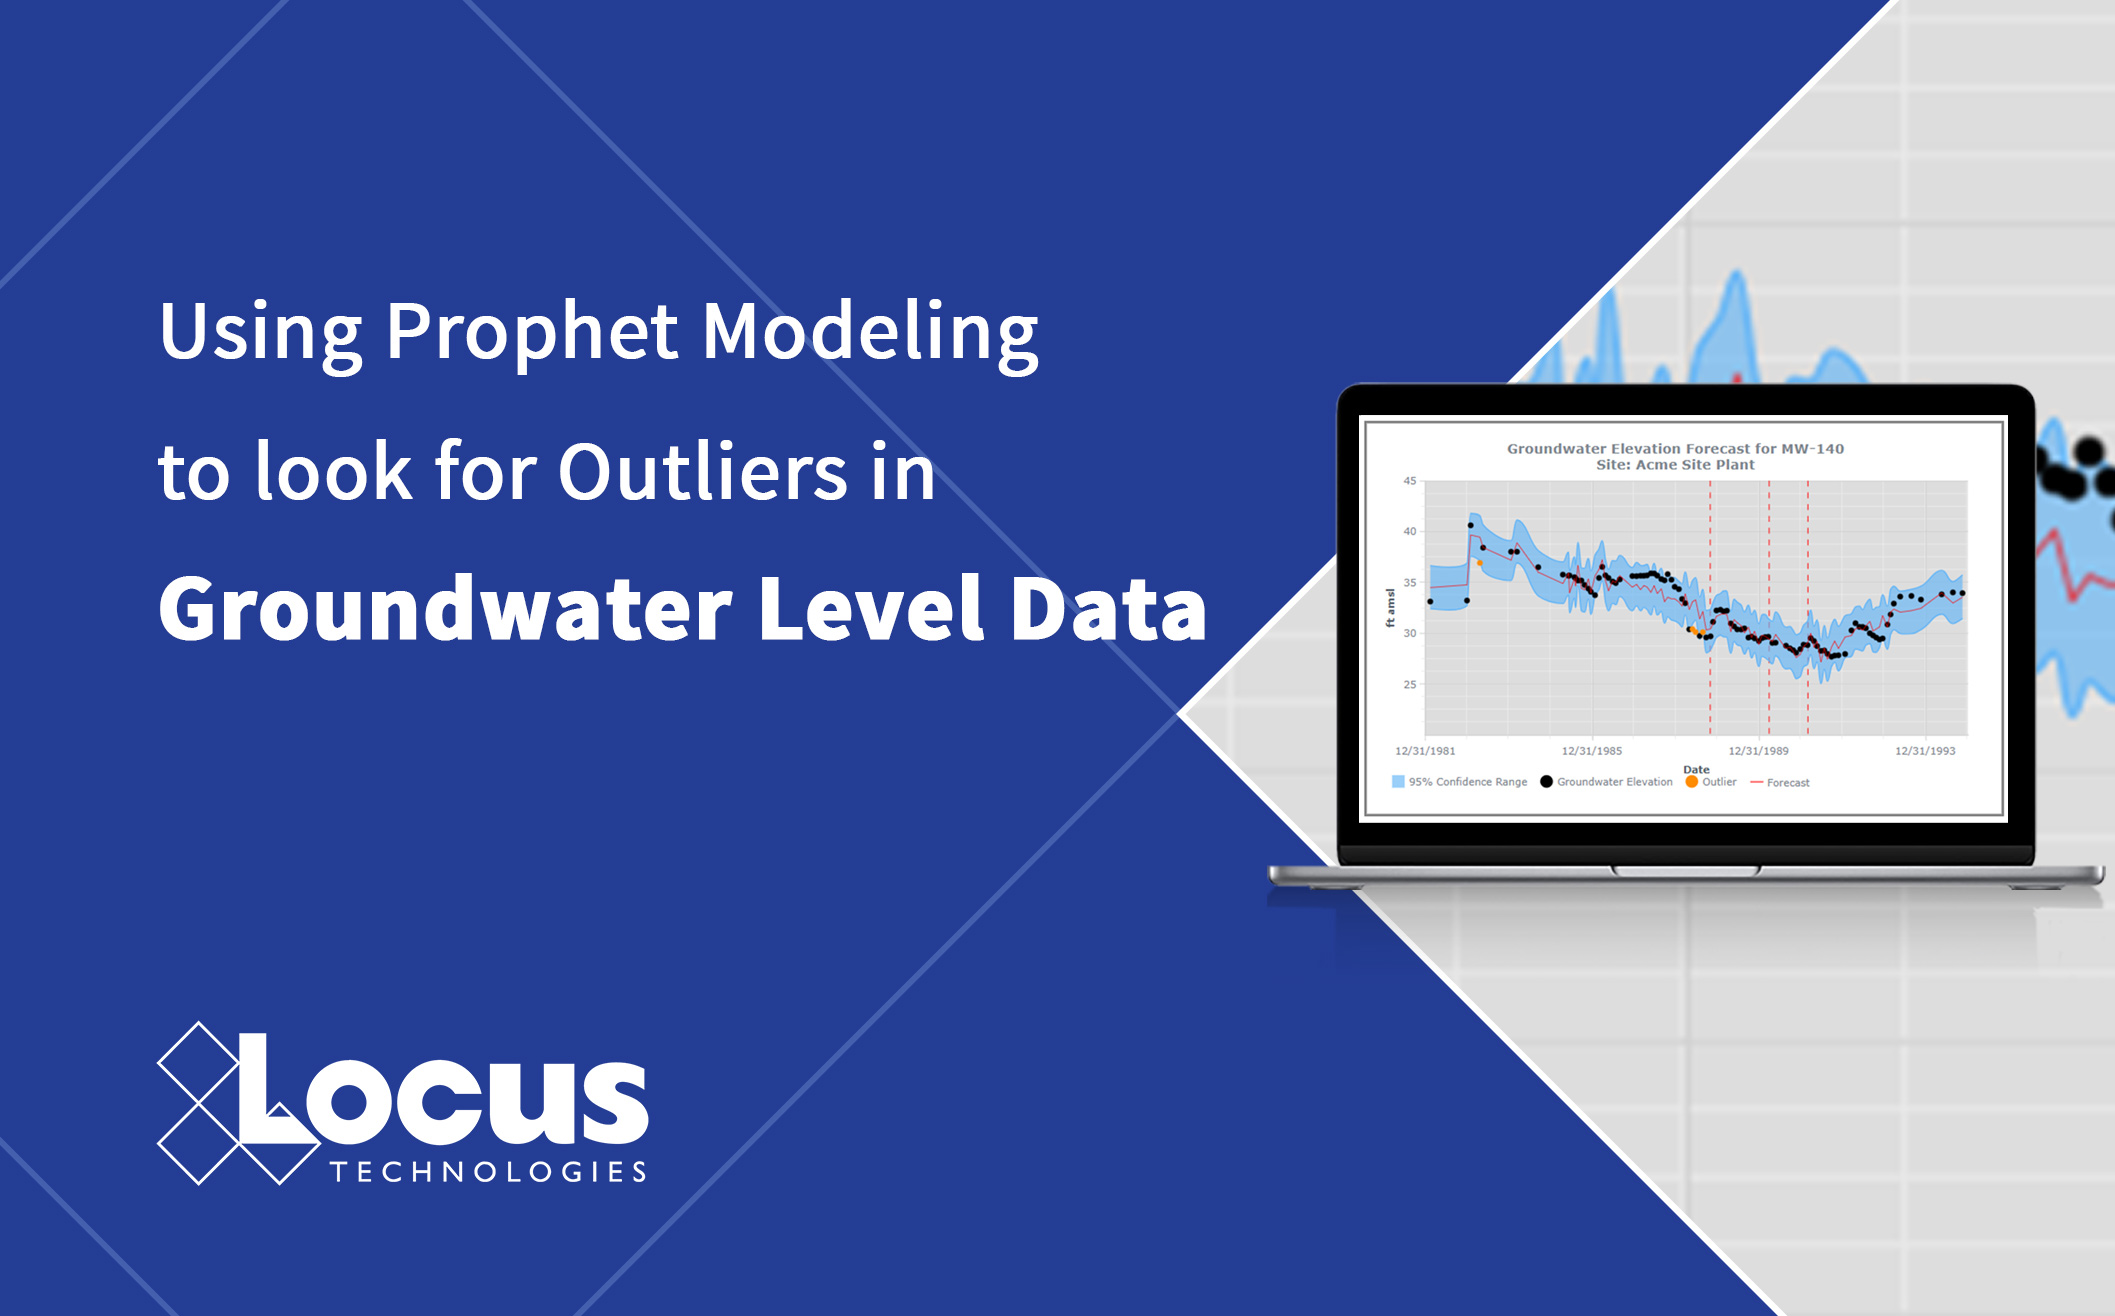
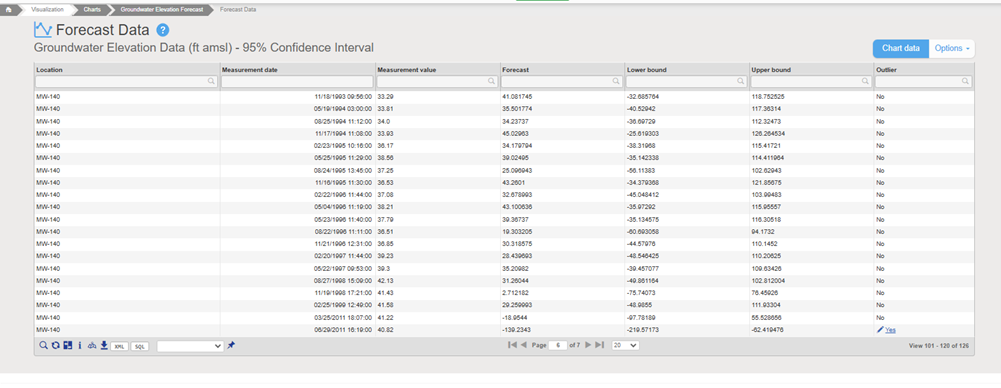
Prophet, an open-source tool developed by Facebook’s Data Science team, creates time series forecasts using an additive model that incorporates non-linear trends, seasonality, and holiday effects. By accepting a time series as input, Prophet calculates predicted values along with upper and lower confidence intervals. If a recorded measurement falls outside of the model’s predicted range, it is flagged as an outlier. The results of this analysis are presented in both tabular and graphical formats, offering an intuitive way to interpret the data.
The Outlier Detection Process
The process begins by selecting specific locations and date ranges to query for relevant groundwater data. Each location is analyzed individually using a separate run of the Prophet model. The model’s inputs, such as seasonality, confidence interval, change point prior scale, and holiday events, can be customized based on the user’s needs.
Once the selections are made, the Prophet model is run to generate forecast values and confidence intervals. We use a custom-built Python service to query the data and invoke the Prophet library to model the time series data. The results are then written to a SQL table, which facilitates data presentation and chart creation. Any measurement falling outside of the model’s confidence interval is flagged as an outlier and linked to the original record, allowing users to review, comment on, and confirm the outlier status. Flagged outliers are excluded from future modeling runs, refining the confidence intervals over time and improving the accuracy of subsequent analyses.
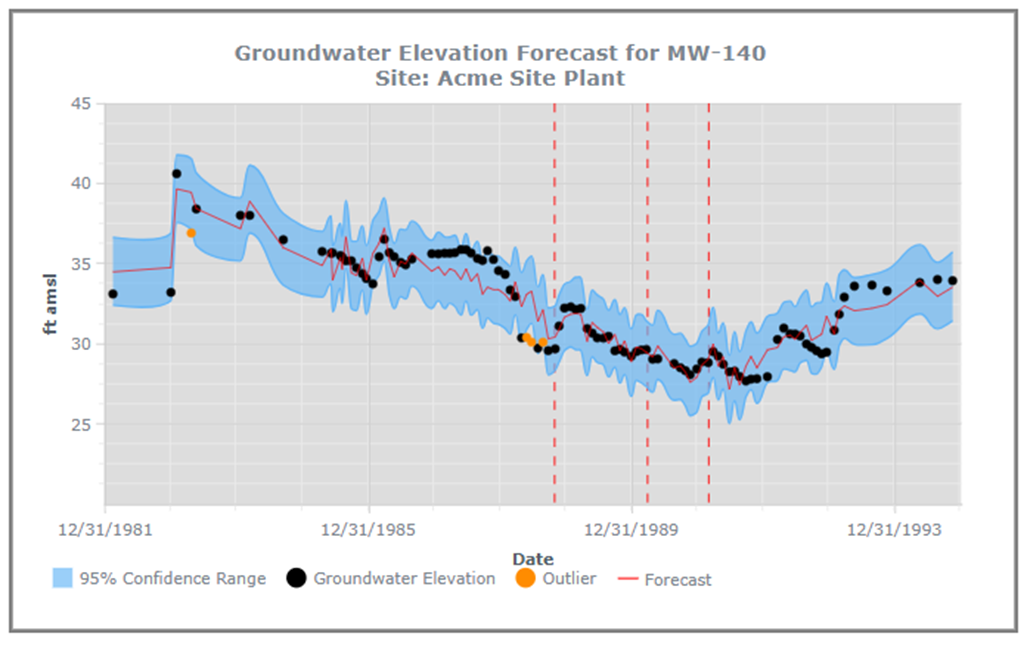
Visualization and User Interaction
The data is visualized with charts that clearly illustrate trends and highlight outliers. Users can input specific dates when significant events occurred or allow the model to automatically identify these change points, which are displayed as red vertical lines on the graph. By hovering over outliers on the chart, users can view the specific values associated with each anomaly.
Although this example uses a relatively small test dataset, Locus customers have successfully employed our Prophet service to analyze wells with tens of thousands of data points. Looking ahead, we plan to automate the Prophet model’s execution upon the upload of new data, automatically detecting whether new water elevation measurements align with historical trends or should be flagged as potential outliers.
This proactive approach to data quality and anomaly detection empowers users to trust their data while gaining deeper insights into groundwater trends.
Locus is the only self-funded water, air, soil, biological, energy, and waste EHS software company that is still owned and managed by its founder. The brightest minds in environmental science, embodied carbon, CO2 emissions, refrigerants, and PFAS hang their hats at Locus, and they’ve helped us to become a market leader in EHS software. Every client-facing employee at Locus has an advanced degree in science or professional EHS experience, and they incubate new ideas every day – such as how machine learning, AI, blockchain, and the Internet of Things will up the ante for EHS software, ESG, and sustainability.