Integrating Locus Applications with Business Intelligence Apps Using Locus APIs

GeoBI
A key wish list item for many EHS software buyers is integration with business intelligence (BI) systems, whether on-premises or in the cloud. With BI, you can perform analysis on your EHS data to look for trends and make predictions. You can also create visualizations, arrange them into custom dashboards or reports, and then share these with other users. Because organizations with EHS data may have already invested time, money, and effort to create custom visualizations and reports in their business intelligence software, it is important for EHS software to support that investment through integration.
Locus’s EIM and Locus Platform (LP) cloud applications both support integration with BI systems. As a result, Locus users can leverage their data stored in EIM and LP and continue to exploit their existing investments in BI.
Using Locus APIs
Locus supports BI integration through the Locus APIs. An API is an Application Programming Interface. You can think of an API as a ‘bridge’ between two applications. One application makes a request for data to the API, which then passes the request to the other application. The second application provides the data to the API, which returns it in a format the first application can use.
Locus hosts an API for both its EIM and LP applications. The Locus APIs are REST APIs; a REST API is simply an API that follows standards so the API can be accessed by calling a URL. To use the APIs, you need to include some information in your request, such as the query to run and your Locus login credentials. The Locus APIs then return data in JSON or OData format, which are standard text-based data formats understood by many business intelligence applications.
The Locus APIs return data from a user-defined query in EIM or LP. In EIM, you first create an Expert Query to return the data you want. Once EIM validates the query as standard SQL, the query can be run in EIM and can also be called from the EIM API. In LP, the API returns data from a user-defined data source. You first create a data source to return data you want. Once the data source is tested and saved in LP, it can be called from the LP query API.
Because the API is always ‘live’, your BI applications always refresh the API calls to show the latest data in EIM. Your visualizations stay current and up to date.
Locus APIs and Power BI
Two well-known BI apps are Microsoft’s Power BI and Salesforce’s Tableau Software. These applications let you access offline and online data sources and turn the data into visualizations of various types such as line charts, scatter plots, or dot maps. Let’s look at using the Locus API with Power BI.
To use a Locus API in Power BI, you first enter the URL path to the Locus API for the desired EIM Expert Query or LP data source. You then enter your EIM or LP login credentials so the Locus API can authenticate you as a valid user.
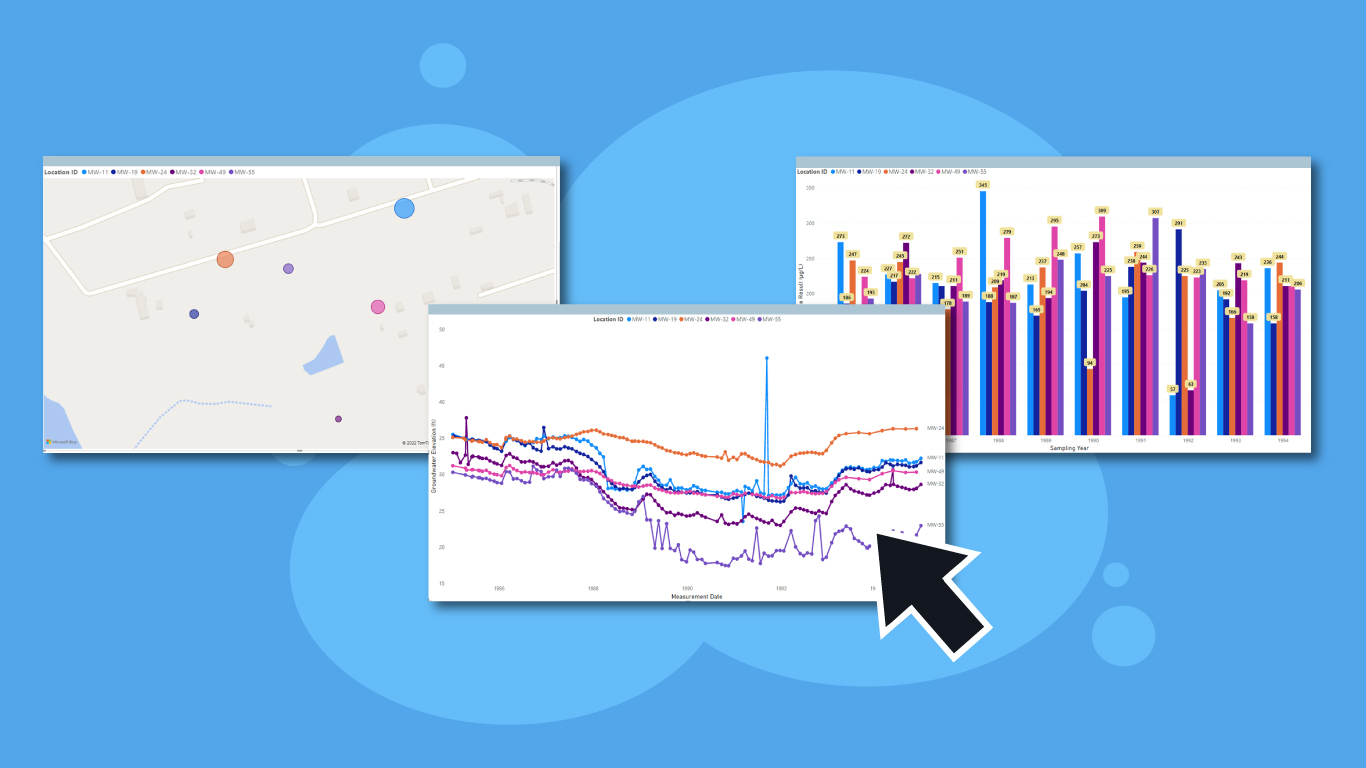
Power BI then connects to the Locus API and gets the data results in JSON format. Power BI opens a ‘power query editor’ where you can review the data and make any needed changes to data types. You can then make many types of data visualizations. Here are some examples; the first shown is a line graph of groundwater elevations from EIM for multiple locations.

And here is a bar graph showing the maximum benzene result for six wells in EIM over a ten-year period.

As a further illustration, here is a map showing the data values from the chart above for just the first year (1985).

Finally, here is an example of a heatmap using a query from the LP app that shows CO2 emissions categorized by contract and material type.

Working with Tableau BI is the same as Power BI except that you use OData formatted results from the Locus API. Just as with Power BI, you can then review the data and make different charts and maps. As an example, here is the Tableau version of the previous Power BI chart showing maximum benzene result over a ten-year period.

Conclusion
There are many clear benefits to integrating modern software tools such as EIM, LP, Tableau, and Power BI wherever you can in your EHS processes. Even if some integrations are only optional for your needs, consider the added value to your organization in simplifying your EHS software implementation, maximizing other available resources, and improving the reliability and accuracy of data sources driving your EHS decisions. Integrations are sometimes initially perceived as an optional feature, but you should consider making it a requirement for your EHS software based on these benefits. As new integration tools increasingly become available, you’ll find more value in having a system that can use them to their full advantage.
Contact Locus Technologies for more information!


