EIM: Configurable Software that Meets Your Needs
One of the key advantages of Locus’s environmental software is the ability to configure the software to fit your needs. If you buy pre-configured software, you must adapt your process to fit the constraints of the system you just bought. When you buy configurable software such as Locus’s EIM and Locus Platform, you’re able to create the exact workflow that you need.
EIM has multiple features that customers have used to configure the tasks of uploading, processing, querying, and reporting for their analytical, groundwater, and field data. For example, to date customers have created over:
- 2,750 expert and intermediate queries
- 4,300 enhanced formatted reports (EFRs)
- 830 electronic data deliverable (EDD) formats
- 950 saved query filters and output column lists
- 150 saved chart option sets
- 180 saved GIS+ maps
Let’s look at a few of the items above.
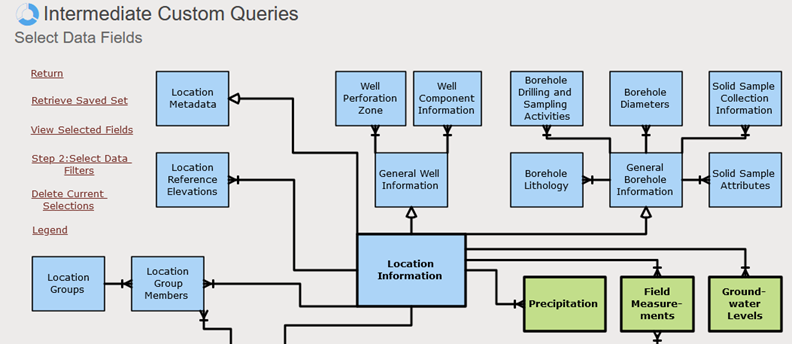
The Custom Queries module has features to configure and save your own queries tailored to the output that you require. The Intermediate Custom Queries module lets you select desired tables and fields, add selection filters, and then run the query. You also can save your query for future use. The image here shows one of the forms in this module. This form lets you build a query using a diagram showing tables and their relationships.

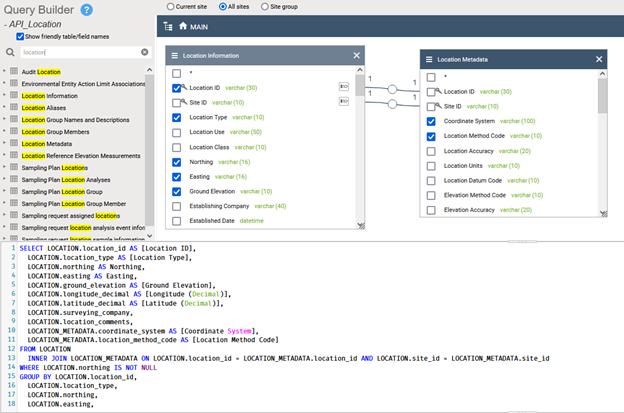
EIM also supports creating and saving Expert Custom Queries. You create these queries by using the Query Builder, a drag and drop interface for query creation. You can also edit the query using T-SQL (structured query language) if you know that language, but it’s not required to use the module. Once a query is created, it can be run by any user. You can also set up schedules that run a specified Expert Query at certain times, with the results emailed to selected users. In addition, Expert Queries can be called using the Locus EIM API with results accessed in other applications. The image here shows the Query Builder interface.

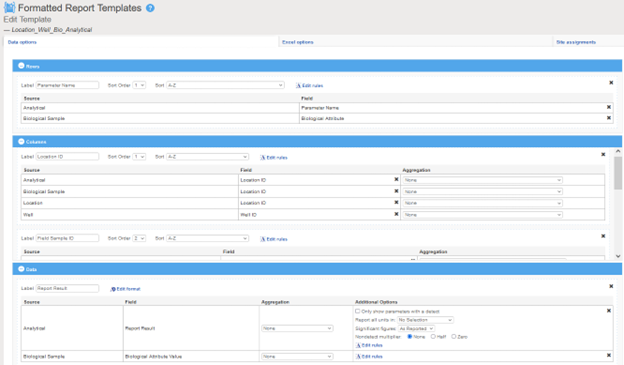
The Enhanced Formatted Report (EFR) module lets you create print-ready Excel spreadsheets that combine multiple data sources into compact pivot tables. EFRs are highly configurable. You can select the data fields to put into the rows and columns, as well as the fields to show in the cells of the pivot table. Furthermore, you can aggregate the data (for example, using the maximum or average).
You can also create, save, and apply rules for formatting the data. Maybe you need data to be highlighted in certain colors based on the data value, or whether the data exceeds an action limit. Or maybe you need the data modified to append certain flags based on data validation. You can support these scenarios, plus many others, in the EFR Module.
The image below shows the EFR interface for selecting fields for the rows, columns, and cells of an EFR pivot table.

The EIM Charting module lets you create line, bar, and scatter plots of your data. Once you create a chart, you have full control over all parts of the chart display, including the fonts and colors used for the chart axes, data points, legend, and labels. The image below shows many of the configurable options available for EIM charts.

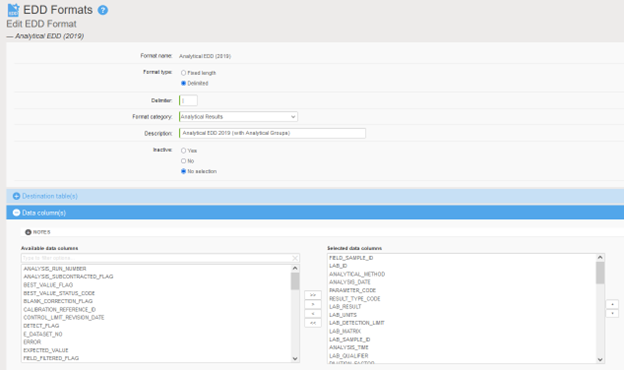
The EDD Format Setup module lets you create and configure the EDD formats used for uploading your data into EIM. When you create a new EDD format, you specify a data delimiter as well as the destination tables and columns that are populated by the EDD. You can order the columns as needed to match your incoming EDDs. The image below shows the main form for setting up an EDD format.

EIM has many other configurable modules, such as the Analysis grids, the EDD Validation module, and the GIS+ module. All these tools let you fit EIM to your needs and processes. That’s the power of configurable software! For more information, contact Locus Technologies.

