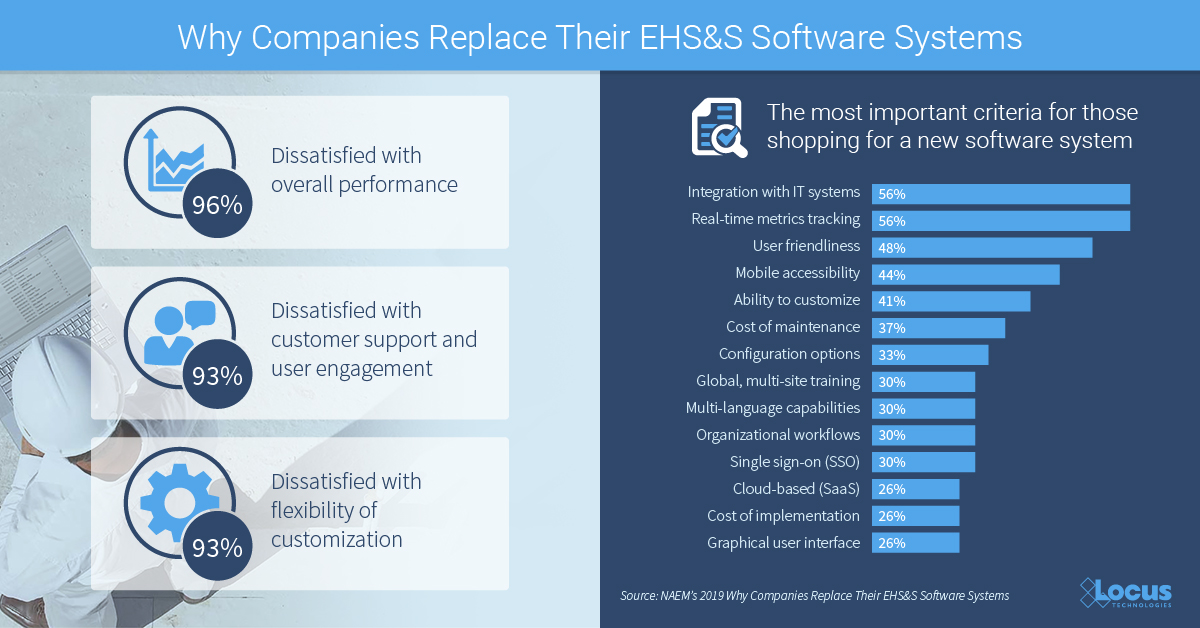
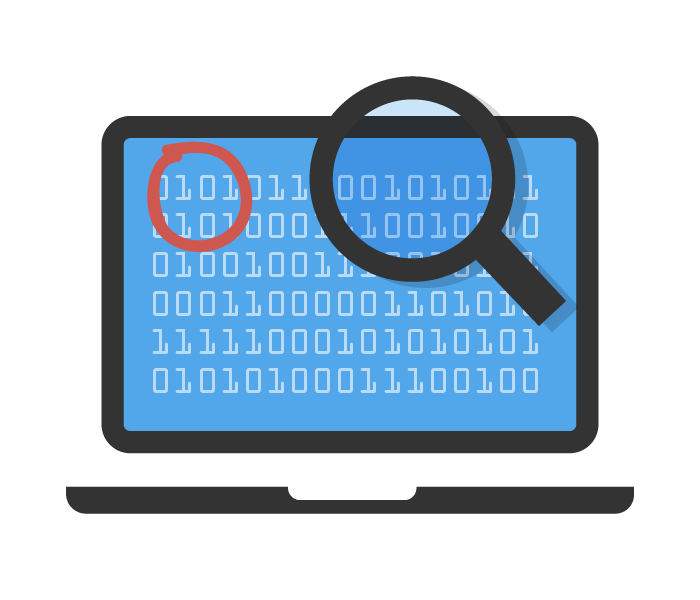
A recent NAEM study explored the main reasons EHS&S professionals look to replace their current software configuration. Among the most reported issues were overall performance, customer support, and software customization. The following infographic highlights both why EHS&S professionals are seeking new software, and wheat criteria are most important in shopping for a new software system.
https://www.locustec.com/wp-content/uploads/2020/01/locus_infographic_why-companies-replace-software-1.jpg6281200Locus Product Teamhttps://www.locustec.com/wp-content/uploads/2023/12/locus_logo_2x.pngLocus Product Team2020-01-23 05:00:452025-03-17 12:38:04Why Companies Replace Their EHS&S Software Systems
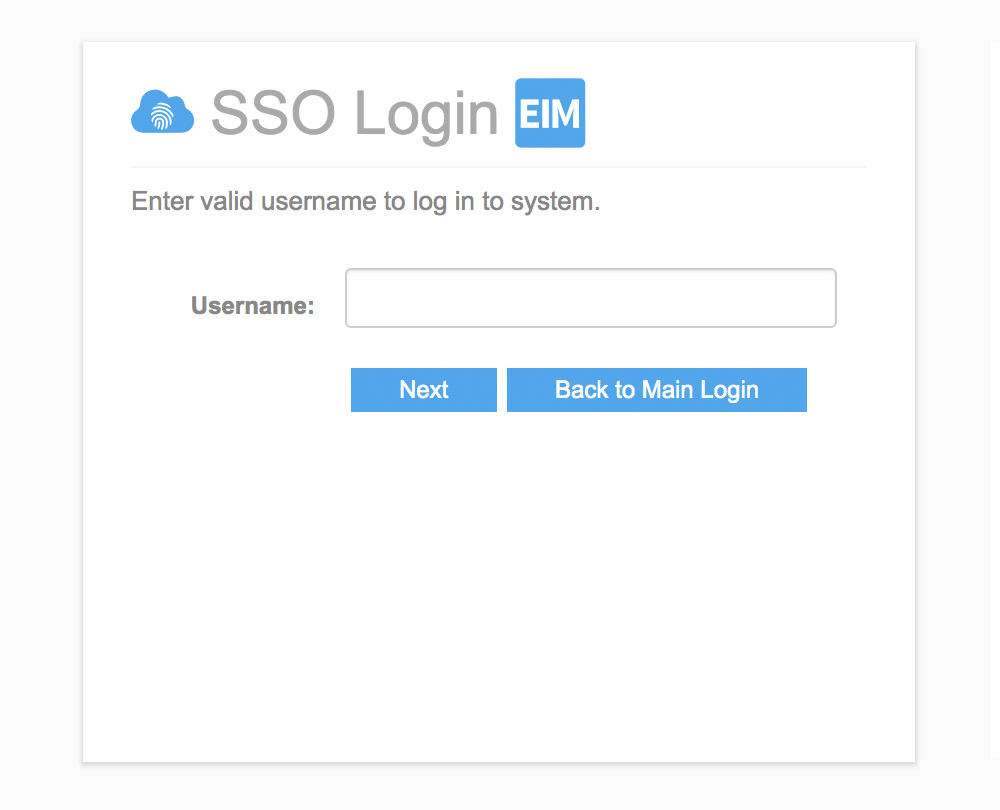
EIM now supports Single Sign-On (SSO), allowing users to access EIM using their corporate authentication provider. SSO is a popular security mechanism for many corporations. With SSO, one single login allows access to multiple applications, which simplifies username and password management and reduces the number of potential targets for malicious hacking of user credentials. Using SSO with EIM requires a one-time configuration to allow EIM to communicate with a customer’s SSO provider.
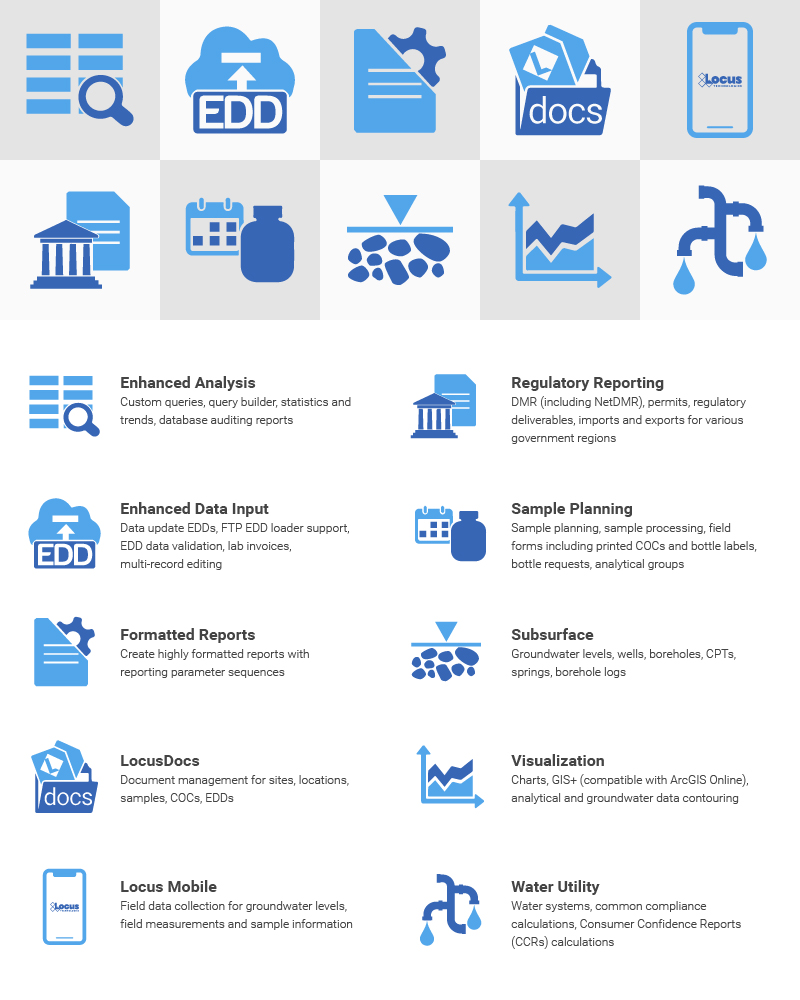
3. GIS+ Data Callouts
The Locus GIS+ solution now supports creating data callouts, which are location-specific crosstab reports listing analytical, groundwater, or field readings. A user first creates a data callout template using a drag-and-drop interface in the EIM enhanced formatted reports module. The template can include rules to control data formatting (for example, action limit exceedances can be shown in red text). When the user runs the template for a specific set of locations, EIM displays the callouts in the GIS+ as a set of draggable boxes. The user can finalize the callouts in the GIS+ print view and then send the resulting map to a printer or export the map to a PDF file.
4. EIM One
For customers who don’t require the full EIM package, Locus now offers EIM One, which gives the ability to customize EIM functionality. Every EIM One purchase comes with EIM core features: locations and samples; analytical and field results; EDD loading; basic data views; and action limit exceedance reports. The customer can then purchase add-on packages to get just the functionality desired–for example a customer with DMR requirements may purchase the Subsurface and Regulatory Reporting packages. EIM One provides customers with a range of pricing options to get the perfect fit for their data management needs.
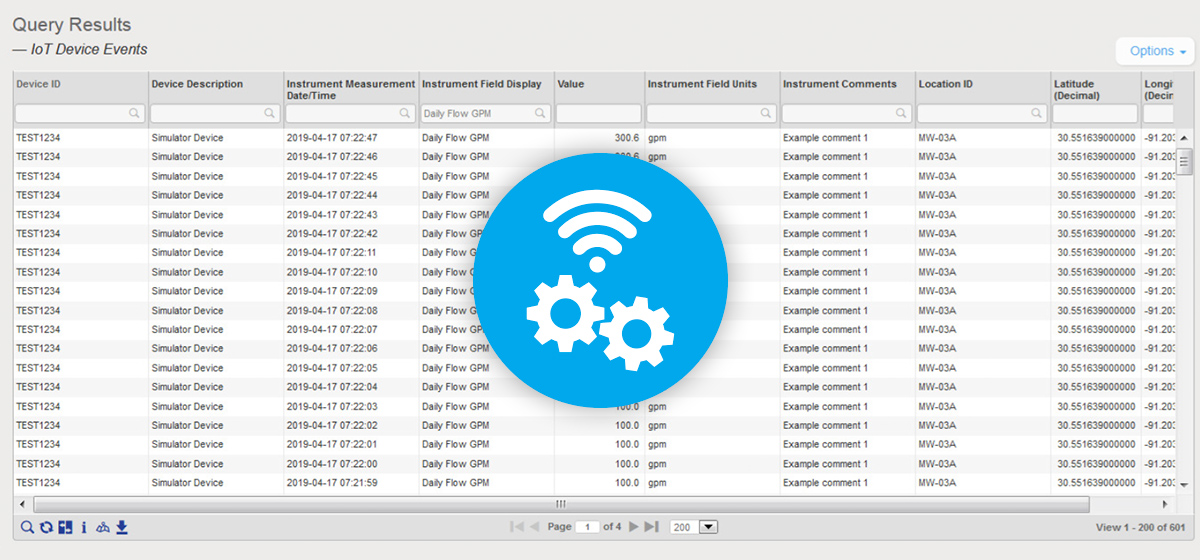
5. IoT data support
EIM can now be configured to accept data from IoT (internet of things) streaming devices. Locus must do a one-time connection between EIM and the customer’s IoT streaming application; the customer can then use EIM to define the devices and data fields to capture. EIM can accept data from multiple devices every second. Once the data values are in EIM, they can be exported using the Expert Query tool. From there, values can be shown on the GIS+ map if desired. The GIS+ Time Slider automation feature has also been updated to handle IoT data by allowing the time slider to use hours, minutes, and seconds as the time intervals.
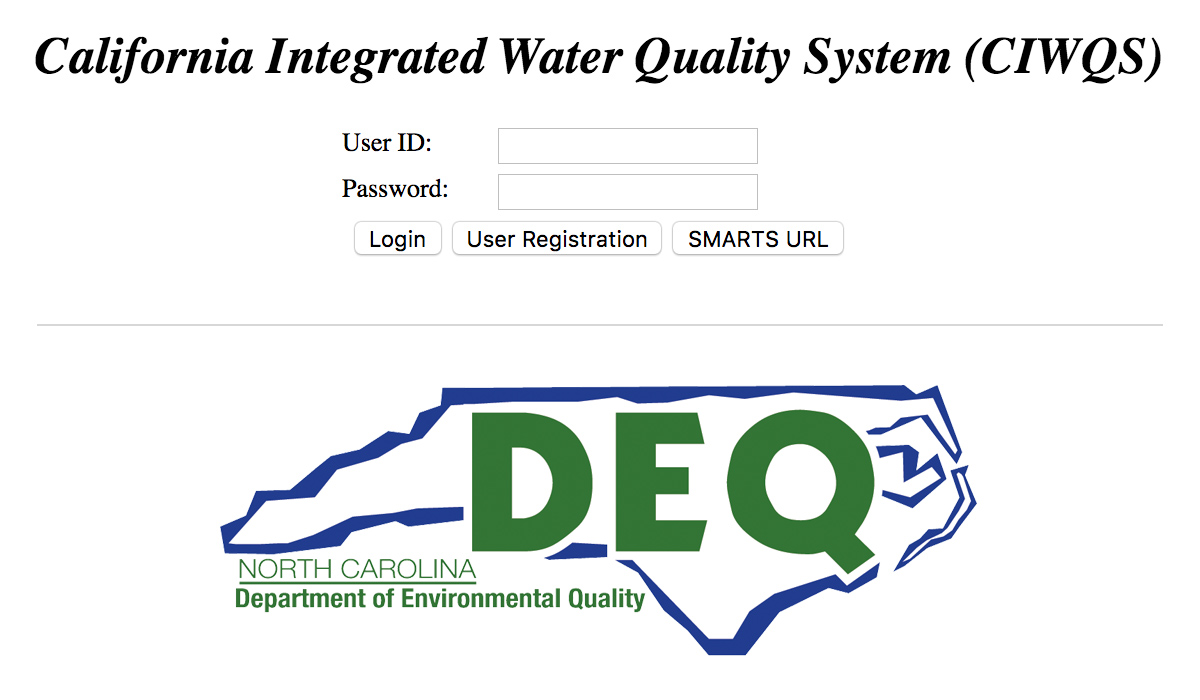
6. CIWQS and NCDEQ exports
EIM currently supports several dozen regulatory agency export formats. In 2019, Locus added two more exports for CIWQS (California Integrated Water Quality System Project) and the NCDEQ (North Carolina Department of Environmental Quality). Locus continues to add more formats so customers can meet their reporting requirements.
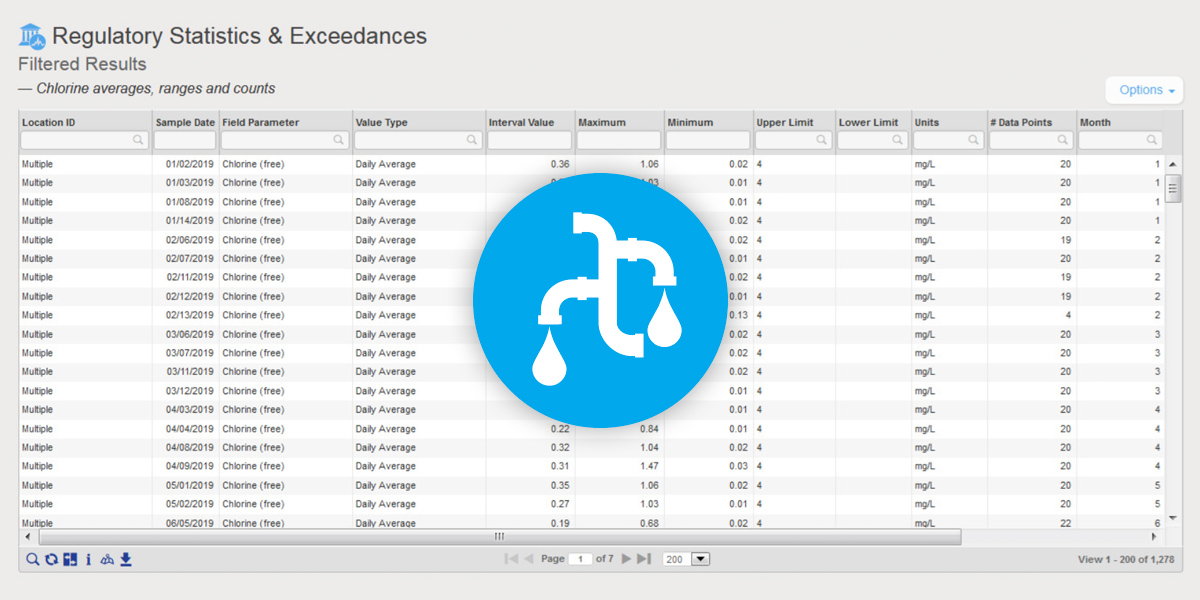
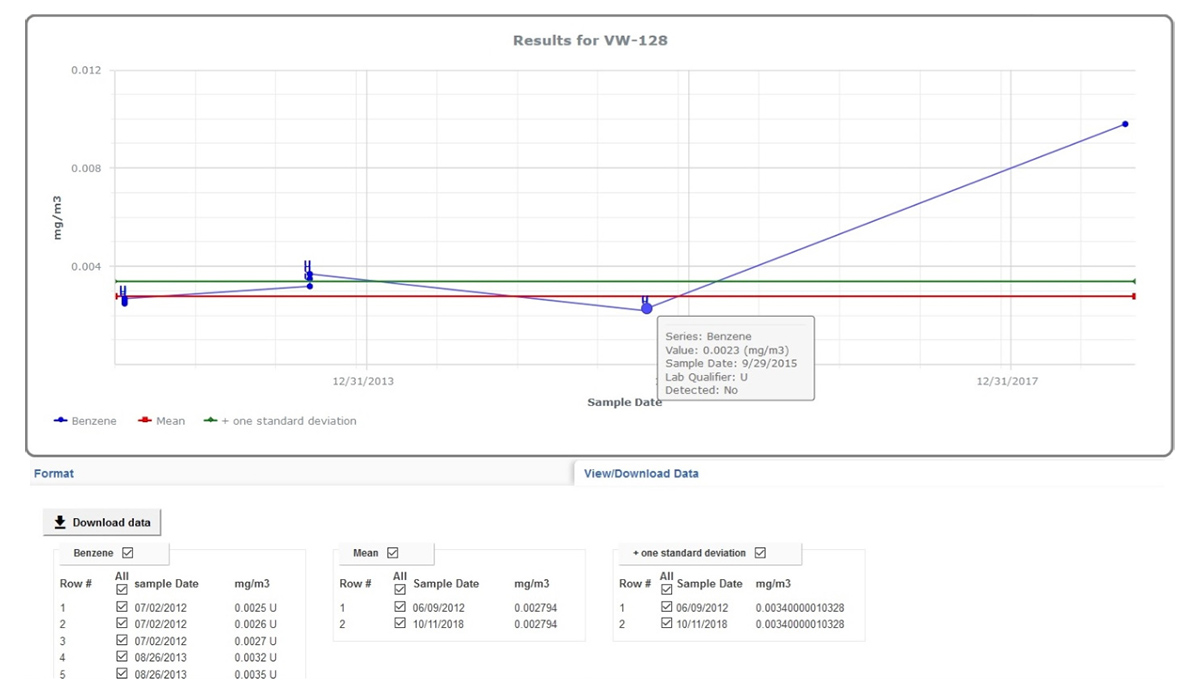
7. Improved Water Utility reporting
EIM is the world’s leading water quality management software, and has been used since 1999 by many Fortune 500 companies, water utilities, and the US Government. Locus added two key reports to EIM for Water in 2019 to further support water quality reporting. The first new report returns chlorine averages, ranges, and counts. The second new report supports the US EPA’s Lead and Copper rule and includes a charting option. Locus will continue to enhance EIM for Water by releasing the 2019 updates for the Consumer Confidence Report in January 2020.
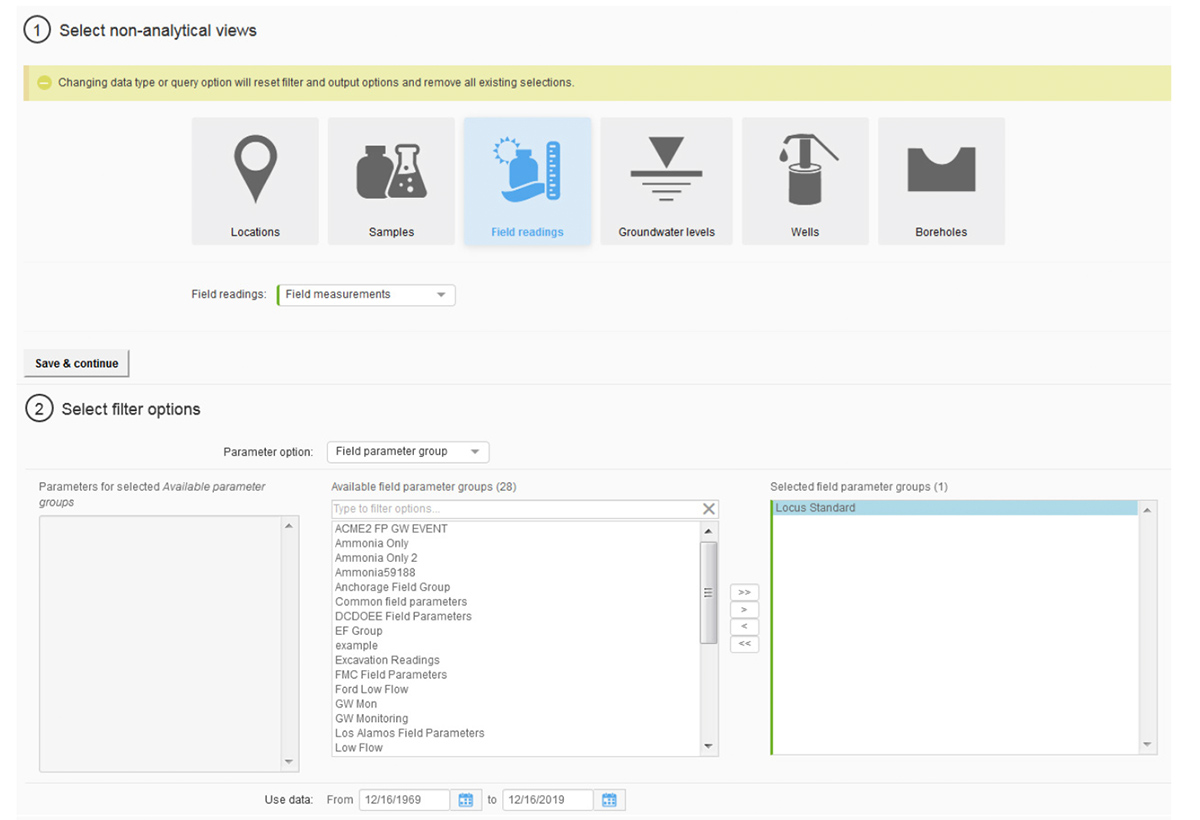
8. Improved Non-Analytical Views
Locus continues to upgrade and improve the EIM user interface and user experience. The most noticeable change in 2019 was the overhaul of the Non-analytical Views pages in EIM, which support data exports for locations, samples, field readings, groundwater levels, and subsurface information. Roughly 25 separate pages were combined into one page that supports all these data views. Users are directed through a series of filter selections that culminate in a grid of results. The new page improves usability and provides one centralized place for these data reports. Locus plans to upgrade the Analytical Views in the same way in 2020.
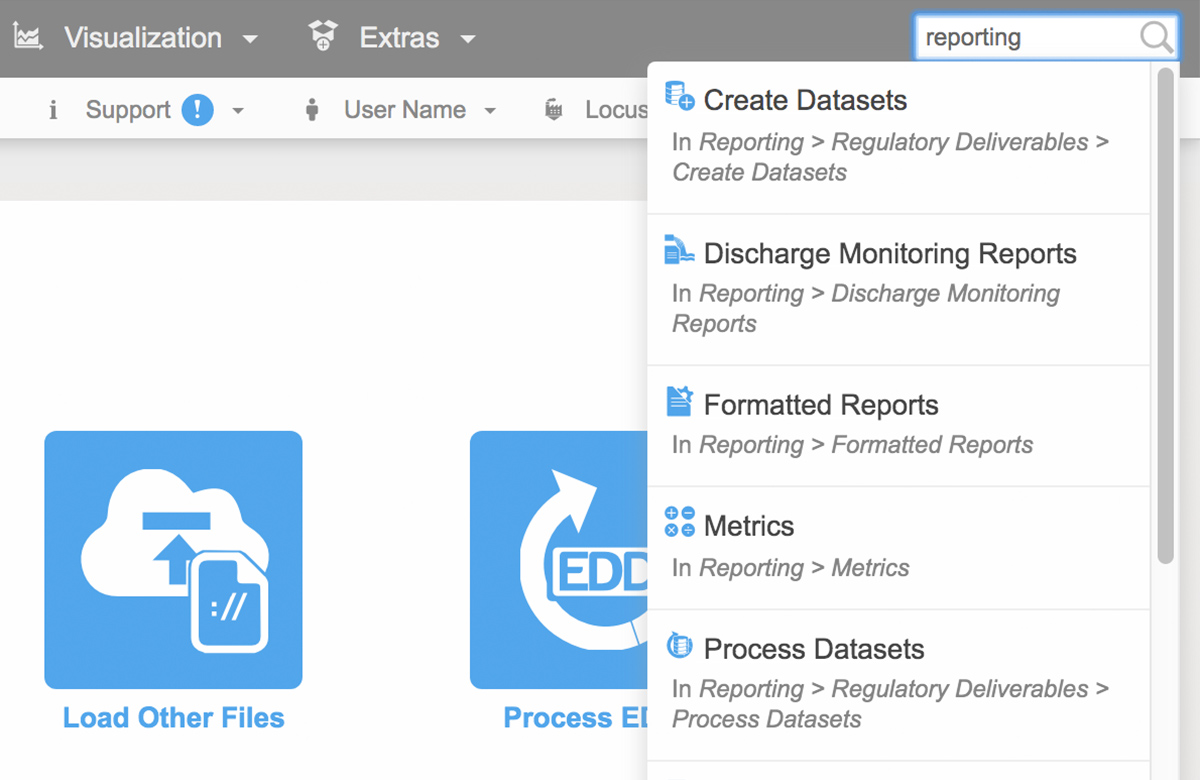
9. EIM search box
To help customers find the correct EIM menu function, Locus added a search box at the top right of EIM. The search box returns any menu items that match the user’s entered search term. In 2020, Locus will expand this search box to return matching help file documents and EDD error help, as well as searches for synonyms of menu items.
10. Historical data reporting in EDD loading
The EIM EDD loader now has a new “View history” option for viewing previously loaded data for the locations and parameters in the EDD. This function lets users put data in the EDD holding table into proper historical context. Users can check for any unexpected increases in parameter concentrations as well as new maximum values for a given location and parameter.
https://www.locustec.com/wp-content/uploads/2015/12/locus_screenshot_water-utility-dashboard-laptop-location-list-ipad_1062x845.png8451062Dr. Todd Piercehttps://www.locustec.com/wp-content/uploads/2023/12/locus_logo_2x.pngDr. Todd Pierce2019-12-31 05:44:452025-03-17 12:38:05Top 10 Enhancements to Locus Environmental Software in 2019
Two additional types of task periodicity have been added: Triggered tasks, which allow the automatic creation of a Task based on the creation of a triggering event (e.g., a spill or storm event), and Sequenced tasks, which allow the creation of a series of tasks in a designated order. Learn more about our compliance and task management here.[/sc_icon_with_text]
Users can now create a mobile version of any data input form. Every form in the desktop platform can be mobile-enabled, so you can introduce new ways of streamlining data collection to your team.[/sc_icon_with_text]
Our expanded Facilities Management App is designed to map at the enterprise level showing all locations, navigate your facilities hierarchy to review information and quickly take action at every level. Locus Facilities is a comprehensive facility management application that aims to increase the efficiency of customer operations and centralize important company information.[/sc_icon_with_text]
Users can choose from existing portlets (found on the dashboard pages) to customize their landing page to their unique needs. Create custom dashboards to highlight exactly the information you want in any format (charts, maps, tables, tree maps, diagrams, and more).[/sc_icon_with_text]
Add notes to any record by sending an email directly into the system. Allows anyone to add or append to a record in the system simply through email.[/sc_icon_with_text]
https://www.locustec.com/wp-content/uploads/2018/08/locus_screenshot_ehs-software-lp-applications.png11541064Locus Product Teamhttps://www.locustec.com/wp-content/uploads/2023/12/locus_logo_2x.pngLocus Product Team2019-12-30 05:29:232025-03-17 12:38:05Top Enhancements to Locus EHS Compliance Software in 2019
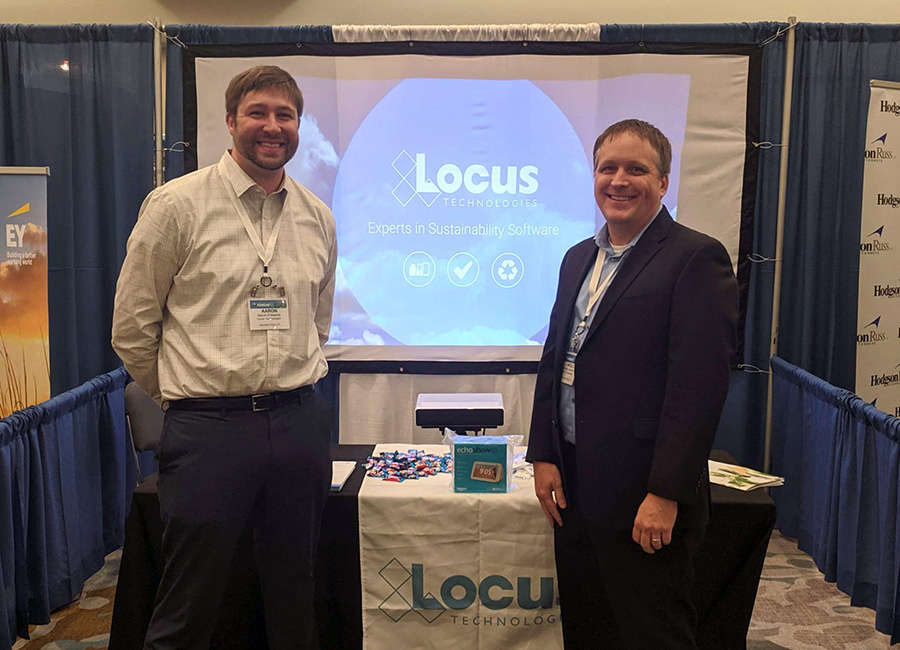
Locus Technologies is proud to have attended this year’s NAEM EHS&S Forum in Toronto. We were represented by Wes Hawthorne, President of Locus, and forum first-timer, Aaron Edwards, Marketing Associate at Locus.
The forum gave us the opportunity to learn, both from our peers in discussions about EHS&S goals, and from the diverse lineup of respected speakers and presenters. You spoke and we listened. This year, the prevailing topic of discussion was the growth of expectation surrounding sustainability in organizations.
Sustainability initiatives are rapidly moving to the forefront of institutional policy at leading organizations. As consumers, investors, and shareholders are increasingly supporting more sustainable organizations, executives are expecting more impactful sustainability initiatives from their EHS&S departments. Not only that, but executives inherently expect sustainability initiatives to positively affect the bottom line. This means that today’s EHS&S professionals have to manage sustainability initiatives that are vital to company success as well as regulatory management and reporting, often with limited resources.
Our conversations at the NAEM Forum often revolved around the time-consuming nature of regulatory compliance interfering with the escalated focus on sustainability. Many of the professionals we spoke with are dealing with multiple EHS&S platforms, each used for a specific function. Time management is increasingly more essential to EHS&S managers, and juggling between uni-tasked platforms is detrimental to effective sustainability efforts.
Locus developers have designed our software to reduce the labor-intensiveness of regulatory compliance. We offer a configurable single-platform solution for decreasing the amount of time you spend managing KPIs. From available modules in waste management, audit tracking, GHG reporting, and more—our configurable software allows more time to improve your company’s sustainability initiatives.
Sustainability is no longer an afterthought in the eyes of executives, consumers, investors, or shareholders. Having one robust software platform can greatly help EHS professionals integrate that “&S” seamlessly with their other responsibilities.
https://www.locustec.com/wp-content/uploads/2019/10/Aaron-Wes-Booth-NAEM_900x650.jpg650900Aaron Edwardshttps://www.locustec.com/wp-content/uploads/2023/12/locus_logo_2x.pngAaron Edwards2019-10-24 06:11:032025-03-17 12:38:06When it comes to EHS&S, the “&S” shouldn’t be an afterthought
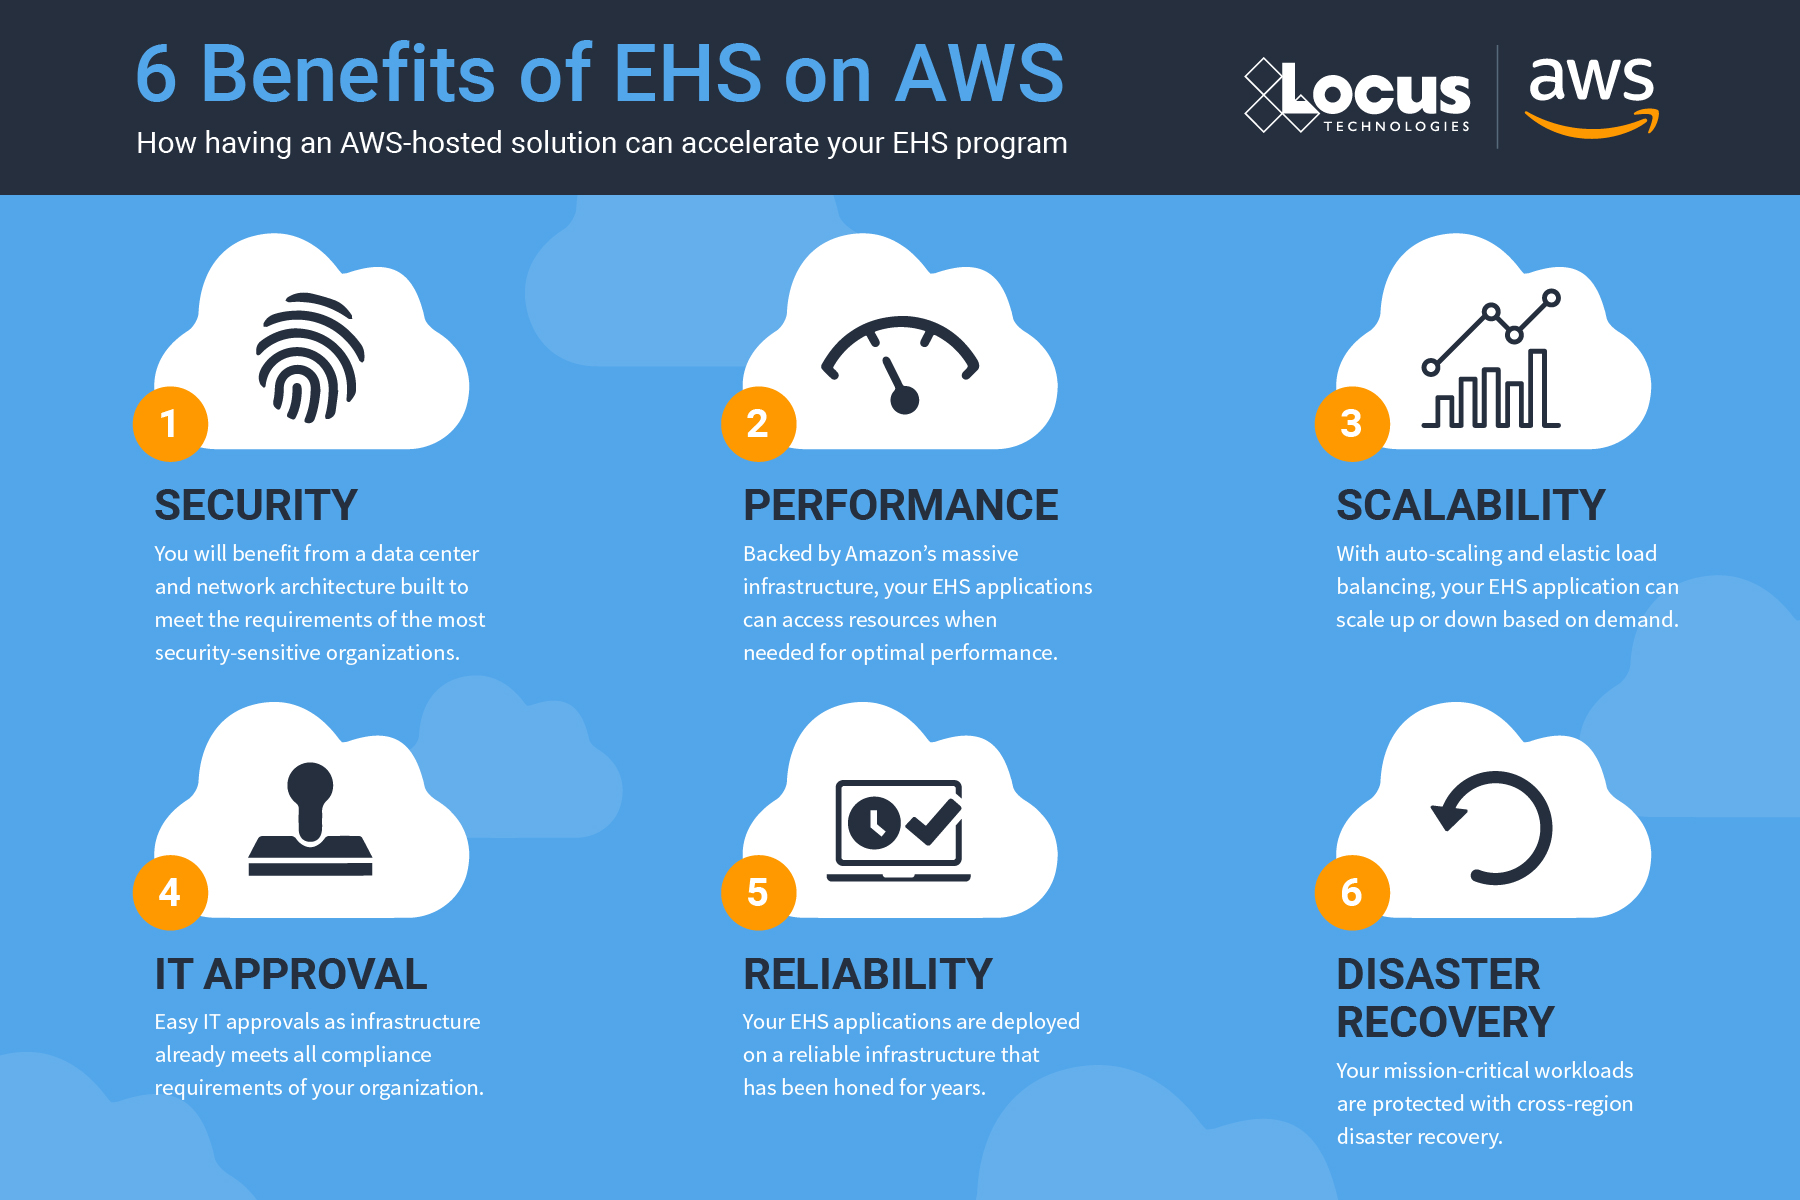
In this infographic, we have outlined a few of the ways EHS programs benefit from having an AWS-hosted solution. Locus customers recently received these benefits as a result of moving our entire infrastructure to Amazon Web Services—the world’s leading cloud. Learn more about the move to AWS.
https://www.locustec.com/wp-content/uploads/2019/08/locus_graphic_aws-cover-1.jpg375600Locus Product Teamhttps://www.locustec.com/wp-content/uploads/2023/12/locus_logo_2x.pngLocus Product Team2019-08-19 07:45:352025-03-17 12:38:06Infographic: 6 Benefits of EHS on AWS
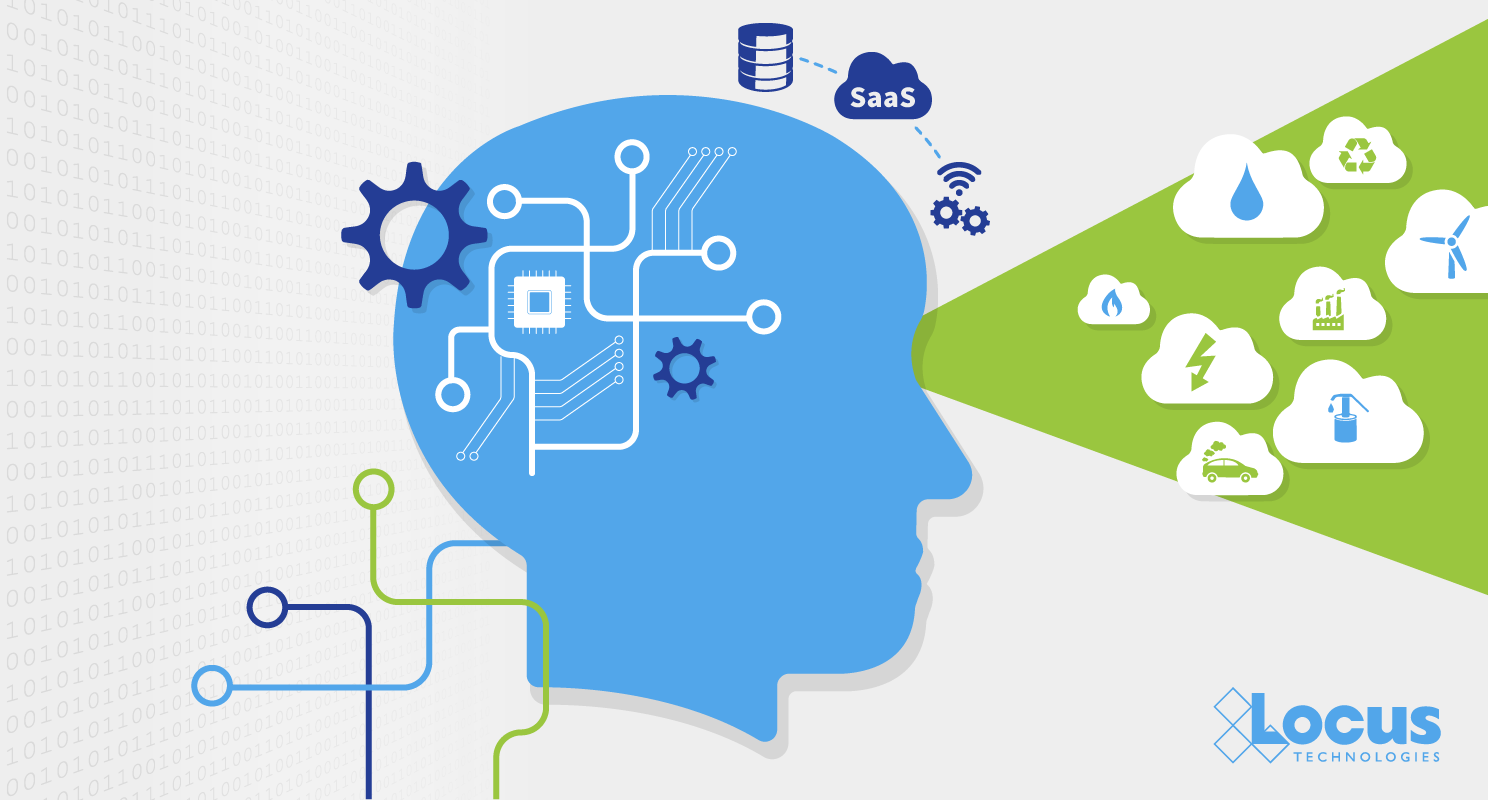
AI and Big Data to Drive EHS Decisions via Multi-tenant SaaS
With data and information streaming from devices like fire hydrants, there is little benefit from raw data, unless a company owning the data has a way to integrate the data into its record system and pair it with regulatory databases and GIS. That is where the advancement in SaaS tools and data sources mashups has helped set the stage for AI as a growing need.
Humans are not very good at analyzing large datasets. This is particularly true with data at the planetary level that are now growing exponentially to understand causes and fight climate change. Faced with a proliferation of new regulations and pressure to make their companies “sustainable” EHS departments keep adding more and more compliance officers, managers, and outside consultants, instead of investing in technology that can help them. Soon, they will be turning to AI technology to stay on top of the ever-changing regulatory landscape.
AI, in addition to being faster and more accurate, should make compliance easier. Companies spend too much time and effort on the comprehensive quarterly or annual reporting—only to have to duplicate the work for the next reporting period. The integrated approach, aided by AI, will automate these repetitive tasks and make it easier than just having separate analyses performed on every silo of information before having a conversation with regulators.
In summary, whether it is being used to help with GHG emissions monitoring and reporting, water quality management, waste management, incident management, or other general compliance functions, AI can improve efficiency, weed out false-positive results, cut costs and make better use of managers’ time and company resources.
Another advantage of AI, assuming it is deployed properly, concerns its inherent neutrality on data evaluation and decision making. Time and time again we read in the papers about psychological studies and surveys that show people on opposite sides of a question or topic cannot even agree on the “facts.” It should not be surprising then to find that EHS managers and engineers are often limited by their biases. As noted in the recent best-seller book by Nobel Memorial Prize in Economics laureate Daniel Kahneman, “Thinking, Fast and Slow,” when making decisions, they frequently see what they want, ignore probabilities, and minimize risks that uproot their hopes. Even worse, they are often confident even when they are wrong. Algorithms with AI built-in are more likely to detect our errors than we are. AI-driven intelligent databases are now becoming powerful enough to help us reduce human biases from our decision-making. For that reason, large datasets, applied analytics, and advanced charting and data visualization tools, will soon be driving daily EHS decisions.
In the past, companies almost exclusively relied upon on-premise software (or single-tenant cloud software, which is not much different from on-premise). Barriers were strewn everywhere. Legacy systems did not talk to one another, as few of the systems interfaced with one another. Getting data into third-party apps usually required the information to be first exported in a prescribed format, then imported to a third-party app for further processing and analysis. Sometimes data was duplicated across multiple systems and apps to avoid the headache of moving data from one to another. As the world moves to the multi-tenant SaaS cloud, all this is now changing. Customers are now being given the opportunity to analyze not just their company’s data, but data from other companies and different but potentially related and coupled categories via mashups. As customers are doing so, interesting patterns are beginning to emerge.
The explosion of content—especially unstructured content—is an opportunity and an obstacle for every business today.
The emergence of artificial intelligence is a game-changer for enterprise EHS and content management because it can deliver business insights at scale and make EHS compliance more productive. There are numerous advantages when you combine the leading multi-tenant EHS software with AI:
Ability to handle the explosion of unstructured content where legacy on-premise EHS solutions can’t.
AI can organize, illuminate, and extract valuable business insights if all your content is managed in one secure location in the cloud.
Locus helps you take advantage of best-of-breed AI technologies from industry leaders and apply them to all your content.
We are seeing in the most recent NAEM white paper, Why Companies Replace Their EHS&S Software Systems, that people want the ability to integrate with other systems as a top priority. Once the ability to share/consolidate data is available, AI is not far behind in the next generation of EHS/Water Quality software.
This concludes the four-part blog series on Big Data, IoT, AI, and multi-tenancy. We look forward to feedback on our ideas and are interested in hearing where others see the future of AI in EHS software – contact us for more discussion or ideas! Read the full Series: Part One, Part Two, Part Three.
https://www.locustec.com/wp-content/uploads/2019/04/locus_graphic_ai_1488x800.png8001488Locus Product Teamhttps://www.locustec.com/wp-content/uploads/2023/12/locus_logo_2x.pngLocus Product Team2019-08-02 05:40:442025-03-17 12:38:06Artificial Intelligence and Environmental Compliance–Revisited–Part 4: AI, Big Data + Multi-Tenancy = The Perfect System
SAN FRANCISCO, Calif., 23 July 2019 — Locus Technologies (Locus), the market leader in multi-tenant SaaS water quality, environmental compliance, and sustainability management, today announced that it is going all-in on Amazon Web Services, Inc. (AWS), moving its entire infrastructure to the world’s leading cloud. By moving its flagship product EIM (Environmental Information Management) to AWS this month, Locus will complete its transition to AWS. Locus previously moved its Locus Platform (LP) to AWS in 2018.
EIM is the world’s leading water quality management software used by many Fortune 500 companies, water utilities, and the US Government since 1999. Among its many features, EIM delivers real-time tools to ensure that water utilities deliver clean water to consumers’ taps and don’t discharge contaminated wastewater above allowable limits to groundwater or surface water bodies like streams, lakes, or oceans.
EIM generates big data, and with over 500 million analytical records at over 1.3 million locations worldwide, it is one of the largest centralized, multi-tenant water quality management SaaS systems in the world. With anticipated growth in double digits stemming from the addition of streaming data from sensors and many IoT monitoring devices, Locus needed to have a highly scalable architecture for its software hosting. The unmatched performance and scalability of AWS’s offerings are just the right match for powering Locus’ SaaS.
Because of the scope of its applications, Locus is expecting to leverage the breadth and depth of AWS’s services (including its database systems, serverless architecture, IoT streaming, blockchain, machine learning, and analytics) to automate and enhance the on-demand EHS compliance, sustainability, facility, water, energy, and GHG management tools that Locus’ software provides to its customers.
Running on AWS’s fault-tolerant and highly performant infrastructure will help support Locus’s everyday business, and will scale easily for peak periods, where reporting demand such as GHG calculation engine or significant emissions incidents like spills can skyrocket scalability demand.
By leveraging Amazon CloudFront, Amazon Virtual Private Cloud (Amazon VPC), Amazon Elastic Kubernetes Service (Amazon EKS) and AWS Lambda, Locus is migrating to a microservices architecture to create more than 150 microservices that independently scale workloads while reducing complexity in the cloud, thereby enhancing every element of the customer cloud experience. Locus built a data lake on Amazon Simple Storage Service (Amazon S3) and will leverage Amazon Redshift to analyze the vast amount of data it is storing in the cloud, delivering insights and predictive analytics that uncover chemicals trending patterns and predict future emissions releases at various locations.
Locus intends to leverage AWS IoT services and Amazon Managed Blockchain by building a new native integration to help businesses generate value from the millions of events generated by connected devices such as real-time environmental monitoring sensors and environmental treatment systems controls. AWS IoT is a set of cloud services that let connected devices easily and securely interact with cloud applications like EIM and Locus Platform and other devices. Locus IoT Cloud on AWS allows customers to experience real-time emissions monitoring and management across all their connected sensors and devices. And for customers who want to allow multiple parties to transact (e.g. GHG trading) without a trusted central authority, AWS provides a fully managed, scalable blockchain service. Amazon Managed Blockchain is a fully managed service makes it easy to setup, deploy, and manage scalable blockchain networks that Locus intends to use for emissions management and trading.
For example, a water utility company that maintains thousands of IoT-enabled sensors for water flow, pressure, pH, or other water quality measuring devices across their dispersed facilities and pipeline networks will be able to use Locus IoT on AWS to ingest and manage the data generated by those sensors and devices, and interpret it in real time. By combining water sensor data with regulatory databases, water utility companies will be able to automatically create an emergency shutdown if chemical or other exceedances or device faults are detected and as such, will be better prepared to serve their customers and environment.
By combining the powerful, actionable intelligence in EIM and rapid responsiveness through Locus Platform with the scalability and fast-query performance of AWS, customers will be able to analyze large datasets seamlessly on arrival in real time. This will allow Locus’ customers to explore information quickly, find insights, and take actions from a greater variety and volume of data—all without investing the significant time and resources required to administer a self-managed on-premises data warehouse.
“After 22 years in business, and after evaluating AWS for a year with our Locus Platform, we decided to switch and continue all our business on AWS. We are taking advantage of their extensive computing power, depth and breadth of services and expertise to develop an effective cloud infrastructure to support our growing business and goal of saving the planet Earth by providing and managing factual information on emissions management, all the while reducing operational costs of Locus’ customers,” said Neno Duplan CEO of Locus. “By operating on AWS, we can scale and innovate quickly to provide new features and improvements to our services – such as blockchain-based emissions management – and deliver exceptional scalability for our enterprise customers. With AWS, we don’t have to focus on the undifferentiated heavy lifting of managing our infrastructure, and can concentrate instead on developing and improving apps and services.”
“By organizing and analyzing environmental, sustainability, and water quality information in the cloud, Locus is helping organizations to understand the impact of climate change on drinking water,” said Mike Clayville, Vice President, Worldwide Commercial Sales at AWS. “AWS’s unmatched portfolio of cloud services, proven operational expertise, and unmatched reliability will help Locus to further automate environmental compliance for companies ranging from local water utilities to multinational manufacturing corporations, to federal government research agencies. ”By choosing to go all-in on AWS, Locus is able to innovate and expand globally, developing new solutions that will leverage comprehensive analytics and machine learning services to gain deeper insights and forecast sustainability metrics that will help deliver clean drinking water to consumers around the world.”
Multi-tenancy offers distinct benefits over traditional, single-tenant software hosting. A multi-tenant SaaS provider’s resources are focused on maintaining a single, current version of the application, rather than having its resources diluted in an attempt to support multiple software versions for its customers. If a provider is not using multi-tenancy, it may be hosting or supporting thousands of single-tenant customer implementations. By doing so, a provider cannot aggregate information across customers and extract knowledge from large data sets as every customer may be housed on a different server and possibly a different version of software. For these reasons, it is almost impossible and prohibitively expensive to deliver modern AI tools via single-tenancy.
Multi-tenancy has other advantages as well. Because every customer is on the same version of the software and the same instance, machine-learning (a prerequisite for building an AI system) can happen more quickly as large datasets are constantly fed into a single system. A multi-tenant SaaS vendor can integrate and deploy new AI features more quickly, more frequently, and to all customers at once. Lastly, a single software version creates more of a sense of community among users and facilitates the customers’ ability to share their lessons learned with one another (if they chose to do that). Most of today’s vendors in the EH&S software space cannot offer AI, sustain their businesses, and grow unless they are a true multi-tenant SaaS provider. Very few vendors are.
AI
Almost 30 years after the publication of our paper on the hazardous data explosion, SaaS technologies combined with other advancements in big data processing are rising to the challenge of successful processing, analyzing, and interpreting large quantities of environmental and sustainability data. It is finally time to stop saying that AI is a promising technology of the future. A recent Gartner study indicates that about 20 percent of data will be created or gathered by computers by 2018. Six billion connected devices will acquire the ability to connect and share data with each other. This alone will fuel AI growth as we humans cannot interpret such massive amounts of data.
Gone are the days where EHS software was just a database. There are two factors that are fueling the adoption of AI technologies for water quality management and EHS compliance. First, there is a vast increase that we have mentioned of data that needs sorting and understanding (big data). Second, there is the move to true multi-tenant SaaS solutions, which enables the intake and dissection of data from multiple digital sources (streaming data) from multiple customers, all in real-time.
AI has entered the mainstream with the backing and advocacy of companies like IBM, Google, and Salesforce, who are heavily investing in the technology and generating lots of buzzes (and we are seeing the consequent talent war happening industry-wide). It is remarkable to observe how quickly AI is proliferating in so many verticals, as CBS’s 60 Minutes segment showed us.
For our purposes, let’s look at where AI is likely to be applied in the EHS space. The mission-critical problem for EHS enterprise software companies is finding solutions that both enhance compliance and reduce manual labor and costs. This is where AI will play a major role. So far, companies have largely focused on aggregating their data in a record system(s); they have done little to interpret that data without human interaction. To address the ever-changing growth in environmental regulations, companies have been throwing people at the problem, but that is not sustainable.
AI and natural language processing (NLP) systems have matured enough to read through the legalese of regulations, couple them with company’s monitoring and emissions data, and generate suggestions for actions based on relevant regulations and data. Take, for example; a CEMS installed at many plants to monitor air emissions in real-time. Alternatively, a drinking water supply system monitoring for water quality. In each of these systems, there are too many transactions taking place to monitor manually to ascertain which ones are compliant and which ones are not? I see no reason why similar algorithms that are used for computerized trading (as described in the recent best-seller “Flash Boys”) to trade stocks in fractions of a second cannot be used for monitoring exceedances and automatically shutting down discharges if there is an approaching possibility of emission exceedance. It is an onerous task to figure out every exceedance on a case-by-case basis. Intelligent databases with a built-in AI layer can interpret data on arrival and signal when emissions exceed prescribed limits or when other things go wrong. The main driver behind applying AI to EHS compliance is to lower costs and increase the quality of EHS compliance, data management, and interpretation, and ultimately, to avoid all fines for exceedances.
For example, a large water utility company has to wade through thousands of analytical results to look for outliers of a few dozen chemicals they are required to monitor to stay compliant. Some of these may be false-positives, but that still leaves some results to be investigated for outliers. Each of those investigations can take time. However, if a software algorithm has access to analytical results and can determine that the problem rests with a test in the lab, that problem can be solved quickly, almost without human interaction. That is powerful.
Combing through data and doing this by hand or via spreadsheet could take days and create a colossal waste of time and uncertainty. Hundreds of billable hours can be wasted with no guaranteed result. Using AI-driven SaaS software to determine what outliers need investigation allows compliance managers, engineers, and chemists to focus their expertise on just these cases and thus avoid wasting their time on the remaining ones that the AI engine indicates need no further examination.
Predictive analytics based on big data and AI will also make customer data (legacy and new) work harder for customers than any team(s) of consultants. A good analogy that came to me after watching 60 minutes is that the same way the clinical center in North Carolina used AI to improve cancer treatment for their patients, engineers and geologists can improve on selecting the site remedy that will be optimized for given site conditions and will lead to a faster and less expensive cleanup with minimum long-term monitoring requirements.
A final example where AI will be playing a role is in the area of enterprise carbon management. SaaS software is capable of integrating data from multiple sources, analyzing and aggregating it. This aggregated information can then be distributed to a company’s divisions or regulatory agencies for final reporting and validation/verification, all in real-time. This approach can save companies lots of time and resources. Companies will be able to access information from thousands of emission sources across the states, provinces, and even countries where their plants are located. Because each plant is likely to have its set of regulatory drivers and reporting requirements, these would have to be incorporated into the calculation and reporting engine. After data from each plant is uploaded to a central processing facility, the information would be translated into a “common language,” the correct calculation formulae and reporting requirements applied, and the results then returned to each division in a format suitable for reporting internally and externally.
Blockchain for EHS—Looking ahead
And finally, another emerging technology, blockchain, will further augment the power of AI for EHS monitoring and compliance. While blockchain is in its infancy, its decentralized approach coupled with AI will bring another revolution to EHS compliance and water monitoring.
Parts one, two, and four of this blog series complete the overview of Big Data, IoT, AI, and multi-tenancy. We look forward to feedback on our ideas and are interested in hearing where others see the future of AI in EHS software – contact us for more discussion or ideas!
https://www.locustec.com/wp-content/uploads/2019/04/locus_graphic_ai_1488x800.png8001488Locus Product Teamhttps://www.locustec.com/wp-content/uploads/2023/12/locus_logo_2x.pngLocus Product Team2019-07-19 06:07:122025-03-17 12:38:07Artificial Intelligence and Environmental Compliance–Revisited–Part 3: Multi-Tenancy and AI
I love the article by Geoffrey Moore on the power of software as a service (SaaS) business model published on LinkedIn. In SaaS’s Real Triumph he writes: “by far the greatest contribution of SaaS is to free the enterprise from the tyranny of the product release model.”
He cites the operational burden, enterprise-wide distraction and associated cost to roll out an enterprise software and then the subsequent hesitation to repeat that when a new release of that software becomes available as that deployment model is not sustainable nor affordable. Companies spend big dollars buying and then deploying EHS software that they know will be outdated in just a few years. Only IT personnel benefits from that model as it may extend their employment for a few years before IT department goes out of business for good. Moore points out the painful truth, stating: “you have paid maintenance of 18 to 20% per year for anywhere from five to ten years for the express purpose of not availing yourself of the innovation created during that time period.”
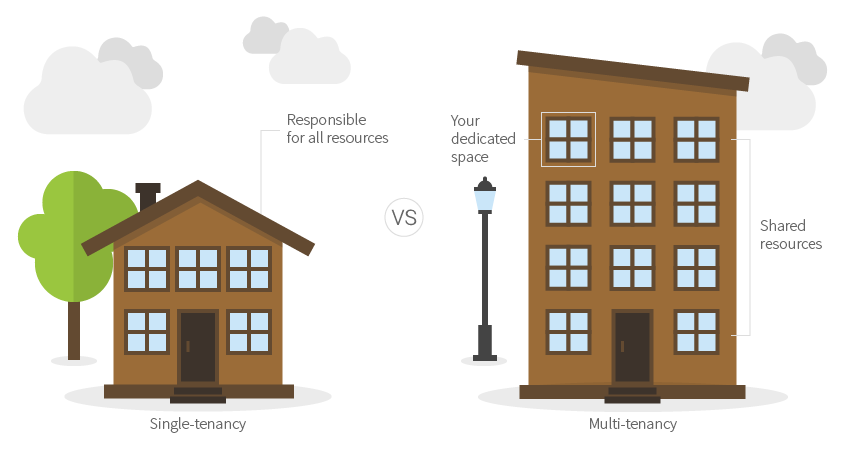
Probably the main benefit of SaaS multi-tenancy (that is frequently overlooked during the software selection process) is no software versioning. This is because multi-tenant software typically provides a rolling upgrade program: incremental and continuous improvements. It is an entirely new architectural approach to software delivery and maintenance model. Companies have to develop applications from the ground up for multi-tenancy. Legacy client-server or single-tenant software cannot qualify for multi-tenancy. Let’s take a look at definitions:
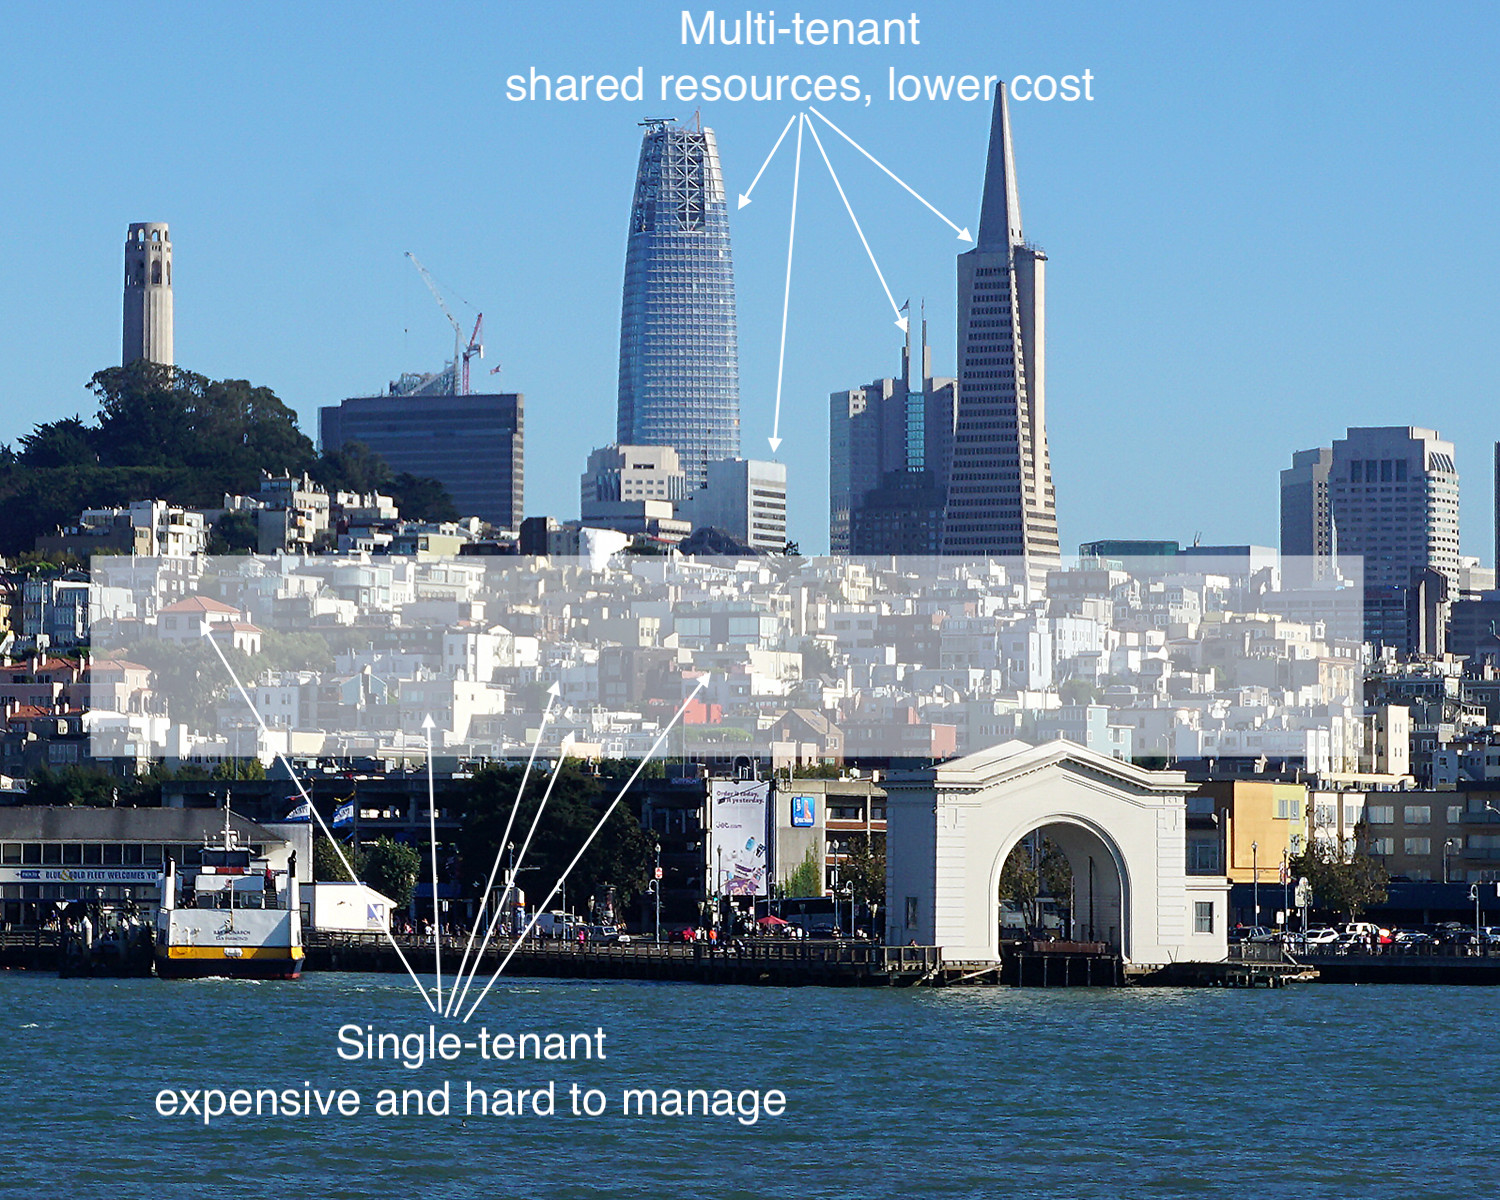
Single-Tenant – A single instance of the software and supporting infrastructure serves a single customer. With single-tenancy, each customer has his or her own independent database and instance of the software. Essentially, there is no sharing happening with this option.
Multi-Tenant – Multi-tenancy means that a single instance of the software and its supporting infrastructure serves multiple customers. Each customer shares the software application and also shares a single database. Each tenant’s data is isolated and remains invisible to other tenants.
Benefits of SaaS Multi-Tenant Architecture
The multi-tenant architecture provides lower costs through economies of scale: With multi-tenancy, scaling has far fewer infrastructure implications than with a single-tenancy-hosted solution because new customers get access to the same software.
Shared infrastructure leads to lower costs: SaaS allows companies of all sizes to share infrastructure costs. Not having to provision or manage any infrastructure or software above and beyond internal resources enables businesses to focus on everyday tasks.
Ongoing maintenance and updates: Customers don’t need to pay costly upgrades to get new features or functionality.
Configuration can be done while leaving the underlying codebase unchanged: Single-tenant-hosted solutions are often customized, requiring changes to an application’s code. This customization can be costly and can make upgrades expensive and time-consuming because the upgrade might not be compatible with customers changes to the earlier software version.
Multi-tenant solutions are designed to be highly configurable so that businesses can make the application perform the way they want. There is no changing the code or data structure, making the upgrade process easy.
Multi-tenancy ensures that every customer is on the same version of the software. As a result, no customer is left behind when the software is updated to include new features and innovations. A single software version also creates a unique sense of community where customers and partners share knowledge, resources, and learning. Smart managers work with their peers and learn from them and what they are doing. A multi-tenant SaaS provider’s resources are focused on maintaining a single, current (and only) version of the application, rather than spread out in an attempt to support multiple software versions for customers. If a provider isn’t using multi-tenancy, it may be hosting thousands of single-tenant customer implementations. Trying to maintain that is too costly for the vendor, and those costs, sooner or later, become the customers’ costs.
A vendor who is invested in on-premise, hosted, and hybrid models cannot commit to providing all the benefits of a true SaaS model due to conflicting revenue models. Their resources are going to be spread thin, supporting multiple versions rather than driving innovation. Additionally, if the vendor makes the majority of their revenue selling on-premise software, it is difficult for them to fully commit to a true SaaS solution since the majority of their resources are allocated to supporting the on-premise software.
Before you engage future vendors for your enterprise EHS software, assuming you already decided to go with SaaS solution, ask these questions:
Does your software have version numbers?
Do you charge for upgrades and how often do you upgrade?
If the answer is yes to any of these two questions, you should not consider that vendor as they are not true multi-tenant SaaS. You should not select that vendor if they answer “we are in the process of switching to multi-tenancy.” Multi-tenancy train departed a long time ago, and no EHS vendor who is single-tenant is not going to make that switch in time to make it work.
And if they suddenly introduce a “multi-tenant” model (after selling an on-premises version for 10+ years) who in the world would want to migrate to that experimental cloud without putting the contract out to bid to explore a switch to well established and market-tested true multi-tenant providers? The first-mover advantage when it comes to multi-tenancy is a huge advantage for any vendor.
https://www.locustec.com/wp-content/uploads/2018/12/multi-tenant-2.png9471185Neno Duplanhttps://www.locustec.com/wp-content/uploads/2023/12/locus_logo_2x.pngNeno Duplan2019-07-08 06:41:032025-03-17 12:38:07Does your EHS software have a version number?
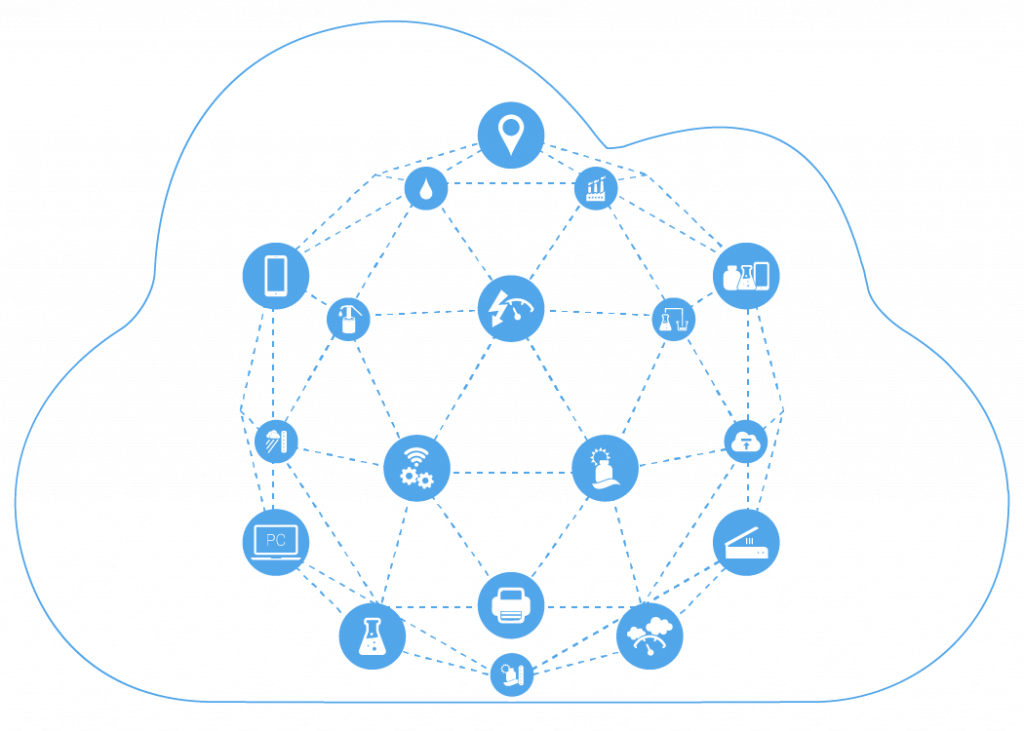
More recently, big data has become more closely tied to IoT-generated streaming datasets such as Continued Air Emission Measurements (CEMS), real-time remote control and monitoring of treatment systems, water quality monitoring instrumentation, wireless sensors, and other types of wearable mobile devices. Add digitized historical records to this data streaming, and you end up with a deluge of data. (To learn more about big data and IoT trends in the EHS industry, please read this article: Keeping the Pulse on the Planet using Big Data.)
In the 1989 Hazardous Data Explosionarticle that I mentioned earlier, we first identified the limitation of relational database technology in interpreting data and the importance that IoT (automation as it was called at the time) and AI were going to play in the EHS industry. We wrote:
“It seems unavoidable that new or improved automated data processing techniques will be needed as the hazardous waste industry evolves. Automation (read IoT) can provide tools that help shorten the time it takes to obtain specific test results, extract the most significant findings, produce reports and display information graphically,”
We also claimed that “expert systems” (a piece of software programmed using artificial intelligence (AI) techniques. Such systems use databases of expert knowledge to offer advice or make decisions.) and AI could be possible solutions—technologies that have been a long time coming but still have a promising future in the context of big data.
“Currently used in other technical fields, expert systems employ methods of artificial intelligence for interpreting and processing large bodies of information.”
Although “expert systems” as a backbone for AI did not materialize as it was originally envisioned by researches, it was a necessary step that was needed to use big data to fulfil the purpose of an “expert”.
AI can be harnessed in a wide range of EHS compliance activities and situations to contribute to managing environmental impacts and climate change. Some examples of application include AI-infused permit management, AI-based permit interpretation and response to regulatory agencies, precision sampling, predicting natural attenuation of chemicals in water, managing sustainable supply chains, automating environmental monitoring and enforcement, and enhanced sampling and analysis based on real-time weather forecasts.
Parts one, three, and four of this blog series complete the overview of Big Data, IoT, AI and multi-tenancy. We look forward to feedback on our ideas and are interested in hearing where others see the future of AI in EHS software – contact us for more discussion or ideas!