Natural Gas Usage Up with Leaky Consequences

Environment challenge: Use a cleaner resource without environmental impact.  The reality, even good environmental intentions produce by-products and/or have risk than need to be monitored. Check out this insightful article about natural gas.

Fact: Natural gas now produces 27 percent of the electricity generated in the United States, and the percentage is rising. Natural gas is cleaner than coal and at a lower price point.  But as with all energy producing resources, there is an enemy and in this case, the arch enemy is methane. What is worse, it is leaky. The New Times Editor, John Schwartz, digs in deep of the issues, long term implications, political policies, and environmental impact of natural gas.

Using the New 4K Display Technology Could Be a Disruptive Catalyst for New Environmental-based Solutions

The recent Consumer Electronics Show (CES) unleashed a plethora of new products to improve the daily lives of consumers. One product that caught my environmental eye was the Hewlett-Packard HP Zvr. ZDNet describes the new hologram-based screen as a step toward “true holographic viewing”.
The reporter, Larry Dignan, goes on to say “a test drive of the display was notable, because it allowed you to manipulate content, dissect frogs, inspect the inner workings of the heart and play with architecture options.” I have personally not seen the display, but the idea of inspecting the inner workings of the heart got me dreaming of environmental-based solutions. Could 3D (in this case, 4K screen technology) be used to view underground contamination of water aquifers?   Imagine using 4K imagery, coupled with analytical data of water chemistry in our EIM system, add smartphone-delivered real-time field data plus smart apps and you have a complete and unique turnkey environmental package. Compliant heavy industries initially would benefit most, as they could finally collect previous unattainable data as well as display an accurate picture of contaminants and their impact on environment. Is a fully-integrated visual environmental 4K real time application in the future? One observation is certain, the rate of technology innovation, and more importantly, the rate of adoption, over the past 10 years surpasses even the wildest imagination.

Decommissioning of Nuclear Power Plants to Exceed $100 Billion, Less Than Decommissioning of Oil Offshore Platforms

The cost of decommissioning nuclear reactors that will be closed around the world between now and 2040 will top $100 billion, according to the latest annual report by the International Energy Agency (IEA). For comparison, decommissioning just North Sea oil and gas facilities is projected to cost about $70 billion over the next 25 years.
The report notes that, of a total of about 200 nuclear reactors now operating globally, about 38% of those will be shut down over the next 25 years,. About 44% of these reactors are in the European Union (EU) nations, another 16% are located in the United States, and 12% are in Japan. IEA warned that governments and their energy agencies have little experience in the craft of decommissioning—only 10 reactors have been decommissioned over the last 40 years so the report’s estimates of the ultimate costs must be regarded as a minimum level of expenditure. The estimate does not take into account the need to construct facilities to store the waste that’s accumulating at these facilities, according to Fatih Birol, IAE’s chief economist, who added that, 60 years after the first nuclear power plant started up operations, no country has yet built a permanent disposal facility for high-level nuclear waste.

Hydrofracking Wastewater Treatment Market to Triple

Hydrofracking wastewater treatment market to triple

The U.S. market for treating produced water and flowback water generated during the process of hydrologic fracturing, or “fracking,” in oil and gas production will increase substantially from $138 million in 2014 to $357 million in 2020, according to a recent report by Bluefield Research (Boston, MA).

The report finds that, overall, the U.S. oil and gas industry will spend $6.38 billion in 2014 on water management, including water supply, transport, storage, treatment, and disposal. The transport and disposal components will account for 66% of the total costs, while treatment will only constitute 2% of that expenditure this year, but treatment will gain as the industry requires more reuse of its wastewater. The “fracking” industry has been a kind of “wild west” for the U.S. water industry, according to Bluefield analyst Reese Tisdale, because of the explosive build-out of fracking wells, the lack of clear regulation of water management in key markets, and the absence to date of a consistent method for treating the wastewater.

California’s Water Shortage

A new paper published in Nature Climate Change, by NASA water scientist James Famiglietti, presents the chilling reality of California’s ongoing drought crisis. “The Global Groundwater Crisis,” uses satellite data to measure the depletion of the world’s aquifers, and summarizes the effects this has on the environment.

These aquifers contain groundwater that more than 2 billion individuals rely on as their primary source of water. Groundwater is also essential, as it is one of the main sources we rely on to irrigate food crops. In times of drought, the lack of rain and snow results in less surface water (the water that settles in lakes, streams, and rivers). Thus, farmers must rely on available groundwater to irrigate their crops, leading to rapid depletion in areas of high farming concentration.

California’s Central Valley has been one of the most effected regions in the state. The map below depicts groundwater withdrawals in California during the first three years of the state’s ongoing drought.

According to James Famiglietti, “California’s Sacramento and San Joaquin river basins have lost roughly 15 cubic kilometers of total water per year since 2011.”  That means “more water than all 38 million Californians use for domestic and municipal supplies annually—over half of which is due to groundwater pumping in the Central Valley.”

As more water is pumped from the aquifers, things can only get worse. As this trend continues, wells will have to be dug deeper, resulting in increased pumping costs. This, in turn, will lead to a higher salt contents, which inhibits crop yields and can eventually cause soil to lose productivity altogether. Over time, Famiglietti writes, “inequity issues arise because only the relatively wealthy can bear the expense of digging deeper wells, paying greater energy costs to pump groundwater from increased depths and treating the lower-quality water that is often found deeper within aquifers.” This problem is already apparent in California’s Central Valley.  Some low-income residents are forced to let their wells go dry, while many other farmers are forced to irrigate with salty water pumped from deep in the aquifer.

The lesson we can learn from Famiglietti’s research is that “Groundwater is being pumped at far greater rates than it can be naturally replenished, so that many of the largest aquifers on most continents are being mined, their precious contents never to be returned.”  This problem of diminishing groundwater is perpetuated, due the lack of forethought, regulation, or research concerning this water source. Famiglietti contends that if current trends hold, “groundwater supplies in some major aquifers will be depleted in a matter of decades.”

Without any change of practices, we can expect steeper droughts and more demand for water. Famiglietti suggests that if we ever plan on getting the situation under control, we must start carefully measuring groundwater and treat it like the precious resource that it is. However, if the globe continues on this path without any adjustment, it will most likely result in civil uprising and international violent conflict in the water-stressed regions of the world.

NASA now says massive methane cloud over U.S. Southwest is legitimate

Several years ago, NASA scientists discovered a cloud of methane gas over the Four Corners of the American southwest that measured about the size of Delaware. The unusually high readings were dismissed then; however, a new study today confirms that the methane hot spot is legitimate.

“We didn’t focus on it because we weren’t sure if it was a true signal or an instrument error,” said NASA research scientist Christian Frankenberg, who works in NASA’s Jet Propulsion Laboratories in Pasadena, California.

The Christian Science Monitor website states that a 2,500 square mile methane cloud over the region where Colorado, Utah, New Mexico, and Arizona connect traps more heat in a 1-year period than all of Sweden’s annual carbon dioxide emissions.

To provide an overview of gases that endanger the Earth’s atmosphere, methane gas is the most powerful of the greenhouse gases. Carbon dioxide is another greenhouse gas, and is more abundant in our atmosphere. However, methane is more effective at trapping heat in the atmosphere than carbon dioxide.

A new study published 10 October 2014 in the journal Geophysical Research Letters takes a look at the data discovered several years ago and confirms what we now know to be North America’s largest methane hot spot. According to lead author of the study, Eric Kort, a professor of Atmospheric, Oceanic, and Space Sciences at the University of Michigan in Ann Arbor, Michigan, the source of the methane is from extensive coal mining activity in the San Juan Basin. According to Kort, the Basin is “the most active coalbed methane production area in the country.”

There has been a notable increase in fracking in that region. Both Kort and Frankenberg believe that the earlier coal mining is most likely to blame for the methane cloud.  From 2003 to 2009, the study shows there were 0.59 million metric tons of methane released each year — 3.5 times more than previous estimates.

According to Kort, “The results are indicative that emissions from established fossil fuel harvesting techniques are greater than inventoried. There’s been so much attention on high-volume hydraulic fracturing, but we need to consider the industry as a whole.”

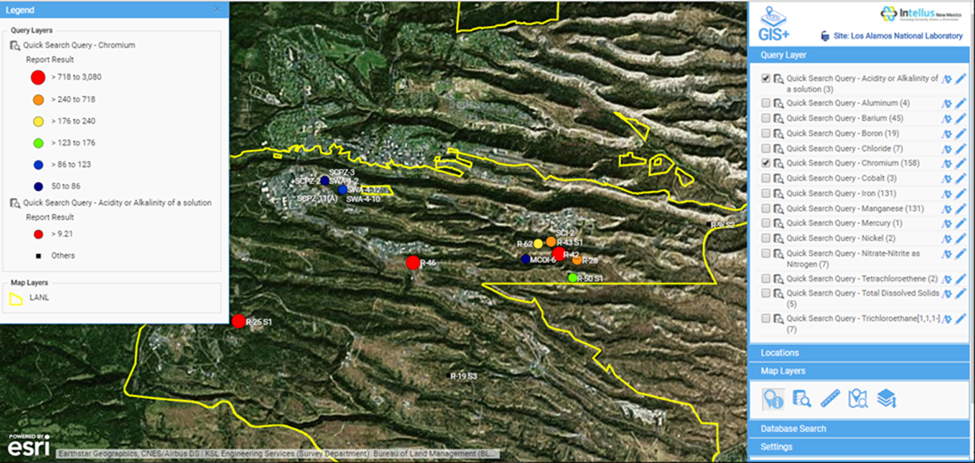
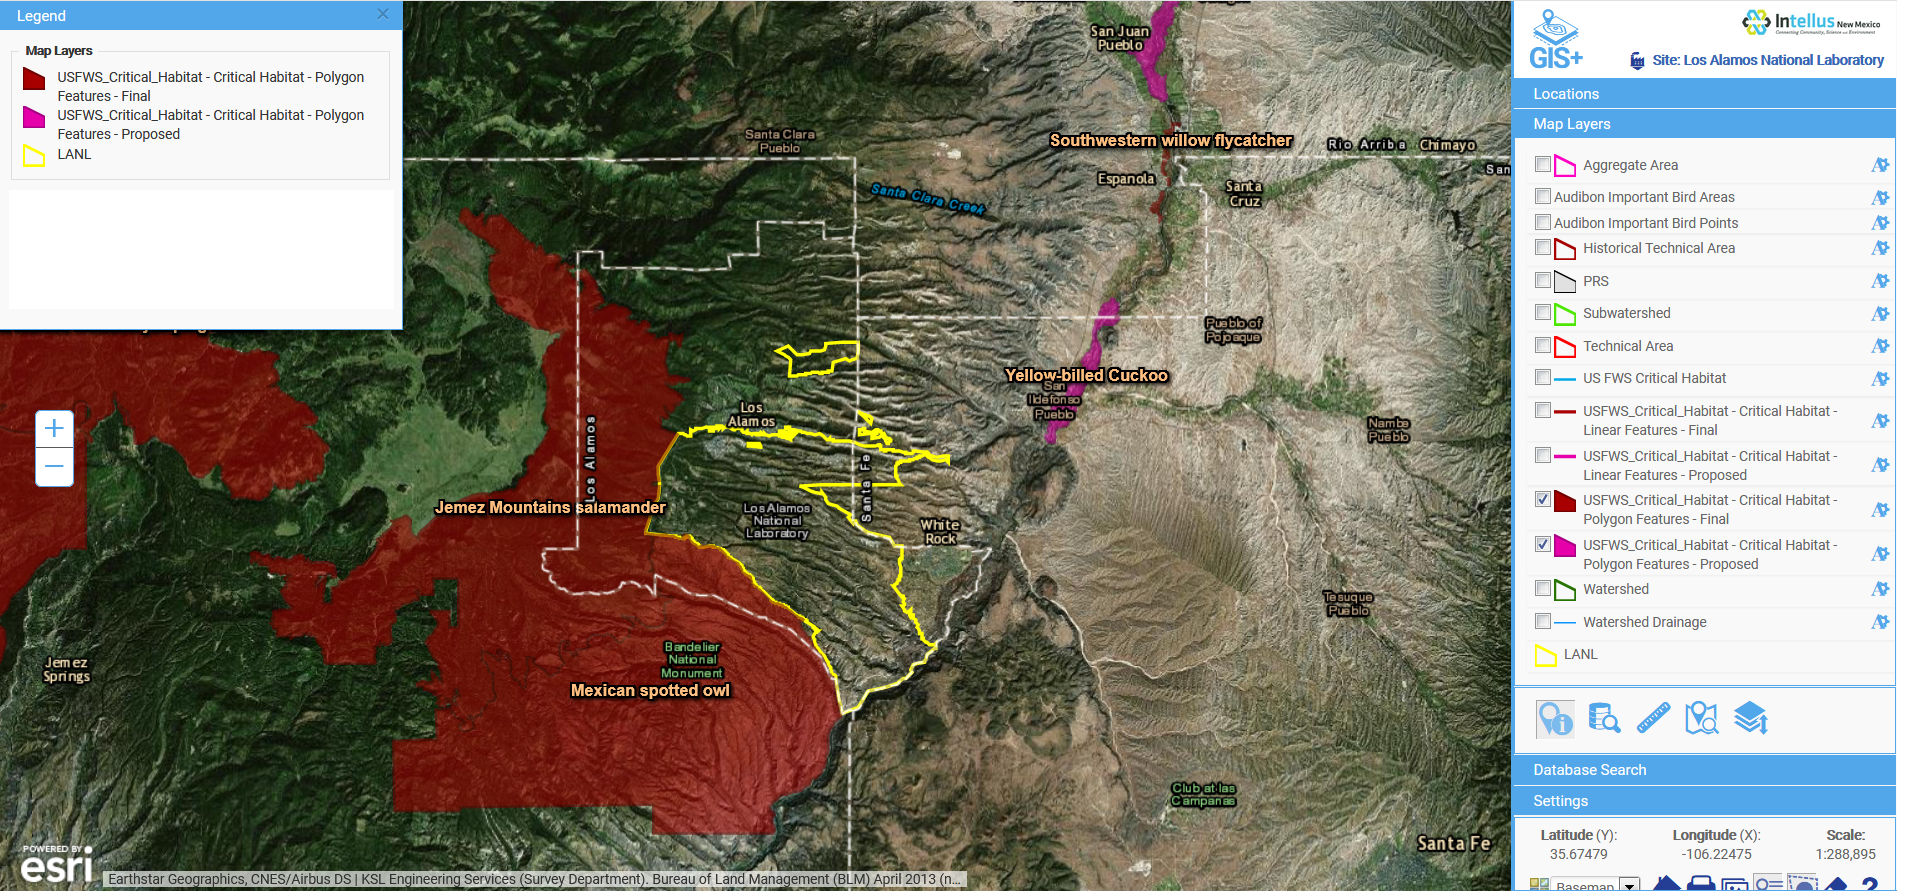
Locus’ Intellus Promotes Big Data Transparency: More Than 14 Million Environmental Sampling Records from National Laboratory Are Now Available Online

Previously contained in a dozen independent databases, the integrated records of Los Alamos National Laboratory (LANL) — are now stored in one location, the publicly-accessible website Intellus.

Through the Locus EIM platform public facing website, Intellus, the general public can now access remediation and environmental data records associated with the Office of Environmental Management’s (EM’s) legacy nuclear cleanup program.

Containing more than 14 million records, Locus’ Intellus has consolidated Los Alamos National Laboratory’s (LANL’s) information that was previously handled in multiple independent databases. The centralized, cloud-based solution directly attributed to an estimated $15 million in cost savings for LANL through 2015.

The public facing site also ensures users have real-time access to the most recent data. The same data that scientists and analysts use to base important environmental stewardship decisions off of. Through tools and capabilities such as automated electronic data validation, interactive maps, and the ability to include data from other third-party providers and environmental programs, Intellus provides the ultimate platform to view LANL’s environmental data without compromising the core EIM system that LANL scientists use on a daily basis.

Locus has always advocated for the power of data transparency via the cloud. When you apply the most extensive security protocols to a cloud-based system, it can be a winning combination for data management and public trust.

Fukushima Water Cleanup Deadline Unlikely to be Met

According to recent calculations by Bloomberg News, Tokyo Electric Power Co. (Tepco) is unlikely to meet its March 2015 deadline to complete the filtering of cancer-causing radioactive isotopes at its wrecked nuclear plant in Fukushima.

Tepco’s President, Naomi Hirose, made a commitment to Prime Minister Shinzo Abe in September of last year to remedy the contamination of groundwater their plant has caused. Bloomberg estimates suggested that filtering out the isotope strontium, which has been linked to leukemia, from the stored water will take more time than they have left with the set deadline.

Spokeswoman Mayumi Yoshida stated earlier this month that Tepco can, “only say we’ll make efforts to achieve that target” of reaching their goal of decontamination before the deadlines that are less than a year away.

The prolonging of the cleanup process has other implications as well, including an extension on a South Korean ban on Japanese seafood imports, and an increased demand in the U.S. for an international takeover of the cleanup process. While the implications of not completing the cleanup on time have not yet been discussed, Tepco is continually seeking ways to remedy the after effects of the March 11, 2011 accident.

The levels of toxic waters are continually rising at a rate of 400,000 liters per day, and as of July 29, the site was said to have more than 373,000,000 liters of radioactive water still needing treatment. With numerous failed attempts at reducing the amount of irradiated water released, Tepco’s ability to reach the deadline is looking incredibly bleak, but Yoshida reassures, “we are doing everything we can do.”

Years later we are once again being reminded of the Fukushima crisis and the magnitude of its effects. Just as it was discussed in the aftermath of the incident, the assistance of a cloud-based, centralized data management system could help to take action on the cleanup. With today’s technology it is possible to store relevant data in a system that is accessible to all stakeholders, supplies a way to continuously monitor and analyze levels of isotopes, and offers opportunities to make better decisions and improve safety at nuclear power plants.

Del Monte Plans & Cans its Way Toward a Sustainable Future

7 August 2014 — If you’ve ever opened a can of peaches or green beans, there’s a good chance it was marked with the red and yellow Del Monte Quality shield. After all, Del Monte Foods is one of the country’s largest and most well-known producers, distributors, and marketers of branded food products—namely canned fruits and vegetables—for the U.S. retail market.

These cans of produce eventually appear on the shelves of supermarkets across the country and end up in our shopping carts—but what happens before they make it there?

Today’s consumers are more invested than ever in discovering the details of how products come to be. This includes what natural resources are used, how much of each is expended, and what environmental impacts are a result of the production process. Curiosity seems to be especially piqued when it comes to the food and agriculture sector, and Del Monte is an example of a company who has chosen to address these questions, as well as offer a roadmap for future improvements.


The Sustainable Dream
Del Monte clearly states that its process of bringing food to our dinner tables is grounded in a deep respect for natural resources. The company works to ensure the delivery of its products is done in the most sustainable way possible, by striving to reduce its operational environmental footprint through the elimination of waste and minimization of materials, energy, and water used.

Toward what was arguably the beginning of the sustainability craze, Del Monte established a baseline year of 2007 with a target year of 2016 to effectively monitor its environmental key performance indicators (KPIs). The company made a commitment to corporate responsibility, and began to track energy, water and waste KPIs, conduct lifecycle assessments, practice LEAN techniques at their 14 facilities, and analyze their supply chain greenhouse gas footprint.


Software Lends a Helping Hand
In the beginning, Del Monte ran into a few challenges along the road to making sustainable improvements. At the time, the company’s sustainability program was experiencing problems with data validation, and was still manually creating reports by exporting data to spreadsheets.

In order to simplify reporting and ensure the quality of its data, Del Monte made the decision to use the latest advancements in technology to manage and report the metrics behind its sustainability goals, and implemented Locus’ sustainability software. Del Monte discovered that Locus’ cloud-based system was configurable, thus making it more relevant to the company’s business and providing closer access to its environmental data.

Locus helped Del Monte discover where errors existed in its historical data, which were then fixed and migrated to the software platform. Existing data validation steps and notifications were configured to fit Del Monte’s timelines and processes to ensure the quality of the data. Within the software, each user was given a dashboard that they could customize to their site’s sustainability needs, allowing them to see important data immediately upon login, and easily create standard reports. Users were also able to create graphs and tables across all sites within their business unit, and compare these to corporate trends—therefore achieving their goal of making data more transparent within the company.

Sometimes an essential aspect to achieving your sustainability goals is knowing when to enlist outside assistance. Important business decisions are based off of data collected and unfortunately, human error is usually inevitable. Taking advantage of the latest technology and built-in validation checks means attaining flawless data quality, and thus ensuring strong and accurate business decisions. Also, making data transparent—meaning easily searchable and accessible—is important to show you are meeting all expected regulations and business-specific goals. Doing all sustainability tracking, management, and reporting in one central, cloud-based system is a solid method for improving data transparency. From this system, it is possible to:

  • Track industry-specific and business-specific KPIs including GRI indicators
  • Review and approve data according to business-specific work flow requirements
  • Compare parameters across sites or against other related parameters
  • Generate trend charts on the web and create reports to track impact
  • Set periodic benchmark goals and track performance against these goals


From Dream to Reality: Visualizing Progress
Over the past seven years Del Monte has been continuously working to tackle its environmental sustainability goals across the various operational steps that result in bringing its products to consumers: from processing, to packaging, to distribution. With the assistance of Locus’ software, Del Monte has created uniform sustainability reports across all sites. Reporting and graphing capabilities help the company view trends in its data more quickly and reliably; data can be easily compared from month to month in order to view recent headway.

Del Monte currently uses Locus’ software for analysis of natural resource to cost, and to manage its various sustainability metrics in order to reach its objectives, such as conservation goals (water and electricity reduction), waste audits, and waste diversion goals. For example, in 2007, Del Monte was approximately 40 percent in waste diversion. With the use of Locus’ sustainability tracking, reporting, and charting functions, Del Monte was more equipped to better manage their progress and reach an 80 percent solid waste diversion rate.

One day at a time, with the help of Locus’ software tools, Del Monte is steadily charging ahead to achieve the sustainability goals it set seven years ago. So the next time you pick up a can of Del Monte produce from the shelf, take comfort in knowing it was produced with an unwavering appreciation for the environment and its resources.

Companies Make Strides Toward Enforcing Oil Spill Prevention Plans

In recent years, the Environmental Protection Agency (EPA) has become much more vigilant about oil spill regulation—regardless of the spills origin. After a series of inspections over the past two years, the EPA announced seven New England companies who have all created or updated their spill prevention plans to be in compliance with federal oil pollution prevention laws.

The companies, who all store or distribute oil, agreed to pay fines under an expedited settlement program, their penalties ranging from $3,000 to $9,500. This expedited program allows companies to pay reduced penalties if they quickly correct violations against the Oil Pollution Prevention regulations. These companies also were required to have a certain minimum storage capacity with no accompanying spill in order to qualify for these reduced fines.

The EPA’s Spill Prevention, Control and Countermeasure (SPCC) rules designate certain requirements for oil spill prevention, preparedness, and response to prevent oil discharges into navigable waters and adjoining shorelines. These rules call for facilities to adhere to guidelines pertaining to their ability to prepare, amend and implement SPCC Plans.

For many companies, complying with these regulations created by the EPA requires an additional focus on detailed actions in SPCC procedures.  Often times tracking and reporting spills if and when they occur—along with the root causes and inspection findings—can be a significant challenge without the appropriate management tools. However, when properly prepared, abiding by these necessary SPCC rules will ensure that organizations stay within compliance, thus avoiding fines and penalties and any harsh effects on our environment.