Locus Technologies Unveils Expansion of its Water SaaS to Produced Water Management for the Oil and Gas Industry
SAN FRANCISCO, Calif., Jan. 16, 2024 — Locus Technologies, (Locus), the pioneer in water, Environmental, Health, and Safety (EHS) compliance and Environmental, Social, and Governance (ESG) software solutions, announces expansion of its water management SaaS platform to include management of produced water within the oil and gas industry. This cutting-edge solution, seamlessly integrated with Locus’ suite of applications, underscores the company’s unwavering commitment to driving sustainable practices while optimizing operational efficiency.
Locus has engineered a comprehensive application designed specifically for the efficient and sustainable management of produced water. This latest addition to Locus’s suite of water solutions aims to address the complex demands of the oil and gas industry while ensuring compliance, conservation, and operational excellence.
The new application is seamlessly interoperable with other Locus solutions catering to the oil and gas sector, such as ESG, air emissions, waste management, and water quality management. Locus software empowers organizations to make informed decisions, mitigate risks, and enhance overall efficiency across their operations by streamlining data integration and providing actionable insights.
Locus’ CEO, Neno Duplan, emphasized the company’s dedication to delivering comprehensive water management solutions while driving advancements in technology for the beneficial reuse of water beyond the realms of the oil and gas, and energy industries. “We remain focused on delivering comprehensive water management solutions to our customers while advancing technologies for the beneficial reuse of water inside and outside of the oil and gas industry, which holds the promise of further improving the sustainability of our customer’s operations,” stated Duplan.
With a proven track record in providing leading-edge EHS and ESG software solutions, Locus continues to spearhead advancements in compliance, sustainability, and corporate responsibility across diverse industries and geographies.
About Locus Technologies
Locus Technologies, the global environmental, social, governance (ESG), Sustainability, and EHS Compliance software leader, empowers companies of every size and industry to be credible with ESG reporting. From 1997 Locus Technologies pioneered enterprise software-as-a-service (SaaS) for EHS Compliance, water management, and ESG credible reporting. Locus apps and software solutions improve business performance by strengthening risk management and EHS for organizations across industries and government agencies. Organizations ranging from medium-sized businesses to Fortune 500 enterprises, such as Chevron, Sempra, Corteva, DuPont, Chemours, San Jose Water Company, The Port Authority of New York and New Jersey, Port of Seattle, Onto Innovations, and Los Alamos National Laboratory, have selected Locus.
Locus Technologies’ headquarters is in Mountain View, California.
For further information regarding Locus Technologies and its commitment to excellence in SaaS solutions, please visit www.locustec.com or email info@locustec.com.
Retire Your Environmental Paper Forms & Go Digital
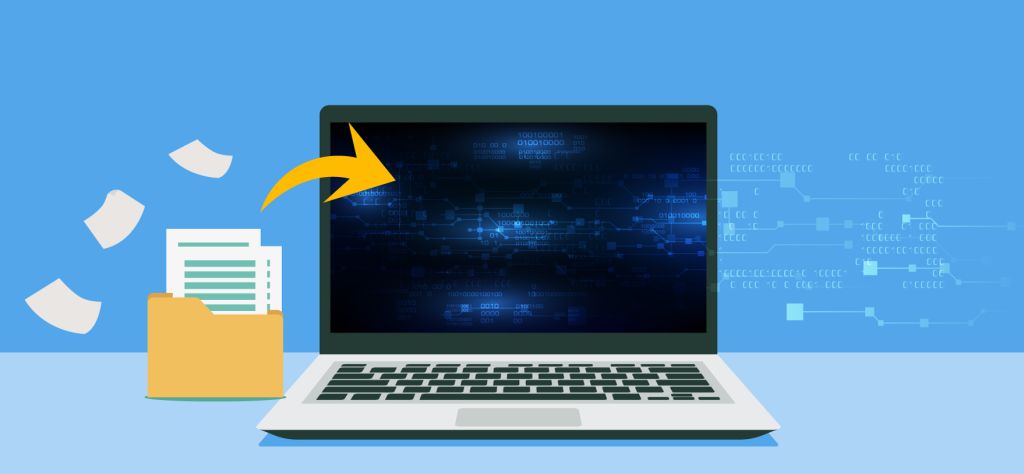
I am constantly reminded by the number of calls we receive, that no matter how robust a SCADA and HMI system is, there is always a requirement for in-field O&M verifications and documentation. It’s almost universal and spans a myriad of industries, large and small, the need to monitor and record thousands of periodic (daily/per shift/weekly, etc.) routine readings/recordings at a prescribed frequency often recorded on pen to paper field forms. The same processes sometimes use “template” spreadsheets for data collection that are then emailed/placed on shared file servers or otherwise sent to some central location for review and post-processing. These processes are antiquated and subject to data quality and record-keeping challenges.
It’s time for an upgrade!
Electronic forms are great for collecting data and almost every business entity has built such forms in spreadsheets, word processing, or simple databases to collect the information. In addition, there is a software category of form builders, and they can certainly build forms. The question becomes is it a good fit to solve your business process issues?
Most customers have more sophisticated needs than simply collecting information on one or more custom forms – they want to do something with all the information collected far beyond what simple form builder tools can provide. Even customers with sophisticated spreadsheet forms, can’t manage them as they multiply exponentially or their Excel gurus retire.
Here are some examples of where you may require software tools beyond a simple form builder:
- Collecting equipment readings on each shift at multiple locations and reporting the data to centralized management, who review the data, and look for trends/issues.
- Verifying and validating data at the point of data entry to eliminate data entry errors.
- Automatically visualizing (charts or tables) information in near real-time to make operations decisions.
- Sharing the information with others.
- Scheduling activities related to periodic or infrequent data collection events.
- Receiving notifications when actions are due.
- Automatically creating regulatory reports in prescribed formats.
- Creating complex workflows and audited approval processes.
- Creating intelligent forms with calculations based on past data or other criteria.
Locus Platform is a configurable platform with standard applications that are easy to configure to customers’ unique requirements. One of its many strengths is its powerful form builder capable of creating simple or complex forms with simple or sophisticated logic. So, for customers looking to move from paper and spreadsheet templates, it’s an excellent option to consider, especially if you require more than a simple “fill in the blank” form for transmittal using mobile devices. Best of all, the data are securely stored in a database structure for reporting and alternative business uses and analyses, compared to the almost impossible management of hundreds of spreadsheets or paper forms.
Here are some examples where sophisticated forms are integrated with a flexible database:
- Water Utilities – Tracking chlorination and aerobic digestion processes with daily inputs/outputs with a monthly summary and chart and tracking well production across well fields.
- Water Utilities – Tracking periodic sewer discharges and water samples for permit compliance.
- Agriculture – Monitoring food processing equipment for compliance with optimum equipment opeating parameters for air permits.
- Pharmaceutical/Chemical Manufacturing Facilities – Tracking EHS daily, weekly, monthly, etc. investigations and in-house audits.
- Universities – tracking chemical inventories.
- Facility Engineering – Documenting O&M activities for groundwater treatment systems.
- Electric Utilities – Monitoring water/energy/gas usage from old-style meters for sustainability reporting with data entry validation.
- Refineries and Terminals – Collecting O&M, usage, and wastewater data.
If you still rely on paper forms and template spreadsheets and are ready to streamline your process and enhance the value of your data, give us a call and we can show you a range of options that will retire the paper forms for good!
Efficient EHS Reporting For the Oil and Gas Industry
When looking for a GHG reporting program, there is one element that is typically overlooked. This short video gives us more insight.
Foster Farms Selects Locus Technologies EHS/ESG Enterprise SaaS
Locus EHS/ESG Cloud will streamline Foster Farms EHS Compliance, ESG Reporting, and Water Quality Management.
MOUNTAIN VIEW, Calif., May 2, 2023 — Locus Technologies, the leading EHS Compliance and ESG software provider, today announced that Foster Farms, a top US provider of fresh, frozen, and prepared poultry products and the leading brand of fresh chicken in the Western U.S., selected Locus’s award-winning enterprise Software as a Service (SaaS) to organize and manage their EHS compliance and ESG reporting.
Foster Farm subscribed to an integrated set of apps offered in the Locus Cloud Platform. Some apps include EHS Compliance Management, ESG and Sustainability, GHG Emission Factor and Calculation Management, Inspections, Configuration Workbench, Air Emissions Management, Storm Water, Wastewater, and well data management and reporting.
Locus Cloud is the first fully integrated multitenant platform created from the ground up to allow organizations to manage their environmental, energy, water, waste, carbon, air, health and safety, remediation, water quality, and compliance information in one place. The Locus Platform allows companies to configure their own management, tracking, visualization, and reporting through a graphically driven user interface. This feature enables organizations to configure the software to their needs without worrying about the expensive programming outlays usually associated with customization and single-tenant deployments.
When designing integrated EHS/ESG SaaS, Locus sought to make the complicated workflow and management of environmental data as simple as possible and to make it manageable from a single platform with shared components. The resulting platform offers immense flexibility and endless capabilities with minimal training thanks to the new, intuitive, user-friendly interface design.
“The accurate tracking and reporting of critical environmental resource usage is a necessary part of our compliance responsibilities, and a major component of our efforts to ensure that we are a sustainable producer. The Locus application software will make a significant contribution to our resource management capabilities,” said Don Hill, Foster Farms Director of Environmental Affairs.
“We are delighted that Foster Farms recognized the power of the Locus Cloud platform. Businesses do not want to shop for point solutions from different vendors only to be left with the nightmare of integration, security, synchronization, and vendor management. They want one-stop shops and to avoid having to deal with vendors that don’t integrate well with one another or have spotty service and limited support. Locus will provide Foster Farms single platform through which they can accomplish all their environmental and compliance management needs on a single, fully customer-configurable platform,” said Neno Duplan, President, and CEO of Locus. “Keeping the end user’s perspective in mind, we’ve packed the same 26-plus years of domain expertise that Locus has been offering all along into a highly configurable and scalable software platform built from the ground up on the latest web technologies,” remarked Duplan.
ABOUT FOSTER FARMS
Foster Farms is dedicated to providing families across America with great food. From ready to cook chicken and turkey, to chicken nuggets and corndogs, Foster Farms portfolio of fresh, frozen, and prepared foods, are always welcome whether it’s dinner time or snack time. Since its founding in 1939 Foster Farms has gone on to become one of the largest quality poultry producers in the United States. Headquartered in Livingston, Ca with facilities in California, Oregon, Washington, Colorado, Arkansas, Alabama and Louisiana, the company has nearly 12,000 Team Members, and is committed to building a “culture that nobody wants to walk aways from.”
Locus Technologies Receives 17th Consecutive EBJ Award for Information Technology in ESG
Environmental Business Journal (EBJ) recognized Locus for ESG software growth and innovation.
MOUNTAIN VIEW, Calif., 2 March 2023 — Locus Technologies, the leading EHS Compliance and ESG software provider, received their 17th consecutive award from Environmental Business Journal (EBJ) for growth and innovation in the field of Information Technology in the environmental software with particular focus on EHS, compliance, sustainability, and ESG.
Locus continues to expand its ESG SaaS solution, including built-in business intelligence tools for interactive, actionable insights into unified EHS compliance and ESG data, forecasting tools predicting future ESG reporting, APIs for utility data sources, and interfaces with third-party systems that house ESG data. Locus’s ESG solutions focus on “enter once, report to many.” enabling companies the efficiency of reporting to multiple organizations and numerous standards from a single dataset. Essential built-in reporting includes state or federal regulations and ESG based on standards, including CDP, GRI, SASB, TCFD, and many others.
“Locus’s pioneering work in integrated ESG reporting and EHS compliance software is paying off. As one of the early SaaS leaders in net-zero digital solutions for ESG reporting, Locus continues to provide value to companies that want to be credible with their carbon reporting and sustainability software.” said Grant Ferrier, president of Environmental Business International Inc. (EBI), publisher of Environmental Business Journal.
“With energy transition, climate resilience, and new federal programs driving business, as well as traditional environmental market drivers in infrastructure, air quality, remediation, water and wastewater it is understandable that companies that offer integrates SaaS platform like Locus has advantage.” added Ferrier.
“As Locus continues to expand our EHS and ESG software we would like to thank EBJ for recognizing Locus again for a 17th consecutive year and for noting the new functionality and growing customer base we achieved in 2022. Locus will continue this trajectory into 2023 with new tools designed to simplify EHS and ESG management in our award-winning Locus software, which offers a single system of record and truth for our customers. Locus SaaS platform enables our customers to manage their carbon transactions and inventory with the same rigor, confidence, and transparency as their financial ones.” said Neno Duplan, the Founder and CEO of Locus Technologies.
San Jose Water Expands Locus Technologies SaaS to include GIS+
Locus GIS+ will streamline SJW’s water quality and environmental management from watershed to consumer taps.
MOUNTAIN VIEW, Calif., 14 February 2023 — Locus Technologies, the leading EHS Compliance, and ESG software provider, today announced that San Jose Water (SJW), an investor-owned public utility providing water service to a population of approximately one million people in the Santa Clara Valley, has expanded Locus’ environmental information management software to use Locus GIS+ for advanced GIS analysis.
SJW has been using Locus SaaS and mobile app since 2014 to manage its field data collection, water quality compliance, and regulatory reporting. SJW also uses Locus to track sewer discharges and well blow-offs.
“Our responsibility is to ensure our customers receive the highest quality drinking water from their taps. We monitor the quality and cleanliness of our water in terms of state and federal regulatory requirements. In 2021, our highly experienced staff collected more than 1,000 regulatory and non-regulatory samples from our distribution system and treatment plant, generating over 23,000 data points. To manage this data effectively, we used Locus’ cloud-based software. GIS mapping capabilities are essential for our environmental data analysis. Locus GIS+ will allow quick data visualization and is a quantum leap forward with advanced analysis tools that use Esri’s Smart Mapping technology,” said Suzanne DeLorenzo, the Director of Water Quality at San Jose Water.
“Locus’s mission is to help organizations, such as San Jose Water, to achieve their business goals by providing them the software tools to manage key data associated with water quality and compliance reporting,” said Neno Duplan, CEO of Locus. “With GIS+, SJW will have all the tools they need to perform a wide range of geospatial data analysis across their distribution system. Our water quality management cloud-based software, coupled with GIS+ and Locus Mobile for field data collection, provides our customers with a highly scalable and feature-rich application that gives water utilities strong analytical power and advanced GIS capabilities.”
Locus GIS+ is powered by Esri’s ArcGIS platform and offers various advanced features— including enhanced cartography, comprehensive spatial data analysis, and the ability to use the customer’s map data through integration with ArcGIS Online and Portal for ArcGIS.
ABOUT SAN JOSE WATER
Founded in 1866, San Jose Water is an investor-owned public utility and is one of the largest and most technically sophisticated urban water systems in the United States. Serving over one million people in the greater San Jose metropolitan area, San Jose Water also provides services to other utilities, including operations and maintenance, billing, and backflow testing. San Jose Water is owned by SJW Group, a publicly-traded company listed on the New York Stock Exchange under the symbol SJW. SJW Group also owns Connecticut Water Company in Connecticut; Maine Water Company in Maine; and SJWTX, Inc. (dba Canyon Lake Water Service Company) in Texas. To learn more about San Jose Water, visit www.sjwater.com.
Locus Innovations in 2022
2022 has given us a wealth of new features and growth! Both of our platforms have undergone improvements to enhance our client’s user experience. Let’s look at all the new features for 2022.
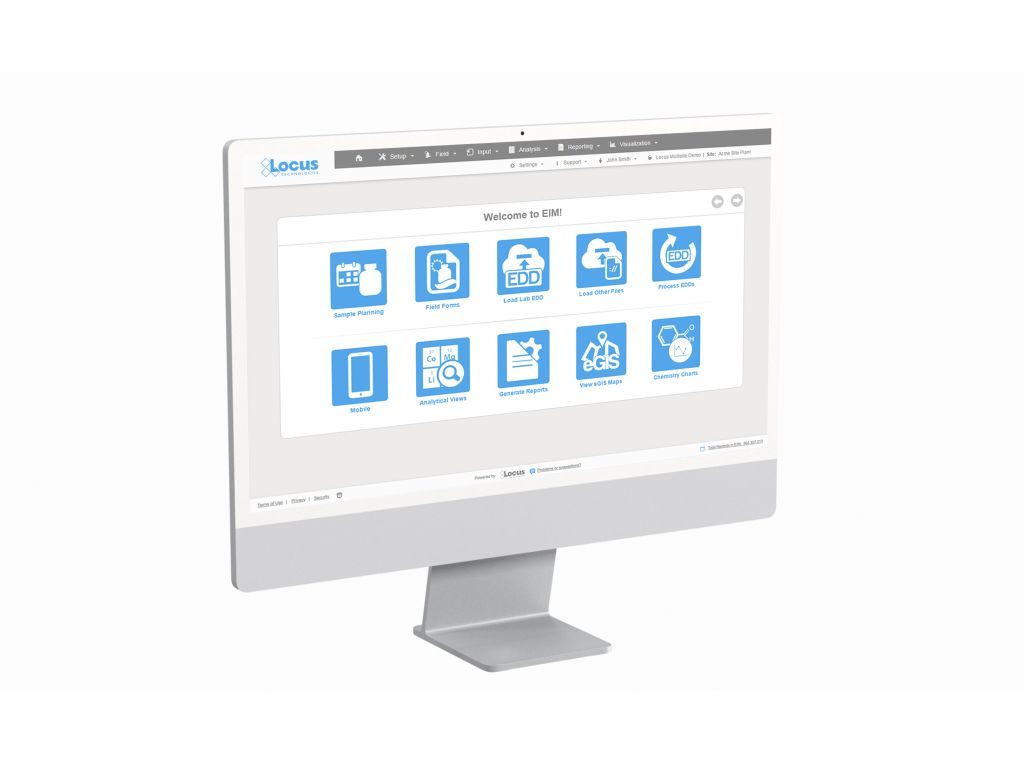
Environmental Information Management (EIM)
1. New Site Metrics dashboard allows immediate visibility into your data with clickable mapping. This is especially powerful for customers with multiple sites where they want to keep track of site activity and usage.
2. Finding data can sometimes be overwhelming especially when you have hundreds, if not thousands, of locations and numerous analytical parameters to review. Locus added advanced database search tools to support multiple search terms and ‘exact match’ searches, making it easy to find exactly what you want with a couple of key words and a click. Never has finding the right results from large complex datasets been so easy.
3. Locus has enhanced its API functionality to enable easier integration with external BI tools, including Tableau, PowerBI, and other apps. Now, customers that rely on external business analytical tools will have quick and easy access to data to combine with other internal data sources.
4. Locus document management has been taken to the next level by allowing customers to link documents from any external library directly into their sites, monitoring locations, samples, and more. This means with a simple click, users can go to lab reports, regulatory reports, and any other current or historical document associated with the site. If you are using SharePoint, for example, to manage documents – they can be accessed directly from Locus software. Document access and security will be preserved by existing document library access controls.
5. 2022 was the year of “help”. In addition to the advanced search, Locus added a new Help Browser to provide access to comprehensive documentation for every feature of the software. It is similar to the familiar “site map”, only the links take you to help content. With this new feature, users can view help in a single location vs having to access the information on each individual screen. For new users, or infrequent users, this will be their new favorite feature.
EHS & ESG Solutions
1. Locus’ Survey/Questionnaire tool enables you to securely & easily obtain data globally without the burdens of training or maintaining user lists. The survey system effortlessly supports data entry from external organizations (such as suppliers) or even occasional users internal to your organization, with a simple link click.
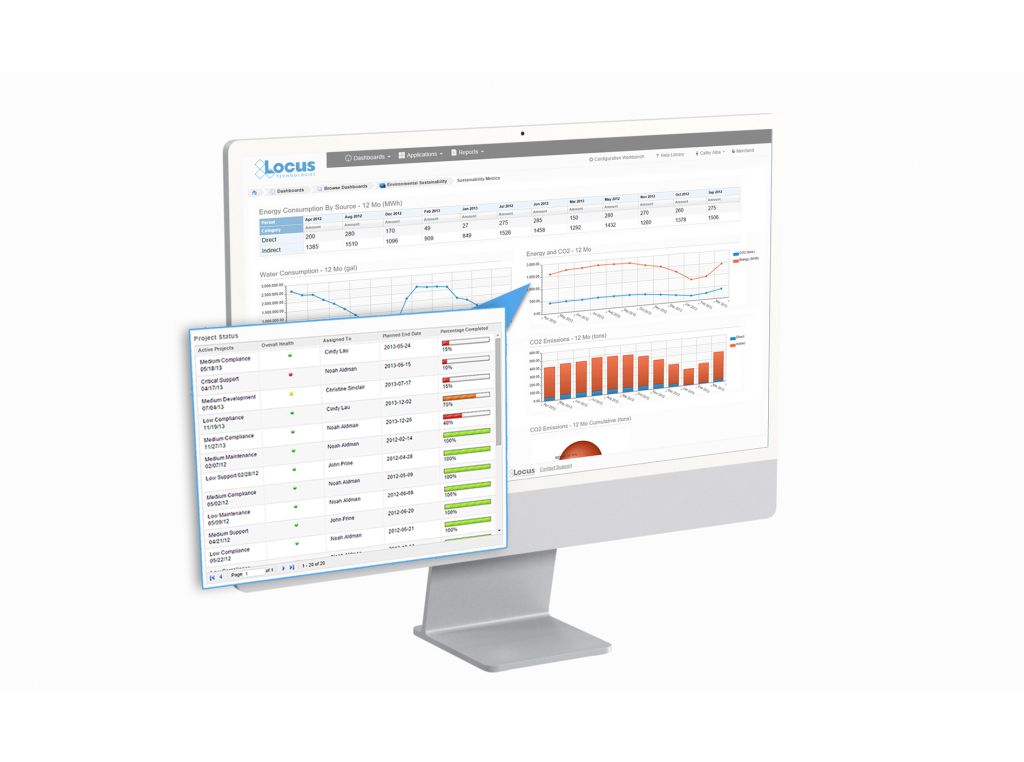
2. Locus released a new pivot table tool that enables you to perform full data analysis on any query in the system. Data may be grouped and organized by any value. Output options include bar charts, heatmaps, tables, area charts, scatter charts, and tree maps. In support of the output options, Locus has improved the ability for users to create dashboards more easily.
3. Complex inspection and audit forms require branching, sophisticated, scoring, and automated responses. Locus added new question types to its inspection/ audit module, including conditional questions based on responses to one or more previous questions. Locus augmented the scoring calculation mechanism and automated creation and tracking of corrective action.
4. In today’s world, users need access to environmental data on the go. Locus augmented its mobile offerings to include configurable layouts for mobile users, with compact forms specially designed for smartphone and tablet access.
5. Today’s managers want immediate access to the data they need. Locus’ new Landing Page feature makes it simple to configure the dashboards, bookmarks, and record lists. This enables the user to review just the areas they need to see and navigate efficiently to complete the work.