California Lawmakers Approve Ban on Plastic Microbeads to Protect Water

California approves AB888, an important bill to prohibit the use of plastic microbeads in personal care products for sale in California by 2020. When someone uses a product – like a face wash, for example – that has microbeads, several things happen. First – they get a unique kind of cleanse in their face that beauty companies suggest they can’t get any other way. Second – the microbeads (tiny pieces of plastic) are washed down the drain with water. These microbeads do not get recycled. They do not get caught in filters before they hit the sea. They pollute.

With two just-released studies showing overwhelming levels of plastic pollution in San Francisco Bay and in Half Moon Bay’s marine life, it’s not an exaggeration to say that this bill will have a huge impact on the health of California’s waterways — and its people. Alaska, Hawaii, Iowa, Minnesota, New York, Vermont, and Washington also tried and failed this year to enact bans on manufacture and sale, while Oregon’s legislature is considering similar bans.

Studies found that San Francisco bay is contaminated with tiny pieces of plastic in greater concentrations than other U.S. bodies of water — at least 3.9 million pieces every day. Many of those plastic particles are tiny microbeads, less than one millimeter in diameter, which can be found in personal care products like shower gels, facial scrubs and toothpaste.

AB888 will ban the beads by 2020. Product manufacturers can use other exfoliants that aren’t as environmentally destructive, and increasingly, states are demanding that they do so. Six other states have already passed legislation that bans or restricts their use.

In addition to the plastic polluting our waterways — there are 471 million microbeads released into the bay every day from wastewater treatment facilities, Gordon said — they also contaminate the fish that we eat. A recent study in the publication Scientific Reports found “anthropogenic debris” in 25 percent of the fish sampled at markets in California.

EPA Imposes New Limits for Toxic Pollutants Released into Water

The Environmental Protection Agency  (EPA) has imposed new standards for mercury, lead and other toxic pollutants that are discharged into the water bodies (rivers and streams) from steam-powered electric power plants.

EPA Administrator Gina McCarthy said the rules, the first national limits on pollutants from steam electricity plants, will provide significant protections for children and communities across the country from exposure to pollutants that can cause serious health problems.

The rule will remove 1.4 billion pounds a year of toxic discharge nationwide. More than 23,000 miles of rivers and streams across the US are polluted by steam electric discharges, which occur close to 100 public drinking water intakes and nearly 2,000 public wells across the nation, the EPA said.

Toxic metals do not break down in the environment and can contaminate sediment in waterways and harm aquatic life and wildlife, including killing large numbers of fish. Steam electric power plants account for about 30 percent of all toxic pollutants discharged into streams, rivers and lakes from U.S. industrial facilities. The pollutants can cause neurological damage in children, lead to cancer and damage the circulatory system, kidneys and livers.

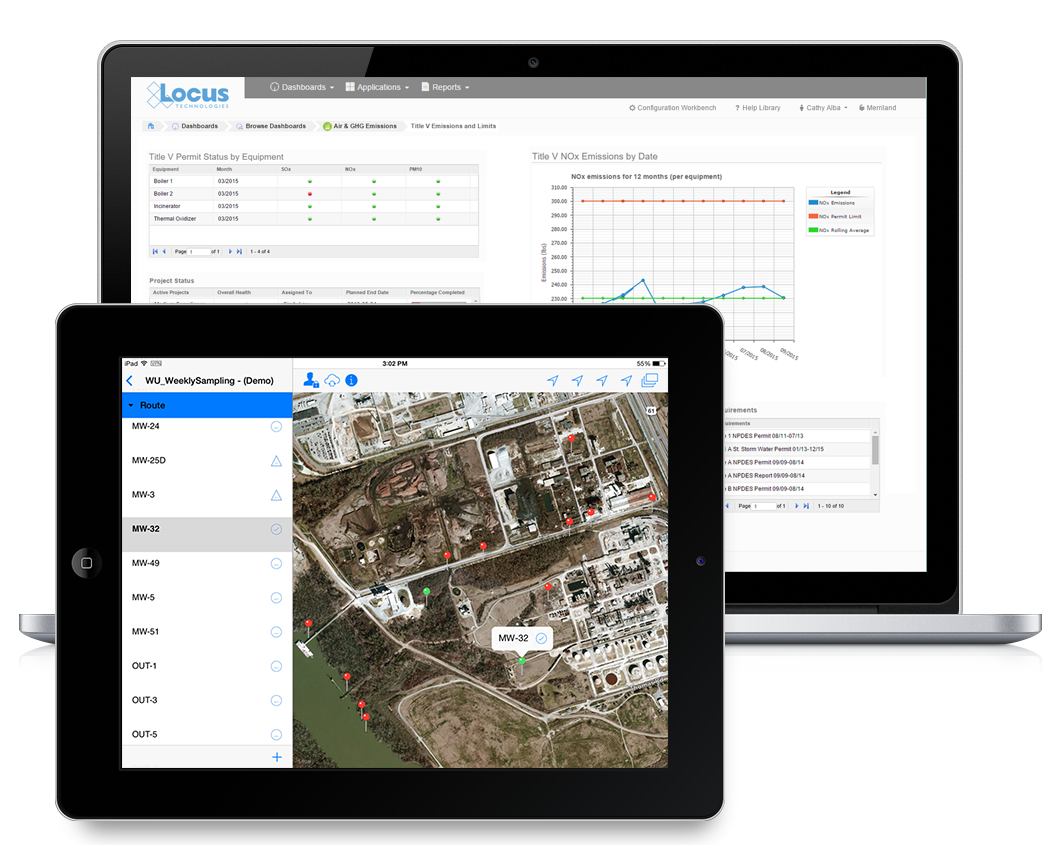
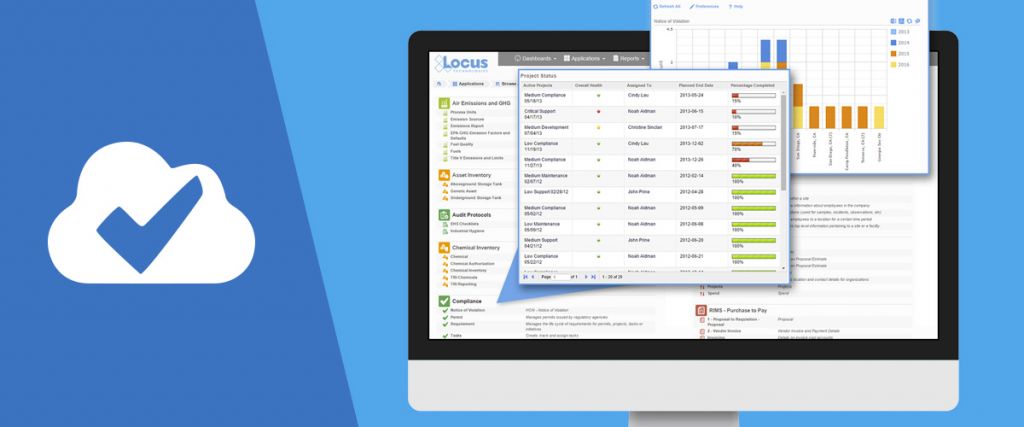
The EPA said most of the nation’s 1,080 steam electric power plants already meet the requirements. About 12 percent, or 134 plants, will have to make new investments to do so. A water quality management software like Locus EIM can help utilities automate their compliance with this new rules and manage water quality across portfolio of their plants.

Colorado Mine Spill Highlights Superfund Challenges

The Colorado mine spill that sent three million gallons of toxic sludge into a river last month highlighted the struggles of the federal Superfund program to clean up contaminated mining sites across the American West, reported Wall Street Journal on 12 September 2015.

The program, administered by the Environmental Protection Agency, was set up in the 1980s to remediate the nation’s most polluted places, from old factories to landfills. But it has been especially strained by legacy mining sites, which are often impossible to permanently clean up and instead require water-treatment plants or other expensive measures to contain widespread pollution, experts say.

The result is that some old mining sites widely acknowledged to be severely contaminated—such as the Gold King mine that led to last month’s spill, and others dotting the Upper Animas River Basin near Silverton, Colo.—haven’t been contained or cleaned, as the EPA and other stakeholders squabble about the best solution.

Currently, dozens of mining sites around the U.S. are on the EPA’s “National Priorities List” for Superfund cleanups or proposed to be added to the tally. But the taxes designed to fund cleanup costs when responsible parties can’t be found expired in 1995, and the multibillion-dollar fund dwindled to zero in the 2003 fiscal year, according to EPA data. Congressional appropriations have since helped support the program, but they decreased to nearly $1.1 billion this fiscal year from $1.3 billion in 2010.

Locus makes ENR TOP 200 Environmental Firms as the only EHS Software company

EPA Issues a Draft Report on Assessment of the Potential Impacts of Hydraulic Fracturing for Oil and Gas on Drinking Water Resources

This assessment provides a review and synthesis of available scientific literature and data to assess the potential for hydraulic fracturing for oil and gas to impact the quality or quantity of drinking water resources, and identifies factors affecting the frequency or severity of any potential impacts. The scope of this assessment is defined by the hydraulic fracturing water cycle which includes five main activities:

  1. Water acquisition – the withdrawal of ground or surface water needed for hydraulic fracturing fluids;
  2. Chemical mixing – the mixing of water, chemicals, and proppant on the well pad to create the hydraulic fracturing fluid;
  3. Well injection – the injection of hydraulic fracturing fluids into the well to fracture the geologic formation;
  4. Flowback and Produced water – the return of injected fluid and water produced from the formation to the surface, and subsequent transport for reuse, treatment, or disposal; and
  5. Wastewater treatment and waste disposal – the reuse, treatment and release, or disposal of wastewater generated at the well pad, including produced water.

This report can be used by federal, tribal, state, and local officials; industry; and the public to better understand and address vulnerabilities of drinking water resources to hydraulic fracturing activities. The report provides a comprehensive analysis of published literature and hints on environmental data management challenges facing hydro fracking industry.  Find out more about our solutions for the oil & gas industry.

For more information and to download report please visit the EPA site: http://cfpub.epa.gov/ncea/hfstudy/recordisplay.cfm?deid=244651

A Better Way to Organize and Manage Environmental Compliance Data

Current Practice

How do companies currently handle and store their environmental information?

Managing an environmental project (contaminated site, emission source, or GHG inventory) is similar to making a Hollywood movie, with one difference: duration.  A movie is usually made in few months, whereas an environmental project typically spans years or decades.

The work involved in investigating, remediating or monitoring of contaminated or emissions sites is almost universally performed by outside consulting firms. Large companies rarely “put all their eggs in one basket,” choosing instead to apportion their environmental work amongst several to 10, 20, or even more consulting firms.  The actual work at a particular site is generally managed and performed by the nearest local office of the firm that has been assigned to the site.

At larger production facilities such refinery or a Superfund site, the environmental work is likely to span 10, 20, or 30 years while monitoring may continue even longer. Over this period of time, investigations are planned, samples collected, reports written, remedial designs created, and following agency approval, one or more remedies may be implemented. Not only is turnover in personnel commonplace, but owing to the rebidding of national contracts, the firm assigned to do the work typically changes multiple times over the life span of a remedial project.

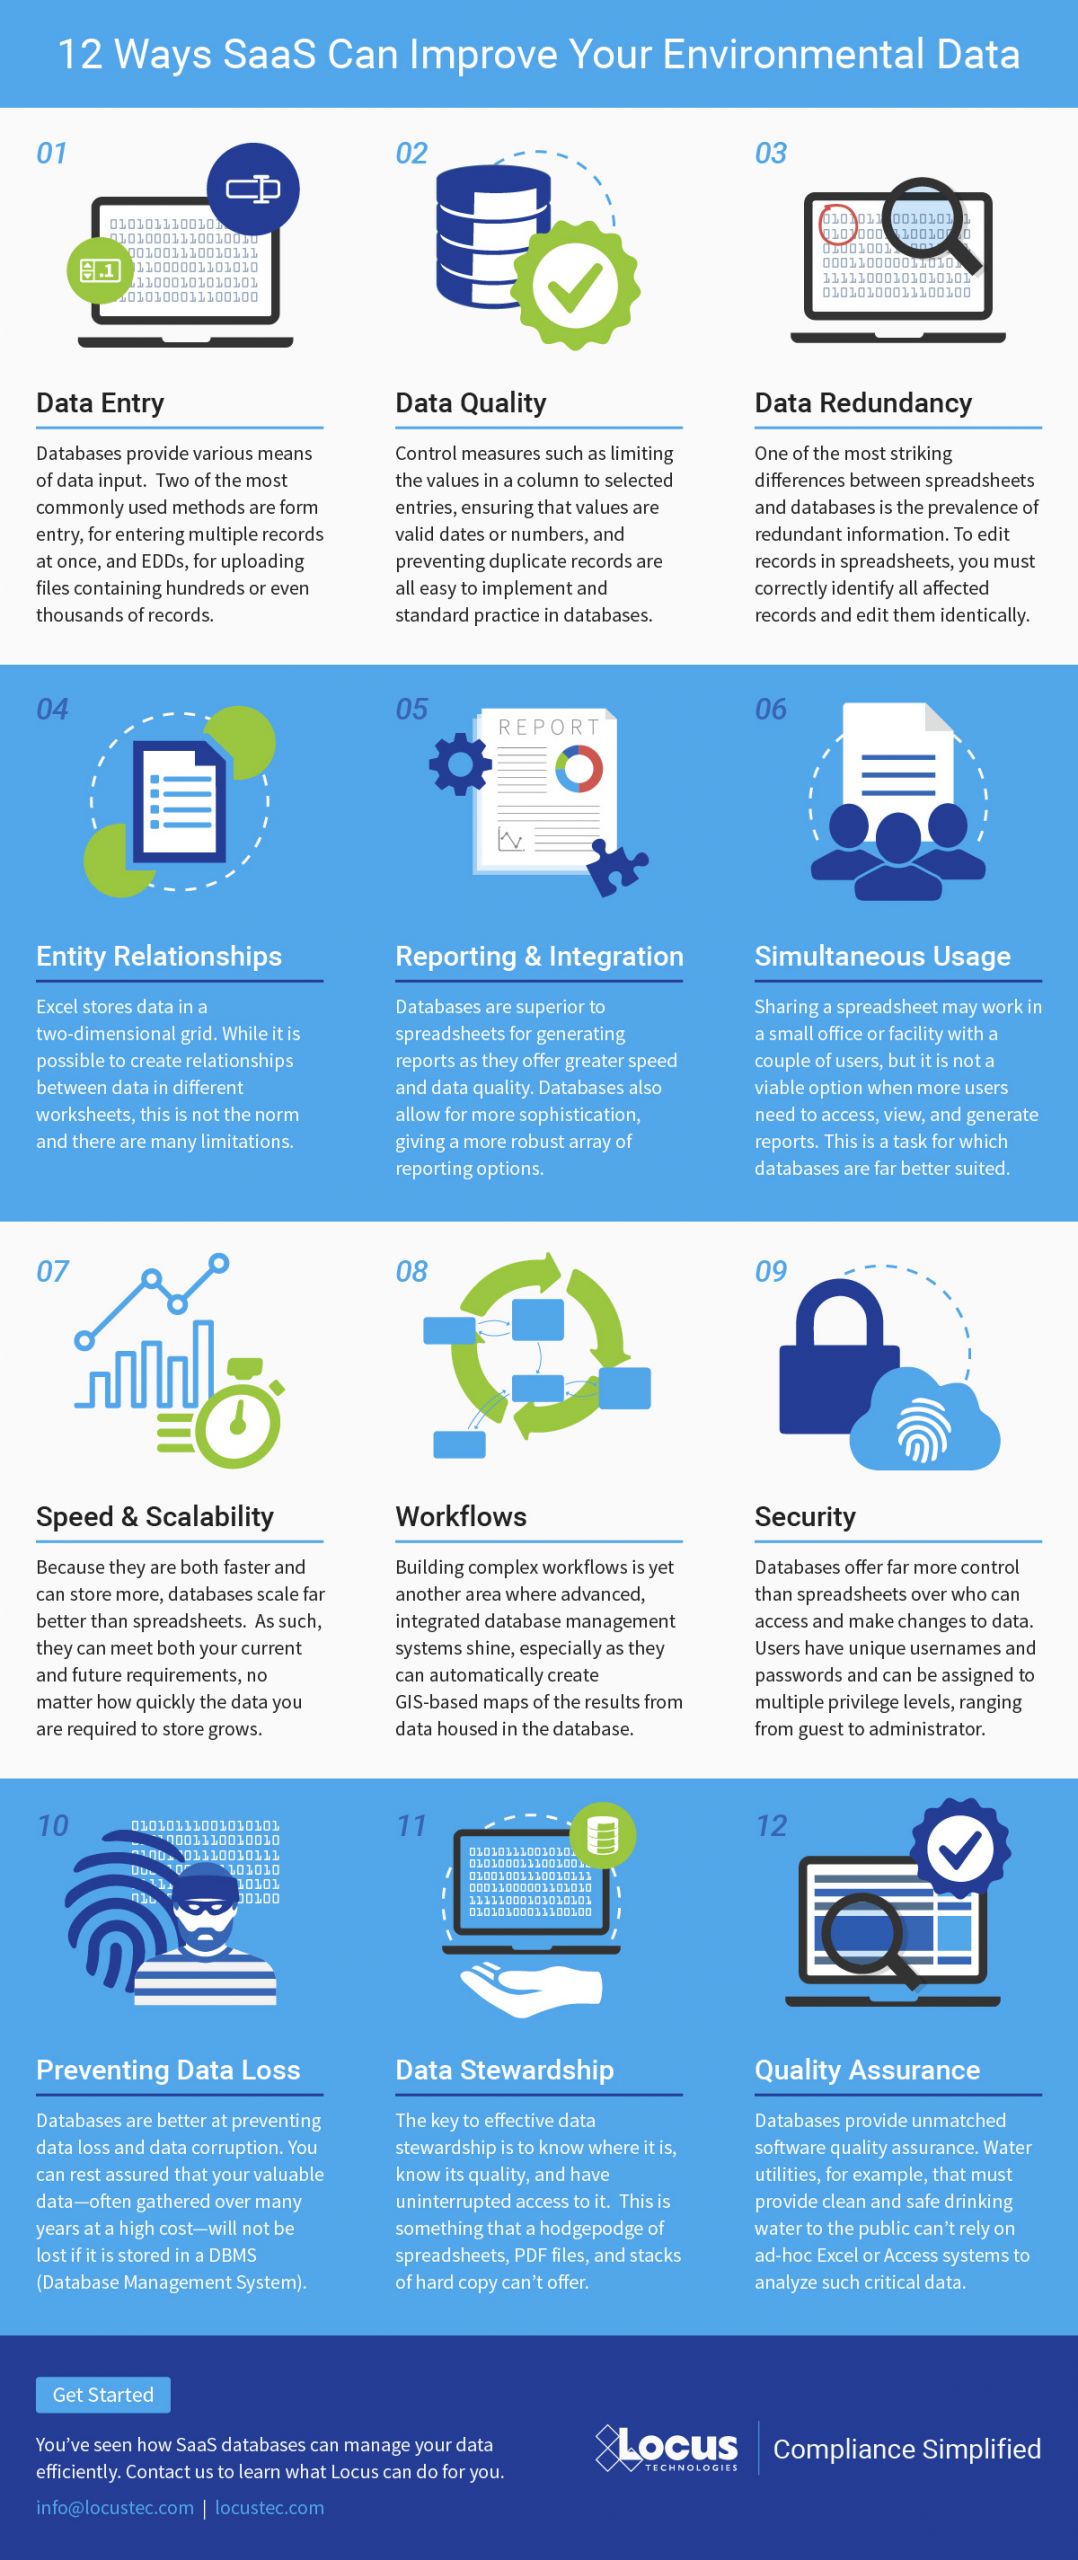
The investigation of a single large, potentially contaminated site often requires the collection of hundreds or even thousands of samples. A typical sample may be tested for the presence of several hundreds of chemicals, and many locations may be sampled multiple times per year over the course of many years. The end result is an extraordinary amount of information. Keep in mind that this is just for one site. Large companies with manufacturing and/or production facilities often have anywhere from a few to several hundred sites. Those that also have a retail component to their operations (e.g., oil companies) can have thousands of sites. Add to this list compliance and reporting data, engineering studies, real time emission monitoring, and the amount of data becomes staggering and unmanageable by conventional databases and spreadsheets. Given the magnitude and importance of this information, one would expect environmental data management to be a high priority item in the overall strategy of any company subject to environmental laws and regulations. But this is not so; instead, our surveys of the industry reveal that a large portion of information sits in spreadsheets and home-built databases. In short, you have an entire industry with billions in liability making decisions using tools that are not up to the task. Robust databases are standard tools in other industries – but for whatever reason, the environmental business has failed to fully embrace them.

As a result, many organizations and governmental agencies are simply “flying blind” when it comes to managing their environmental information.

The lack of standards and inconsistencies in information management practices among the firms performing environmental work for a company impose a significant cost on the company’s overall environmental budget.  The fact that some firms may use spreadsheets, others their own databases, and still other various commercial applications may appear on the surface to be a benign practice, as each firm’s office uses the tools it is most comfortable with. But the overall cost to the customer in fact is enormous.

A Better Way

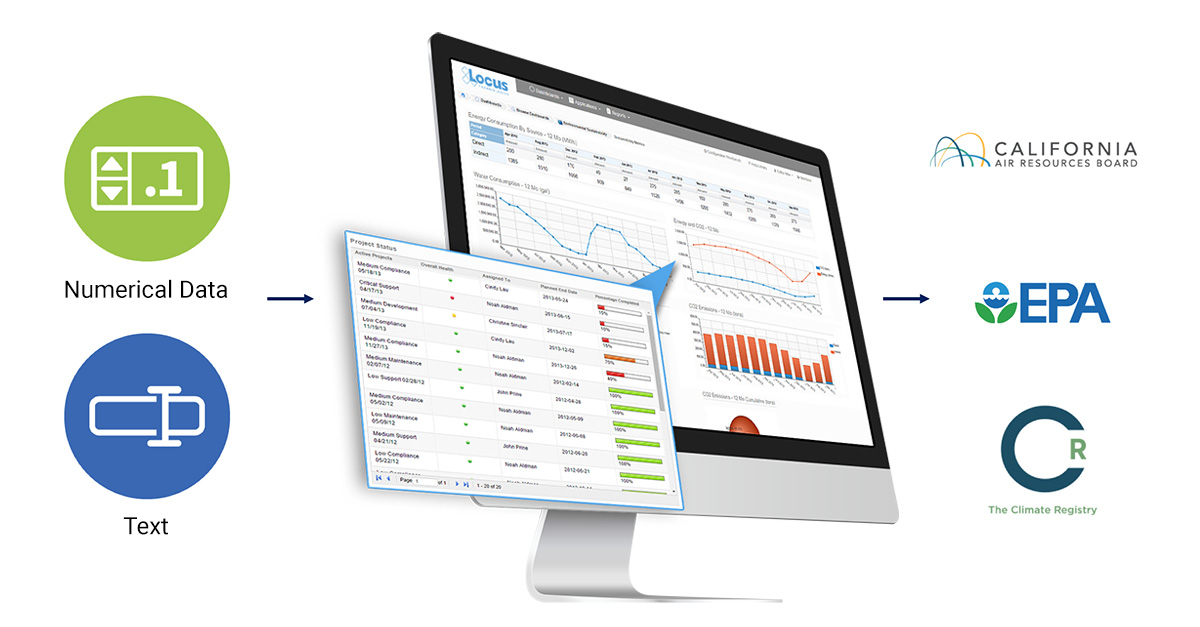
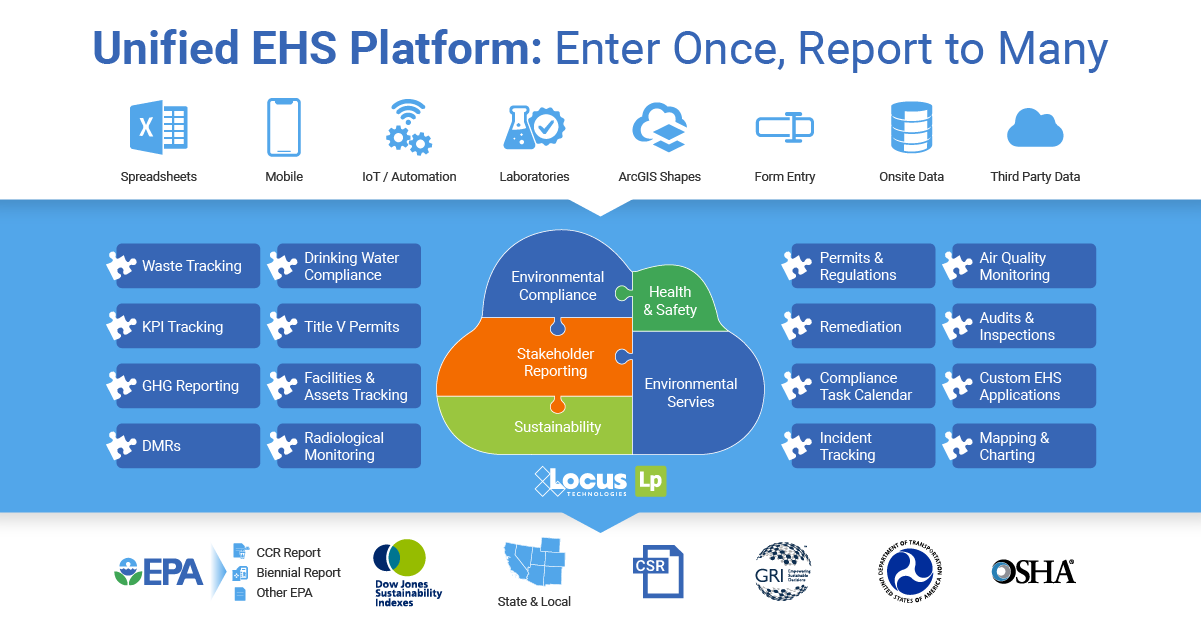
Is there a better approach that companies (both consultants and owners of environmental liability) can adopt to manage their environmental data?  The solution seems obvious:  get all the information about sites out of paper files, spreadsheets, and stand-alone or inaccessible databases and into an electronic repository in a structured and formatted form that—and this is the crucial point — any project participant can access, preferably from the web, at any time or any place. In other words, the solution is not merely to use computers, but to use the web to link the parties involved in an emission management or site cleanup, and this includes not only site owners and their consultants but also regulators, laboratories, and insurers, thus making them, in current jargon, “interoperable.” This may be obvious, but today it is also a very distant goal.

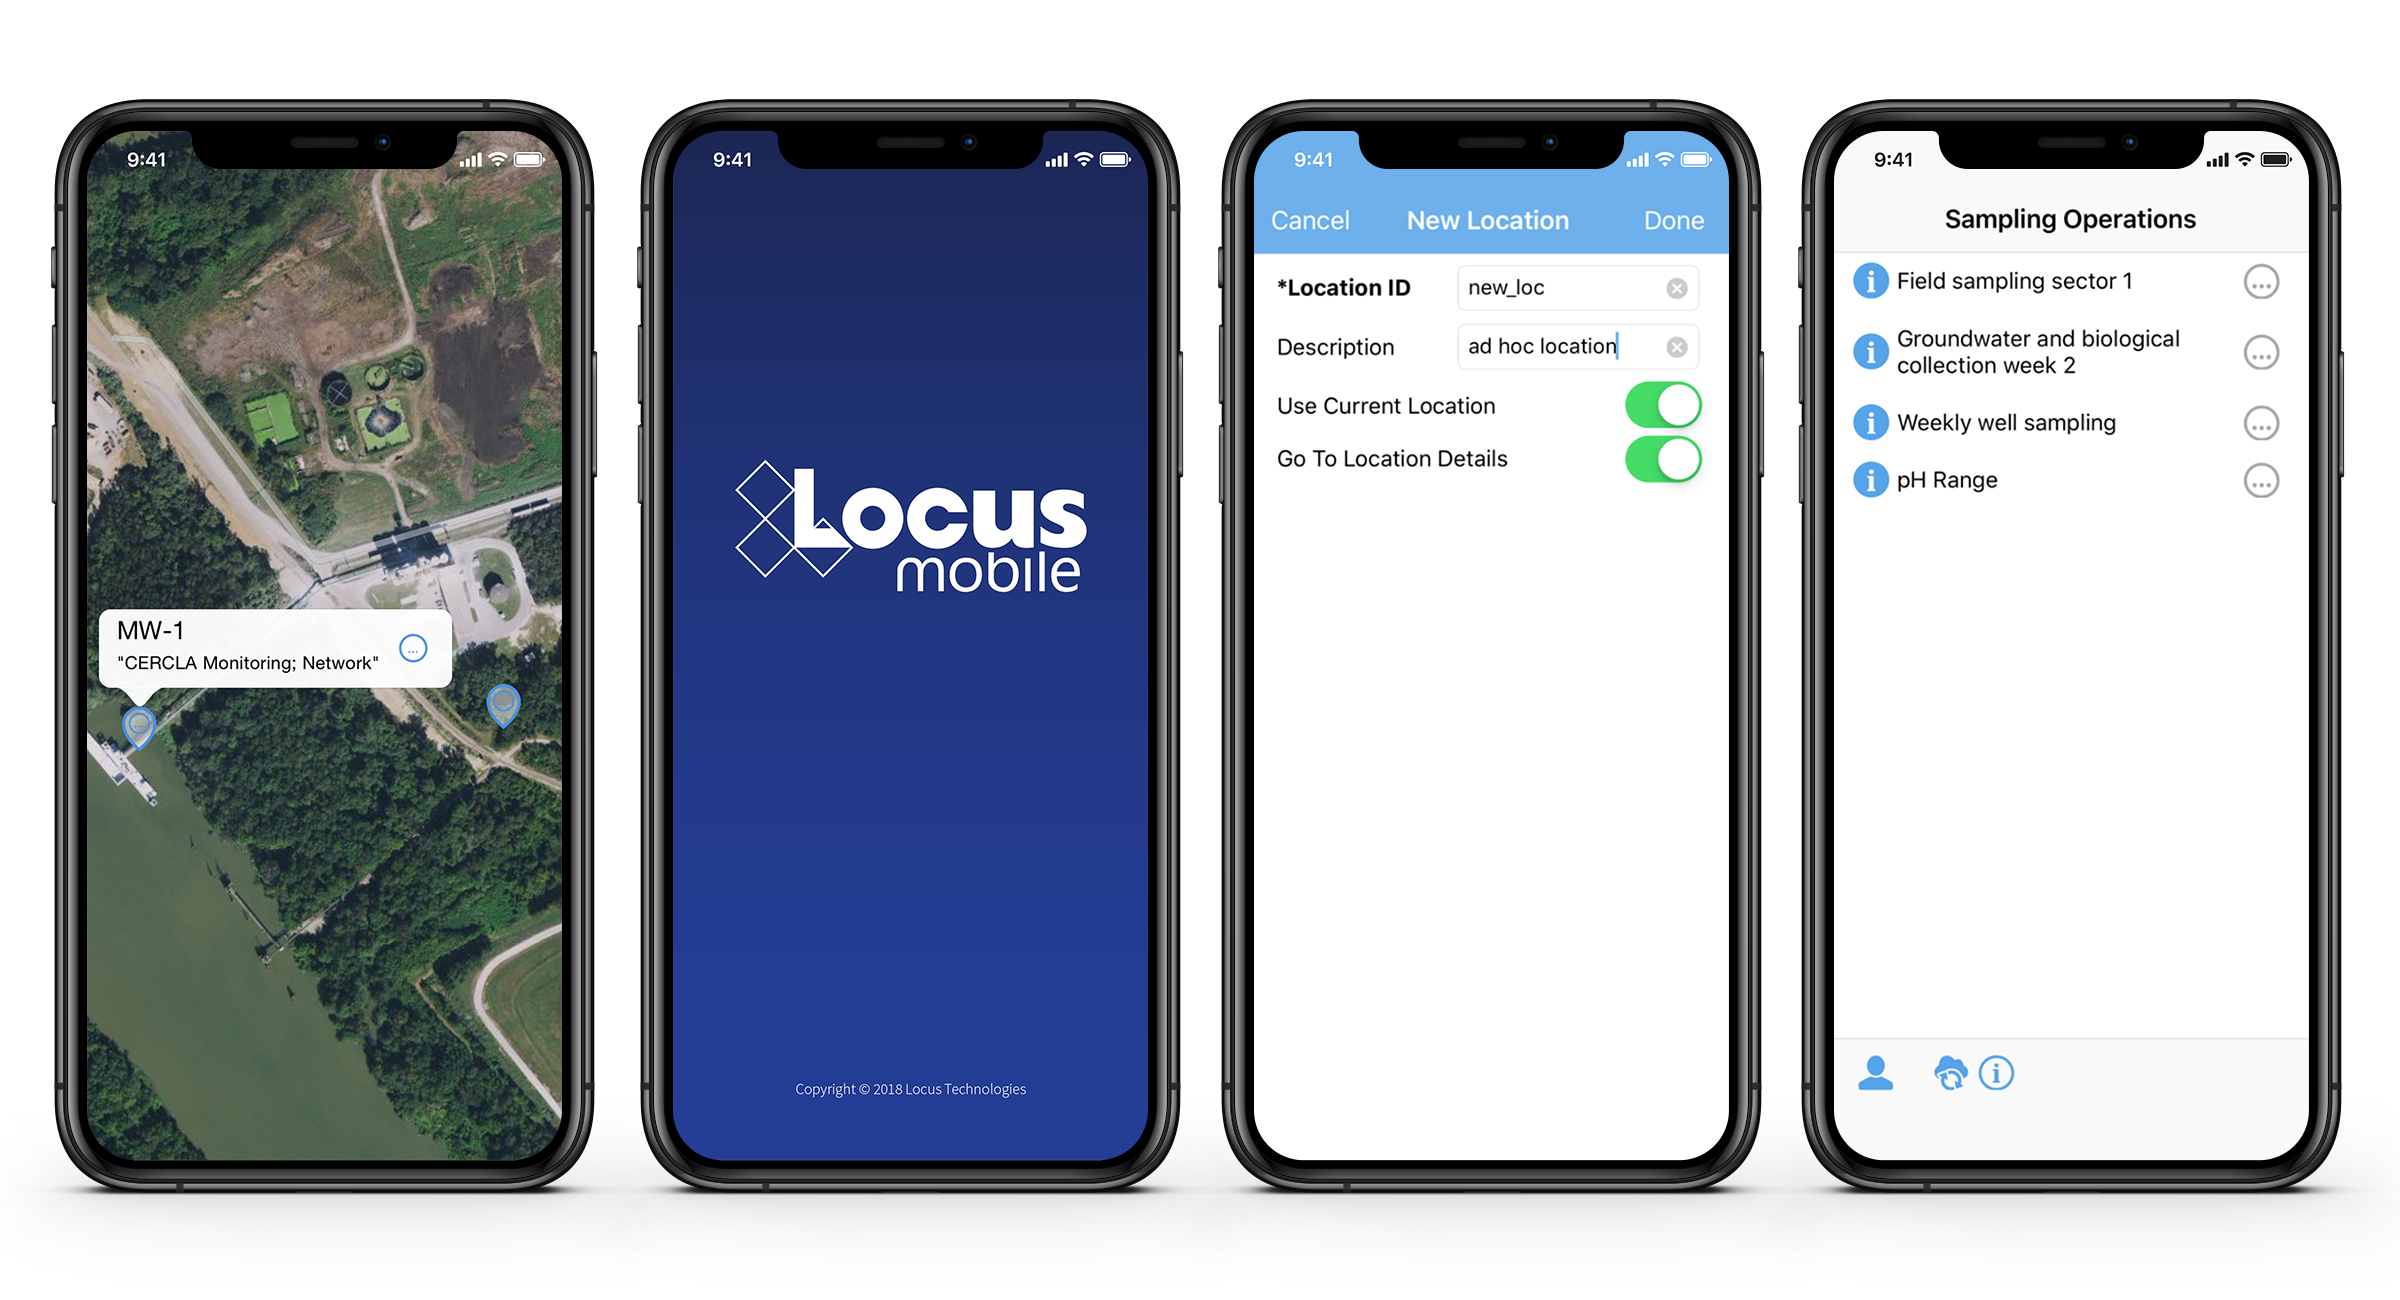
What would the ideal IT architecture of environmental industry in future look like? It would start, with wireless data entry using mobile devices by technicians in the field and wireless sensors where feasible. Labs would upload the results of analytical testing directly from their instrumentation and LIMS systems into the web-based database. During the upload process any necessary error checking and data validation would take place automatically. Consultants would review these uploads and put their stamp of approval on the data before it becomes part of the permanent database. Air monitoring devices and sensors would automatically upload their measurements into the same system. Ditto for any water or air treatment systems installed at facilities, metering devices for consumption of energy, water, or fuel, etc. Anything with an IP address and connected to the internet that produces data relevant to environmental or sustainability monitoring should feed data into the same system. (In today’s word there is a word for it: Internet of Things or IoT).

Behind the scenes, all data would be formatted and stored according to recognized and standard protocols. Contrary to widespread concerns, this does not require a single central repository for all data or any particular hardware architecture. Instead, it relies on common software protocols and formats so that individual computer applications can find and talk to one another across the Internet. The good news is that the most of these standards, such as XML, SOAP, AJAX, REST, and WSDL, already exist and are used by many industries. Others, such as DMR, SEDD, GRI, CDP, EDF, CROMERR, or EDD (spelling them out makes them sound no less obscure) are unique to the environmental industry and govern data interchange between, laboratories, consultants, clients and regulatory agencies. On top of these, there needs to be hacker-proof layers of authentication and password protection so that only the right people can access critical or sensitive information.

There is still some work to do to refine these technologies but the basic building blocks are already readily available and implemented by few progressive companies and regulatory agencies. The problems that this changed approach would address are many. First, data would be entered or uploaded just once, preferably electronically. Secondly, data transfer costs would drop and data quality would improve. No longer would the need exist to transfer data whenever one consulting firm is replaced by another or to maintain multiple databases that must be kept in sync. Third, the significant amounts of time that engineers, managers, and scientists now spend determining where a particular report is correct or looking up information on a site would dramatically decline. Fourth, by having their data in a consistent electronic format, companies would be in a better position to comply with the emerging demand to upload   information on their sites to state or federal agencies and organizations. Several progressive states have already imposed electronic deliverable standards (e.g., California and New Jersey), and US EPA is working on its own standards based on XML technology.  Last, and most significantly, site owners would assume possession of their data and as such, finally gain ready access to information about their own sites. This would seem particularly beneficial to public companies attempting to comply with the SOX.

The good news is that a system described above already exists.

We would love to discuss your environmental data situation with you. Contact us or call (650) 960-1640.

New spatial data analysis tools added to Locus EIM software

The new graduated symbol and graduated color legend tools allow for creation of sophisticated maps showing environmental data

MOUNTAIN VIEW, Calif., 11 May 2015 — Locus Technologies (Locus), the leader in cloud-based environmental compliance and information management software, has announced the addition of powerful new data analysis tools to the eGIS portion of its Environmental Information Management (EIM) software. The new tools support creation of graduated color and graduated symbol legends when posting analytical results, groundwater levels, and field measurements to the map.

With the graduated color tool, when users post data to the map, they have the option to color code the map symbols by having each result placed into one color ‘bin’ based on the result value. Users can classify the results using one of four different methods: equal interval (each bin has same numerical interval with user specified number of bins); defined interval (each bin has same numerical interval with user specified interval); percent (each bin represents the Nth% of the total result range, for example quantiles or quintiles or deciles); or standard deviation (each bin represents the # of standard deviations from the mean for the result value). There are further options for specifying min and max values for the bins and for picking linear or log scales. If users are comparing results to an action limit, they can also classify results based not on the result but on the exceedance factor (result/action limit).

The graduated symbol tool works the same as the graduated color tool, except instead of color coding results, users can have the symbols change sizes based on the result. By using these new legend tools, users can create sophisticated maps that help visualize their environmental compliance data and quickly see data hotspots or outliers.


ABOUT LOCUS EIM
The Locus EIM SaaS offers enterprise environmental information management for analytical data for water quality, chemicals, radionuclides, geology and hydrogeology. EIM provides the whole solution and supports workflow from sample planning, collection, analysis, data validation, visualization and reporting. Locus Mobile is fully integrated with EIM and provides for real time field data collection and synchronization with EIM.

California Governor Orders New Target for Emissions Cuts

California Gov. Jerry Brown issued an executive order Wednesday, April 29, 2015 sharply speeding up California’s already ambitious program aimed at curbing greenhouse gas emissions, saying it was critical to address “an ever-growing threat” posed by global warming to the state’s economy and well-being. In an executive order, Brown said the state must cut the pollutants to 40% below 1990 levels by the year 2030.
Brown’s order aligns the California’s goals with standards set by the European Union.

Mr. Brown said this tough new interim target was essential to prod the energy industry to act and to help the state make investment and regulatory decisions that would assure that goal was not missed.

Environmental and Sustainability Software: How one company’s cloud environmental and sustainability software is changing how firms and government manage environmental information.

How one company’s cloud environmental and sustainability software is changing how firms and government manage environmental information.

Environmental and Sustainability Software

We believe that every company that wants to be credible with their environmental reporting must own their data and organize it in centralized database on the web.

Our market category is not shaped by explosive growth of software companies like ones associated with social media or search engines. Our software manages and organizes a type of information on which the future of humankind depends. We organize it in a serious and very scalable way.

To read the full story and interview please click here.