Locus at 25 Years: How Did We Fund Locus?
Many in our material-driven culture, particularly in Silicon Valley, assign more excellent value to companies based on how much venture capital or private equity money they have raised or how quickly their companies have grown after initial seeding, and less to founders who bootstrapped their companies from nothing and after that, positioned them for long and steady growth. Although the term means different things in different areas of knowledge, in entrepreneurship, bootstrapping is the process of starting a business with little or no external funding.
Locus has proven that how much funding a startup company has raised or how quickly it has grown are the wrong metrics to measure a company’s success, particularly in the arena of environmental compliance and data management. We bootstrapped Locus in 1997 and, without outside capital, created a new industry at the intersection of two significant trends before either was a trend: the growth in Internet usage and the growth in the acquisition, storage, and analysis of environmental information. Locus not only defined and pioneered this new space of environmental information management in the cloud but also became an industry leader leaving behind many well-funded startups with “borrowed ideas” and established ERP software companies. At every startup stage, some actions are “right” for the startup to maximize return on time, money, and effort. Fortunately, Locus took the necessary steps that allowed it to weather several recessions and market downfalls.
While bootstrapping techniques are not just limited to funding, they also apply to how companies are run. By bootstrapping Locus, we created a built-to-last, slow-burn startup that was focused on the singular goal of building a cloud-based environmental data information management system and avoided expending effort on expanding applications that the market did not need or those that we were too dependent on external help. Bootstrapping provided Locus with a strategic roadmap for achieving sustainability through customer funding (i.e., partnering with customers)—if it is essential for Locus, it must be necessary for the customer first. If it is vital for customers, they must pay for a portion of it and have “skin in the game. “We don’t build applications to attract customers. We attract customers with our ideas to build applications together” became Locus’s modus operandi: Locus was born and built with this simple philosophy.
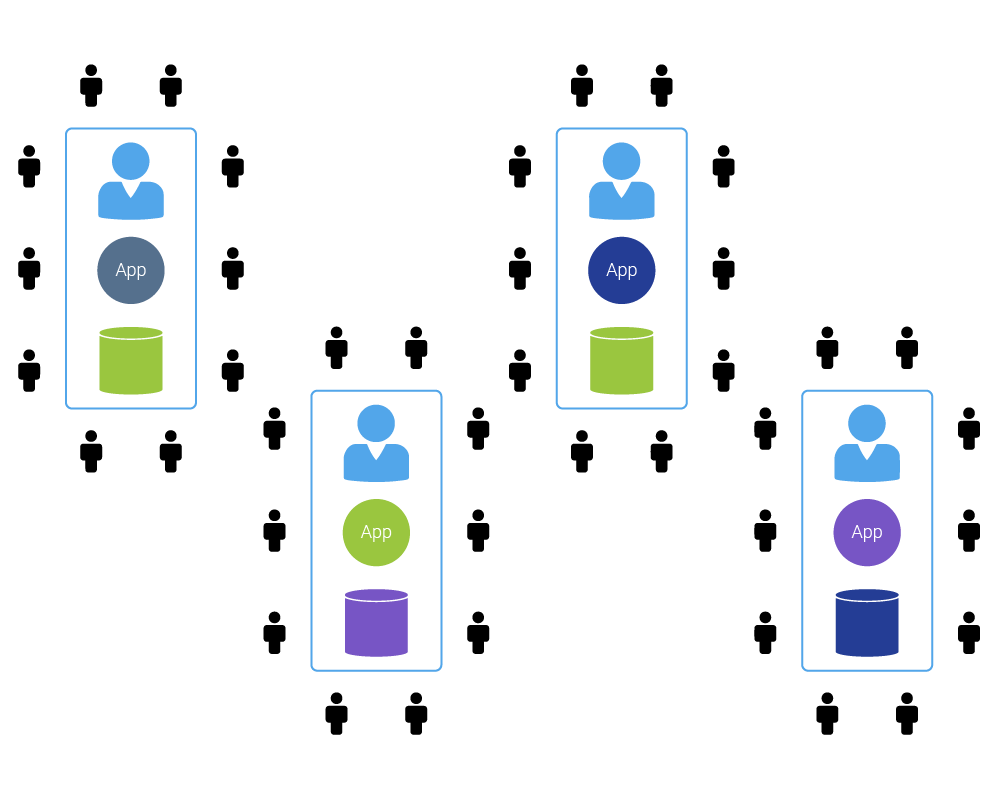
Once Locus had built a solid customer base, Locus encouraged its paying customers to become consultants who defined the Locus product map. This strategy resulted in a rapid evolutionary expansion of Locus’ software in the marketplace. Crowdsourcing product development from customers with real-world problems has become the cornerstone of Locus’ success in the market.
Let us digress here to comment on what it takes to build an environmental database management system. In the 1990s, when Dr. Duplan was leading the development of a client-server database for his then-employer (there were no internet-based databases back then), he and others now at Locus attended a trade show where a product called Oracle Environmental or something like that was being marketed. Yes, this is the same Oracle that is now one of the largest software companies in the world, with a market cap in the hundreds of billions, revenues in the tens of billions, profits in the billions, and over 130,000 employees.
This small group of engineers and scientists wondered how they could compete against a growing behemoth like Oracle with all its programmers and financial resources. They listened to a marketing spiel and took the system for a test drive at Oracle’s booth. Their worries almost immediately vanished. What they saw was characterized by all as a system that was “a mile wide and an inch deep.” It was designed and developed by individuals with no field experience, little or no engineering or scientific expertise, and little understanding of environmental data and data flow. It claimed to touch on many different types of data (which it did) but owing to its lack of depth, it clearly could not work in the real world. Sure enough, the product was gone within a few years.
In contrast, EIM has been designed and developed by individuals with advanced degrees in civil and environmental engineering, water resources, geology, chemistry, and biology. All who are not solely computer programmers have spent serious time in the field, have overseen the drilling of boreholes and wells, planned and collected samples, verified and validated analytical data, and have created data reports for internal, external entities. These individuals are very cognizant of the vagaries of environmental data.
When giving demos of the system, we are often peppered with questions such as:
- How do you calculate the groundwater elevation in a well that has some saline in the groundwater?
- Can your system handle different units when reporting or calculating statistical measures?
- Does your system have a means of accommodating dilutions when validating your data?
- How does your system handle synonyms for parameters or alternate location names?
- Does your system store TEFs?
- Does your validation module assign qualifiers, and if so, how?
- Can your system accommodate changes in well reference elevations?
- Is your system’s data validation module based on SDGs, analysis lots, sample prep lots, or a combination?
- To what extent and level are your systems capable of tracking a sample from planning to the grave?
All these questions make sense to us, and we have an answer to them. Our deep domain expertise in such matters, coupled with our backgrounds in engineering and the sciences and our relevant work experience, has enabled us to work with our customers to build ground-breaking tools and modules for our products that work for all companies.
While other environmental software companies have come and gone—often after getting much press, only to fizzle out on broken promises and dried-up funding, Locus has never wavered from its path to provide environmental data management services to corporations and government agencies. Despite the absence of a flashy PR machine and VC or PE funding, Locus has continued to be a profitable, independent, and visionary organization, which is now considered one of the top environmental software companies in the world.
This is the fourth post highlighting the evolution of Locus Technologies over the past 25 years. The first three can be found here and here, and here. This series continues with Locus at 25 Years: Blockchain for Emissions Management.

 Mr. Hawthorne has been with Locus since 1999, working on development and implementation of services and solutions in the areas of environmental compliance, remediation, and sustainability. As President, he currently leads the overall product development and operations of the company. As a seasoned environmental and engineering executive, Hawthorne incorporates innovative analytical tools and methods to develop strategies for customers for portfolio analysis, project implementation, and management. His comprehensive knowledge of technical and environmental compliance best practices and laws enable him to create customized, cost-effective and customer-focused solutions for the specialized needs of each customer.