5 Major Signs That You Need to Replace Your Water Data Management Solution
If your current water data management solution doesn’t meet these requirements, then it’s time to consider a switch.
If your current water data management solution doesn’t meet these requirements, then it’s time to consider a switch.
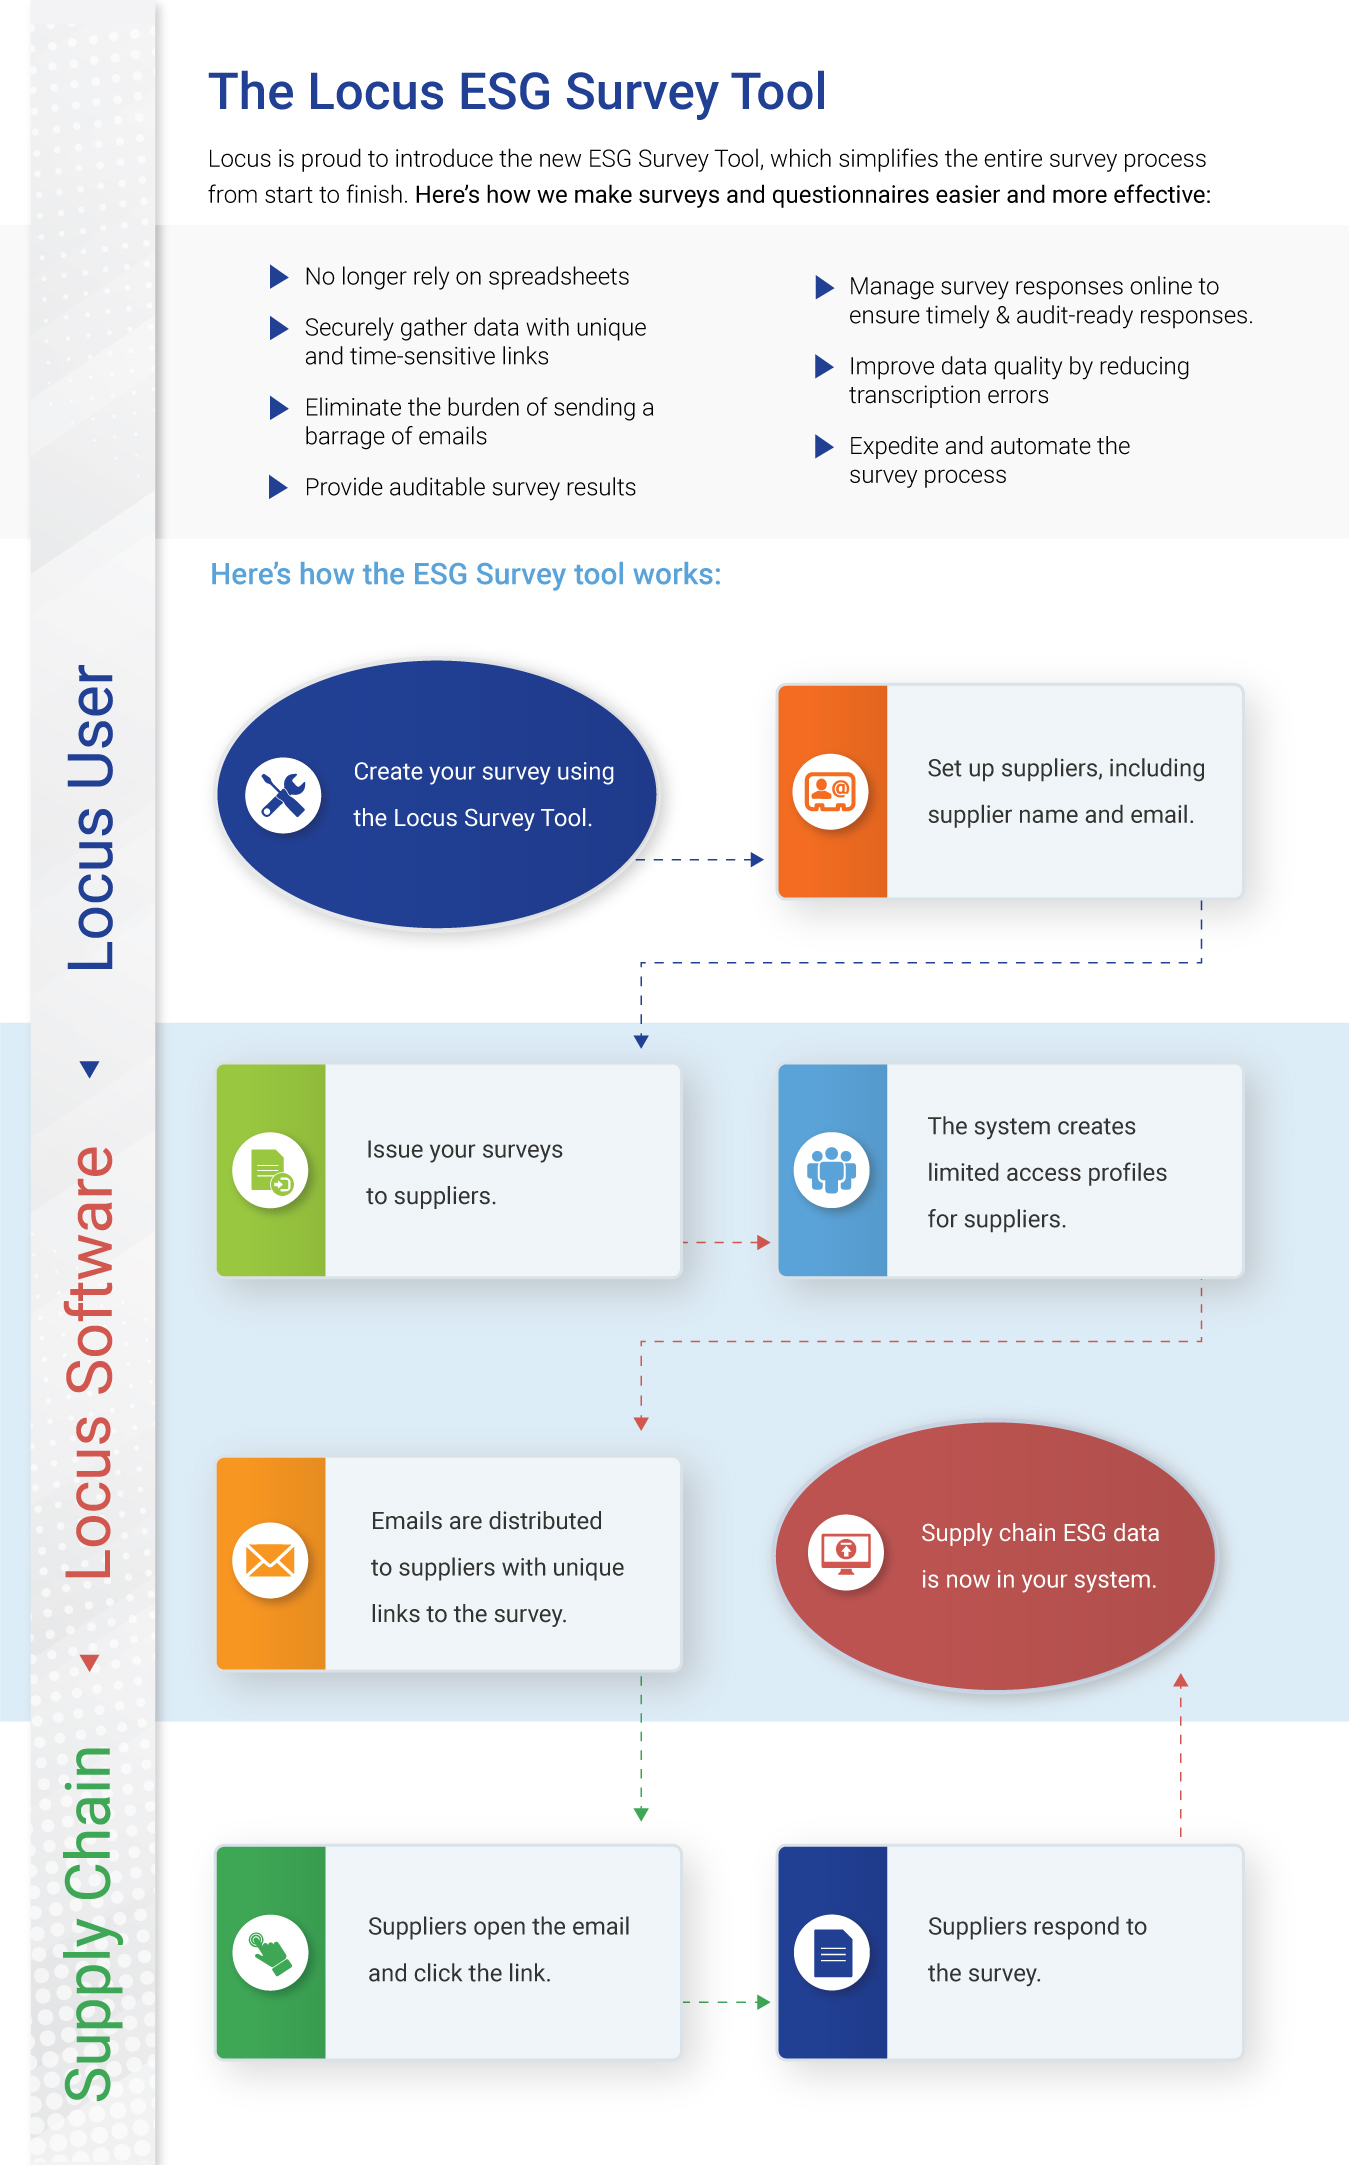
The Locus Technologies ESG Survey Tool enables users to email surveys and questionnaires directly from Locus to their supply chain. This is achieved without having to create usernames and credentials those receiving surveys.
When surveys are issued, the tool generates a secure link to each email recipient. Email recipients click the link, respond to the survey or questionnaire (without having to create a Locus username/password), and the data will be captured within Locus software for ESG purposes. Recipients of the link only receive access to their survey form, and nothing else in the system, and the links expire within a prescribed timeframe to further strengthen security.
The survey tool securely streamlines data collection from external entities who would traditionally never be given access to the system, including suppliers, vendors, sales channels and consultants. Once collected, the data can be immediately be used for ESG calculations and reporting.
In a Software as a Service (SaaS) delivery model, service uptime is vital for several reasons. Besides the obvious of having access to the service over the internet at any given time and staying connected to it 24/7/365, there are additional reasons why service uptime is essential. One of them is quickly verifying the vendor’s software architecture and how it fits the web.
Locus is committed to achieving and maintaining the trust of our customers. Integral to this mission is providing a robust compliance program that carefully considers data protection matters across our cloud services and service uptime. After security, service uptime and multitenancy at Locus come as a standard and, for the last 25 years, have been the three most essential pillars for delivering our cloud software. Our real-time status monitoring (ran by an independent provider of web monitoring services) provides transparency around service availability and performance for Locus’ ESG and EHS compliance SaaS products. Earlier I discussed the importance of multitenancy in detail. In this article, I will cover the importance of service uptime as one measure to determine if the software vendor is running genuine multitenant software or not.
If your software vendor cannot share uptime statistics across all customers in real-time, they most likely do not run on a multitenant SaaS platform. One of the benefits of SaaS multitenancy (that is frequently overlooked during the customer software selection process) is that all customers are on the same instance and version of the software at all times. For that reason, there is no versioning of software applications. Did you ever see a version number for Google’s or Amazon’s software? Yet they serve millions of users simultaneously and constantly get upgraded. This is because multitenant software typically provides a rolling upgrade program: incremental and continuous improvements. It is an entirely new architectural approach to software delivery and maintenance model that frees customers from the tyranny of frequent and costly upgrades and upsell from greedy vendors. Companies have to develop applications from the ground up for multitenancy, and the good thing is that they cannot fake it. Let’s take a deeper dive into multitenancy.
An actual multitenant software provider can publish its software uptime across all customers in real-time. Locus, for example, has been publishing its service uptime in real-time across all customers since 2009. Locus’s track record speaks for itself: Locus Platform and EIM have a proven 99.9+ percent uptime record for years. To ensure maximum uptime and continuous availability, Locus provides redundant data protection and the most advanced facilities protection available, along with a complete data recovery plan. This is not possible with single-tenant applications as each customer has its software instance and probably a different version. One or a few customers may be down, others up, but one cannot generally aggregate software uptime in any meaningful way. The fastest way to find if the software vendor offers multitenant SaaS or is faking it is to check if they publish online, in real-time, their applications uptime, usually delivered via an independent third party.
Legacy client-server or single-tenant software cannot qualify for multitenancy, nor can it publish vendor’s uptime across all customers. Let’s take a look at definitions:
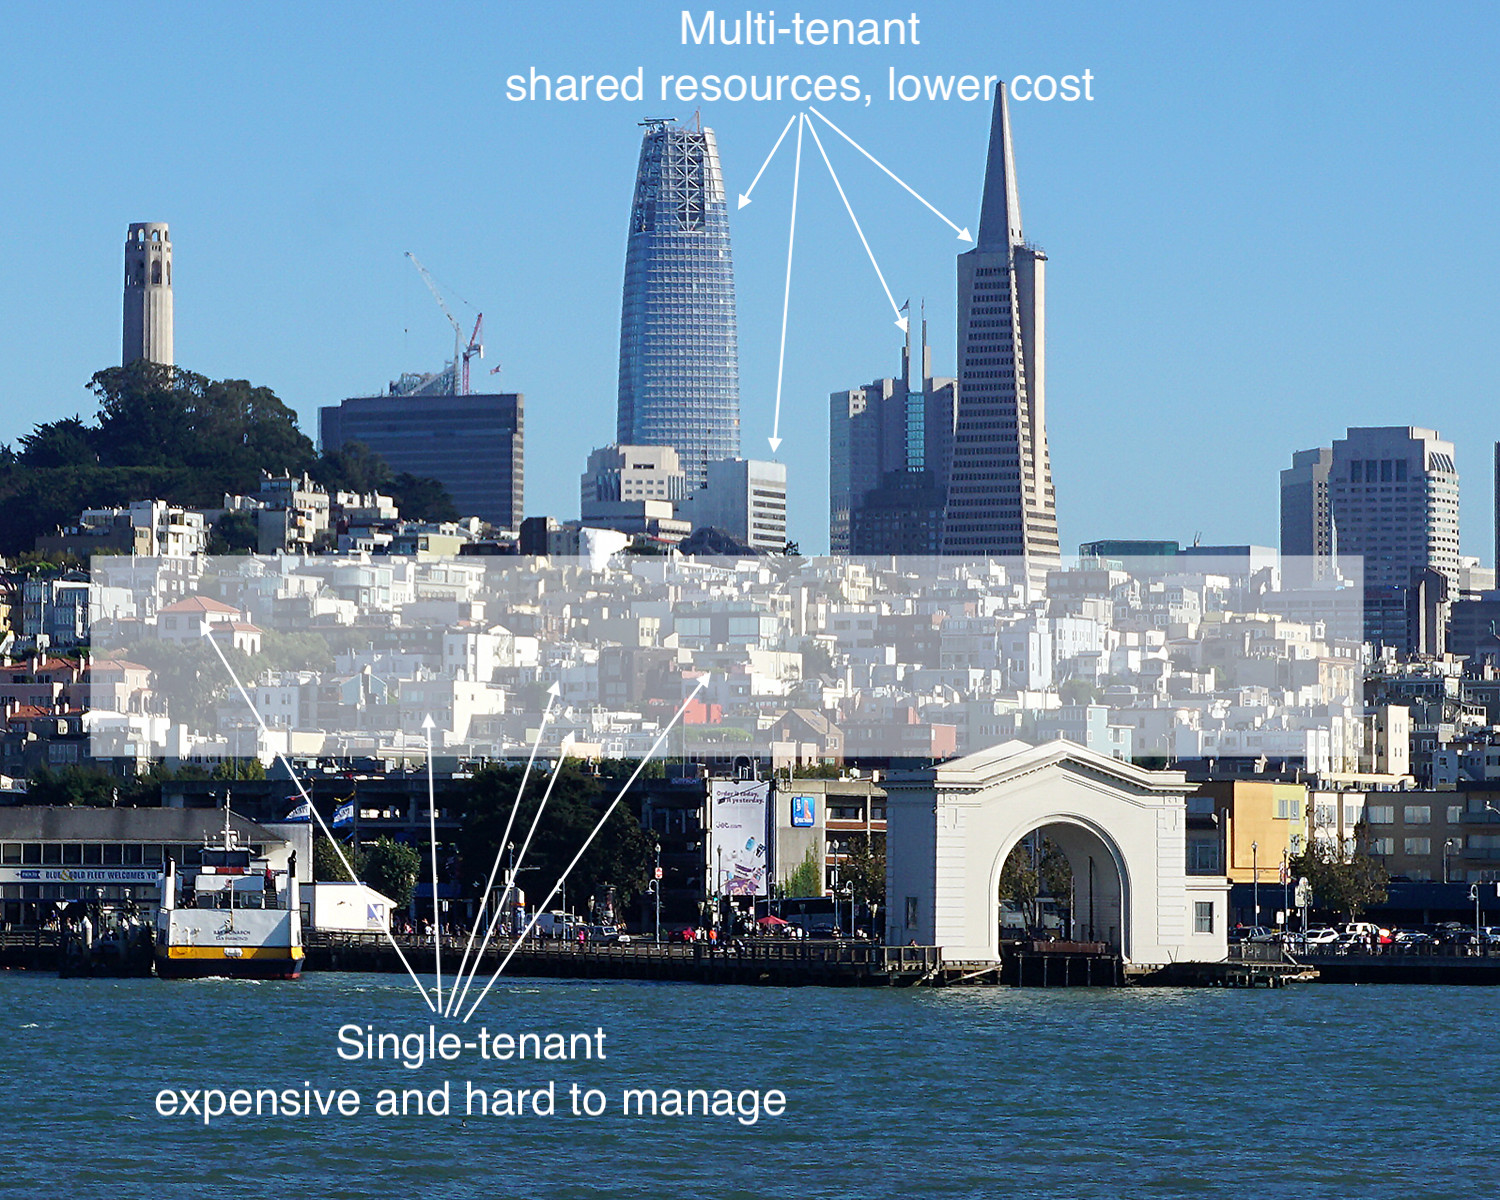
Single-Tenant – A single instance of the software and supporting infrastructure serves a single customer. With single-tenancy, each customer has their independent database and instance of the software. Essentially, there is no sharing happening with this option.
Multitenant – Multitenancy means that a single instance of the software and its supporting infrastructure serves multiple customers. Each customer shares the software application and also shares a single database. Each tenant’s data is isolated and remains invisible to other tenants.
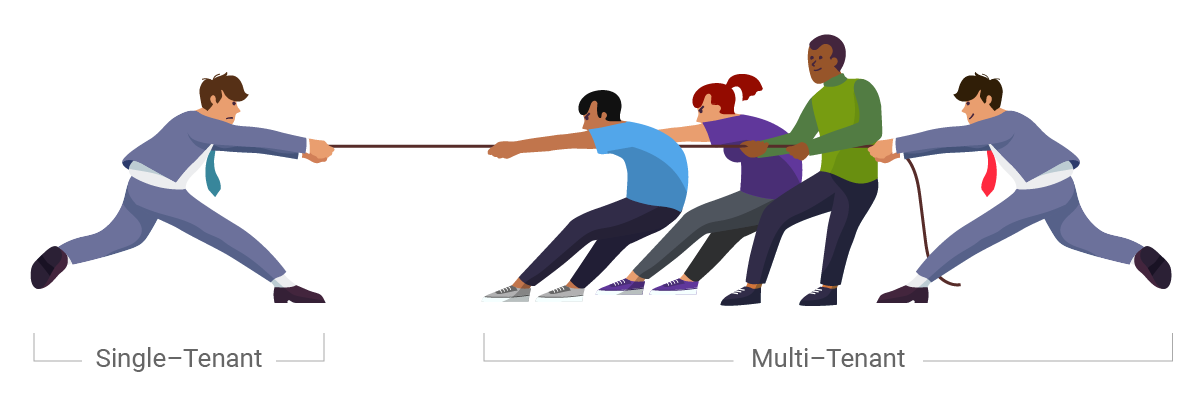
A multitenant SaaS provider’s resources are focused on maintaining a single, current (and only) version of the software platform rather than being spread out in an attempt to support multiple software versions for customers. If a provider isn’t using multitenancy, it may be hosting thousands of single-tenant customer implementations. Trying to maintain that is too costly for the vendor, and sooner or later, those costs become the customers’ costs.
A vendor invested in on-premise, hosted, and hybrid models cannot commit to providing all the benefits of an actual SaaS model due to conflicting revenue models. Their resources will be spread thin, supporting multiple software versions rather than driving SaaS innovation. Additionally, suppose the vendor makes most of their revenue selling on-premise software. In that case, it is difficult for them to fully commit to a proper SaaS solution since most of their resources support the on-premise software. In summary, a vendor is either multitenant or not – there is nothing in between. If they have a single application installed on-premise of customer or single-tenant cloud, they do not qualify to be called multitenant SaaS.
Before you engage future vendors for your enterprise ESG reporting or EHS compliance software, assuming you already decided to go with a SaaS solution, ask this simple question:
Can you share your software uptime across ALL your customers in real-time? If the answer is no, pass.
And if the vendor suddenly introduces a “multitenant” model (after selling an on-premises or single-tenant software version for 10+ years), who in the world would want to migrate to that experimental cloud without putting the contract out to bid to explore a switch to well established and market-tested actual multitenant providers? The first-mover advantage of multitenancy is a considerable advantage for any vendor. Still not convinced? Let me offer a simple analogy to drive home the point as to why service uptime and multitenancy matter: Tesla vs. Edison–War of Currents.
The War of Currents was a series of events surrounding the introduction of competing electric power transmission systems in the late 1880s and early 1890s that pitted companies against one another and involved a debate over the cost and convenience of electricity generation and distribution systems, electrical safety, and a media/propaganda campaign, with the leading players being the direct current (DC) based on the Thomas Edison Electric Light Company and the supporters of alternating current (AC) based on Nikola Tesla’s inventions backed by Westinghouse.
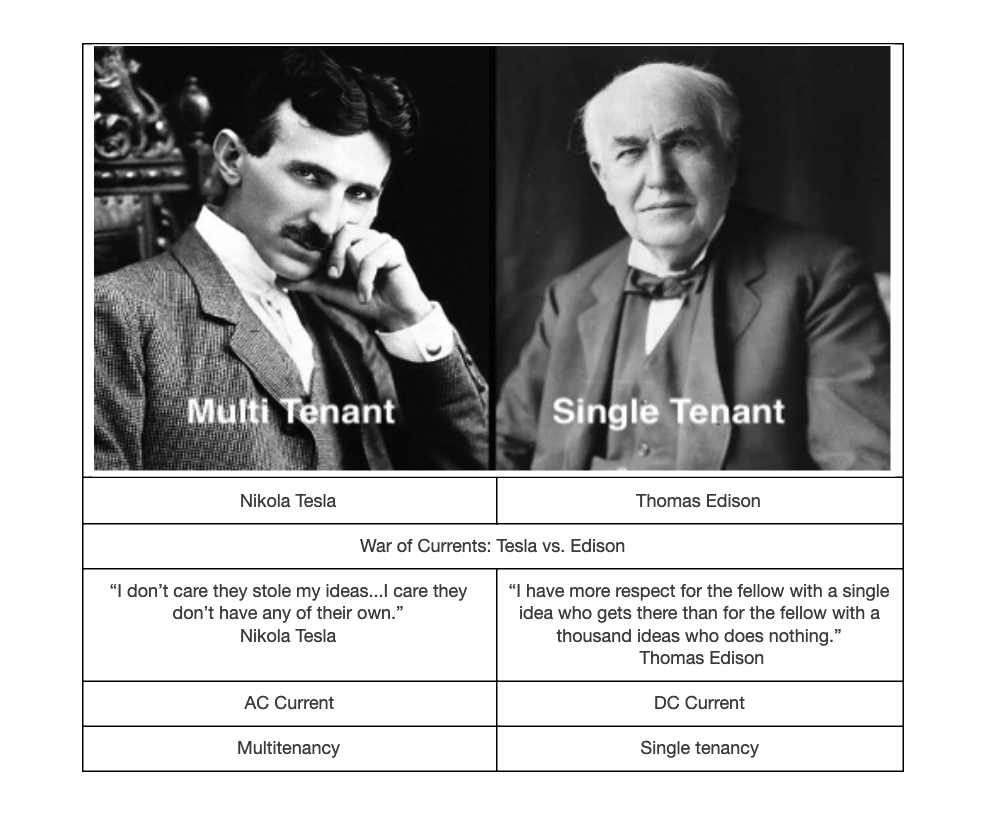
With electricity supplies in their infancy, much depended on choosing the right technology to power homes and businesses across the country. The Edison-led group argued for DC current that required a power generating station every few city blocks (single-tenant model). In contrast, the AC group advocated for a centralized generation with transmission lines that could move electricity great distances with minimal loss (multitenant model).
The lower cost of AC power distribution and fewer generating stations eventually prevailed. Multitenancy is equivalent to AC regarding cost, convenience, and network effect. You can read more about how this analogy relates to SaaS in the book by Nicholas Carr, “Big Switch.” It’s the best read so far about the significance of the shift to multitenant cloud computing. Unfortunately, the ESG/EHS software industry has lagged in adopting multitenancy.
Given these fundamental differences between different modes of delivering software as a service, it is clear that the future lies with the multitenant model.
Whether all customer data is in one or multiple databases is of no consequence to the customer. For those arguing against it, it is like an assertion that companies “do not want to put all their money into the same bank account as their competitors,” when what those companies are doing is putting their money into different accounts at the same bank.
When customers of a financial institution share what does not need to be partitioned—for example, the transactional logic and the database maintenance tools, security, and physical infrastructure and insurance offered by a major financial institution—then they enjoy advantages of security, capacity, consistency, and reliability that would not be affordably deliverable in isolated parallel systems.
Locus has implemented procedures designed to ensure that customer data is processed only as instructed by the customer throughout the entire chain of processing activities by Locus and its subprocessors. Amazon Web Services, Inc. (“AWS”) provides the infrastructure used by Locus to host or process customer data. Locus hosts its SaaS on AWS using a multitenant architecture designed to segregate and restrict customer data access based on business needs. The architecture provides an effective logical data separation for different customers via customer-specific “Organization IDs” and allows customer and user role-based access privileges. The customer interaction with Locus services is operated in an architecture providing logical data separation for different customers via customer-specific accounts. Additional data segregation ensures separate environments for various functions, especially testing and production.
Multitenancy yields a compelling combination of efficiency and capability in enterprise cloud applications and cloud application platforms without sacrificing flexibility or governance.
One of the biggest recent trends we have seen with novice ESG providers (both startups and major software providers new to the field) is a lack of substantial software tools presented. What is lacking is covered up by grandiose statements about the efficacy of their options. These statements are so vague that they could cover anything if you switched out references to ESG with any other nouns, since these providers don’t show their tools transparently.
When selecting an ESG software solution, don’t waste your time with something that either isn’t functional or doesn’t exist. More importantly, your software should have a long track record of usability and be backed by years of expertise. Locus ESG software is proven and is a vital part of the Port Authority of New York and New Jersey’s Clean Construction Program. It also helps Del Monte Foods meet their sustainability goals by improving analyzation and forecasting.
When we look at all the new construction in the next 20 years, we see the critical role embodied carbon plays. The world urgently needs to address carbon emissions from buildings and construction, constituting almost 40% of global carbon emissions. Of those total emissions, building operations are responsible for 28% annually, while building materials and construction (typically referred to as embodied carbon) are responsible for an additional 12% annually.
The construction industry is the world’s largest single industry. Oxford Economics estimates the global construction market at $10.7 trillion in 2020. The market is expected to grow by $4.5 trillion between 2020 and 2030 to reach $15.2 trillion.

Unlike operational carbon emissions, which can be reduced over time with building energy upgrades and the use of renewable and nuclear energy, embodied carbon emissions are locked in place upon completion of construction. The owners and construction industry must handle embodied carbon now if we hope to achieve climate change goals by target dates. Embodied carbon typically precedes Scope 1, 2, and 3 emissions and should be added to those for any new construction.
Achieving zero embodied emissions will require adopting the principles of reusing, reducing, and sequestering, including retrofitting existing buildings, using recycled materials, and designing for deconstruction. Reducing means material optimization and the specification of low to zero carbon materials. Sequester means including the design of carbon sequestering sites and the use of carbon sequestering materials.
Just three materials – concrete, steel, and aluminum – are responsible for 23% of total global emissions (most of the materials used in the built environment). Concrete is the second most-consumed substance on Earth after water. Overall, humanity produces more than 10 billion tons, about 4 billion cubic meters of concrete and cement per year, or about 1.3 tons for every person on the planet, more than any other material, including oil and coal. The consumption of concrete exceeds that of all other construction materials combined. Making modern cement and concrete has a heavy environmental penalty, being responsible for 5% or so of global carbon emissions. And yet, most of those emissions are not accounted for during regular carbon reporting protocols. Steel and aluminum are not much different.
All companies that want to be credible with their carbon reporting need software tools for embodied carbon tracking and management. For this reason, Locus has developed a SaaS application to manage and report embodied carbon data in real-time during construction projects. The Locus Embodied Carbon app, part of the ESG toolset, advances environmentally friendly infrastructure design and increases the ability to track and reduce emissions before being built in the new structure forever.
Locus’s Embodied Carbon management software automates carbon emissions management throughout the design and construction processes. It is one of the most ambitious real-time carbon management software programs in the US. Locus Embodied Carbon app helps site owners, construction companies, and the supply chain reduce embodied carbon from on-site construction activities and reduce air pollution from construction activities.

Locus Embodied Carbon application combines the advantages of Locus Platform’s multitenant SaaS with its powerful configuration tools and APIs that, for example, stream carbon data from construction equipment to online software. The construction industry now has precisely the ESG software solution they need to fit their business processes for the low carbon construction program management to incorporate other EHS compliance and Sustainability data on the same unified platform in the future.
MOUNTAIN VIEW, Calif., 21 December 2021 — Locus Technologies (Locus), industry leader in environmental compliance and ESG software, has been accredited by the Oregon Department of Environmental Quality (DEQ) to provide verification services for mandatory greenhouse gas (GHG) reporting and the Clean Fuels Program (CFP). Locus is the first of a select few to receive approval for verification services.
The accreditation allows Locus to provide verification services for GHG emissions reports, which are now mandatory for facilities in the State of Oregon. The verification team at Locus consists of experts in all reporting requirements. Locus’ in-house Lead Verifiers are certified in all reporting types, including air contamination stationary sources, electricity suppliers, fuel suppliers, natural gas suppliers, natural gas systems, and process emissions. Locus verifiers are also certified for all report types under the Oregon CFP.
The Oregon Environmental Quality Commission (EQC) updated their rules in May 2020 to enhance the data collection of Oregon’s greenhouse gas emissions. The adopted rules incorporate existing reporting and emissions accounting protocols into rule and improve the specificity of how emissions data are calculated, reported, and verified. The regulation requires mandatory reporting and verification of greenhouse gas (GHG) emissions by third-party verifiers like Locus, starting in 2022.
“Locus is proud to become an accredited GHG and CFP verification body for the state of Oregon, as we have been in California since the inception of that program. We are continually committed to staying informed on new and updated ESG reporting frameworks, which we accomplish first and foremost through domain expertise. Our field expertise and industry knowledge allow us to provide a vital service, while also further expanding on our ESG software to support these new reporting programs” said Wes Hawthorne, President of Locus.
Building on over a decade of GHG verification experience, Locus remains the only software provider for collecting, managing, and reporting GHG emissions that is also an accredited verifier. Using this expertise, the software includes unparalleled tools for transparent and auditable calculations for GHG programs.
Is ESG the new gold rush? Some tech giants and startups seem to think so. With each passing day, more and more software providers throw their hat into the burgeoning ESG ring, hoping to cash in. While it’s perfectly reasonable for these companies to seek out profitable endeavors, most of those companies have limited real-world experience with ESG reporting and software. You may want to think twice about trusting your critical ESG reporting to someone looking to ride the wave toward a quick buck.
Locus has been developing and supporting ESG solutions for over two decades, before the ESG acronym ever made its way into headlines and boardrooms. In addition to the years of experience, Locus places great emphasis on domain knowledge, hiring experts in environmental science, engineering, sustainability, and mathematics to name a few. Our solutions are built and supported by these qualified experts, opposed to developers who are frantically cobbling together a solution that they can rush to market.
It takes years to develop a foolproof system for handling massive quantities of complex data. In a recent piece written by President of Locus, Wes Hawthorne, he delves into the importance of having accurate, audit-ready ESG reporting. Data quality and reporting accuracy have been pillars of Locus’ success since our founding in 1997.
Do more for your ESG program than applying a cookie-cutter tool meant to meet the bare-minimum needs of the many or an application that is new and untested, and unfit for your requirements. Our robust solutions help you manage impact, create reports with ease, and meet your ESG goals effectively.
Today is GIS Day, a day started in 1999 to showcase the many uses of geographical information systems (GIS). Earlier blog posts by Locus Technologies for GIS day have shown how GIS supports cutting-edge visualization of objects in space and over time. This year’s post explains how GIS supports augmented reality.
Augmented reality (AR) is a technology that enhances how we experience the real world by overlaying your surroundings with computer-generated objects. It differs from virtual reality (VR) because in VR, everything you see is computer generated, but in AR, the majority of what you see is real – your experience of reality is enhanced (augmented) but not totally replaced.
You are probably familiar with one AR application already if you watch American football. The ‘virtual’ first down line that appears on field before each play is projected there by computer and is not really painted on the field. If you follow soccer (or football to the rest of the world), AR is used by a Video Assistant Referee (VAR) to objectively determine tight offsides decisions. Digital lines are drawn across the field to show whether or not attackers are illegally past the last defender or not. Another AR example is the popular game Pokémon Go that shows cute virtual creatures in your living room or your front yard.
To experience AR, you need something to project the non-real objects onto your view of the world. Many AR applications use mobile phones or other devices. An AR application uses the camera view to show you the world around you and then overlays virtual objects onto the view. Other devices such as head mounted displays, ‘smart glasses’, or even ‘bionic contact lenses’ can use AR, but have not been as popular as phones or other mobile devices. In contrast to AR, VR cannot be fully supported with just a mobile device and usually requires headsets to immerse you in a virtual world. Because of this need, AR is much less intrusive than VR is.
Locus has been exploring environmental uses of AR and GIS by adding AR to Locus Mobile, which is the Locus app for collecting field data, completing EHS audits, tracking waste containers, and completing other tasks requiring users to gather data out of the office. Locus Mobile now features an AR mode to assist users when taking field samples. When the user activates AR mode, the app uses the camera to show the user’s immediate area. The app then puts multiple virtual markers on the display corresponding to sampling points located in that direction. As the user moves or rotates the phone to change the viewing area, the markers change to reflect the locations in the user’s line of sight. Clicking a marker provides more information including the location name and the distance from the user.
Here is a sample image from Locus Mobile showing three nearby sampling locations along with information about past events or measurements at the locations. The three blue banners are the augmented reality displayed on top of the view of the nearby surroundings.
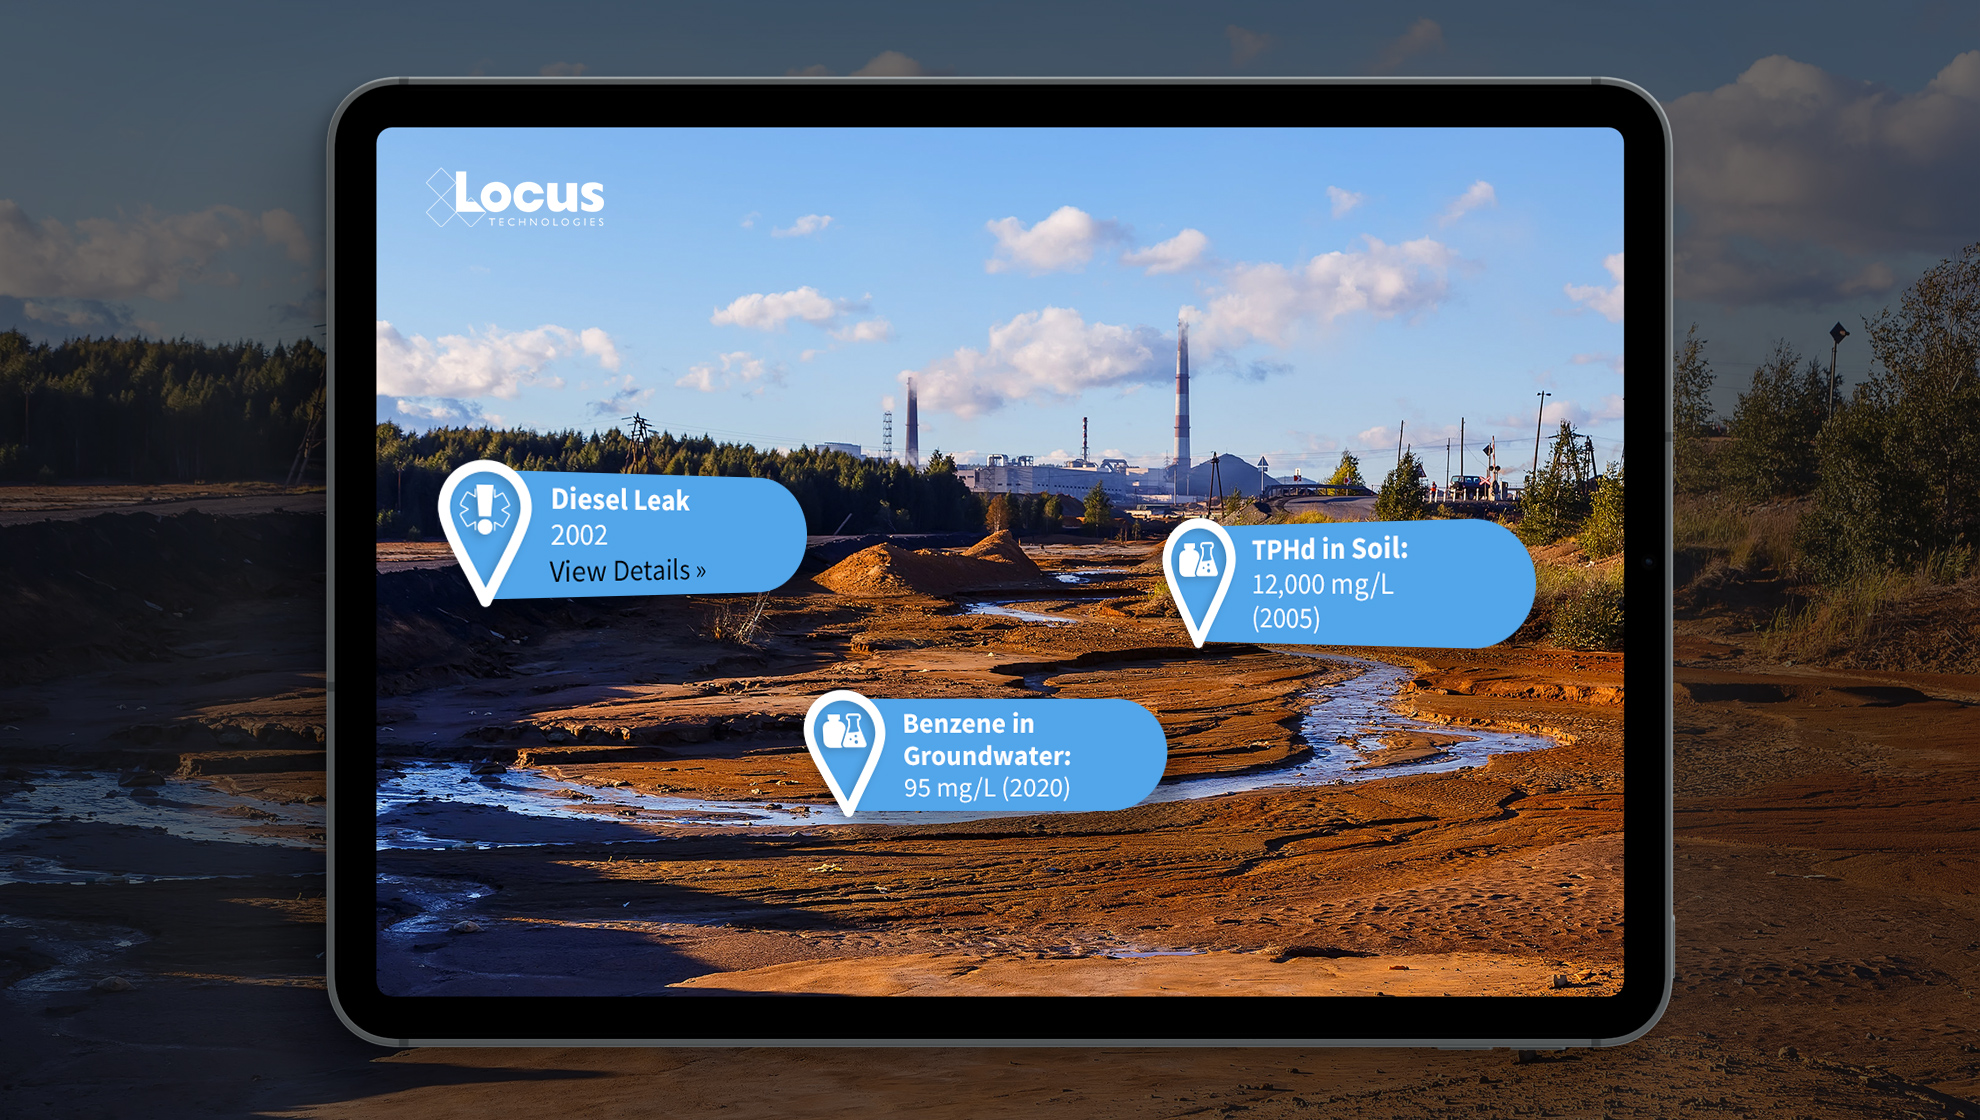
By using GIS and AR to assist users in finding sampling points, Locus Mobile makes field personnel more productive. Samplers can find field locations quickly and can easily pull up related information. Locus continues to explore using AR to expand the functionality of its environmental applications.
Locus GIS+ features all of the functionality you love in EIM’s classic Google Maps GIS for environmental management—integrated with the powerful cartography, interoperability, & smart-mapping features of Esri’s ArcGIS platform!
Learn more about Locus’ GIS solutions.
About the Author—Dr. Todd Pierce, Locus Technologies
Dr. Pierce manages a team of programmers tasked with development and implementation of Locus’ EIM application, which lets users manage their environmental data in the cloud using Software-as-a-Service technology. Dr. Pierce is also directly responsible for research and development of Locus’ GIS (geographic information systems) and visualization tools for mapping analytical and subsurface data. Dr. Pierce earned his GIS Professional (GISP) certification in 2010.
Locus has been preaching on the pitfalls of Excel for a long time. It’s no surprise that one of the worst imaginable errors in Excel that could’ve happened, did. Almost 16,000 COVID-19 cases in England went unreported because Public Health England hit the maximum row count in their version of Excel.
This is not the only example of Excel being misused or being the wrong tool entirely for the job. Excel is not in any way a data management system for complex or vital data. When it comes to sustainability reporting and environmental data management, the evils of the grid are a force to be reckoned with. We have highlighted a few examples that will have you shivering.
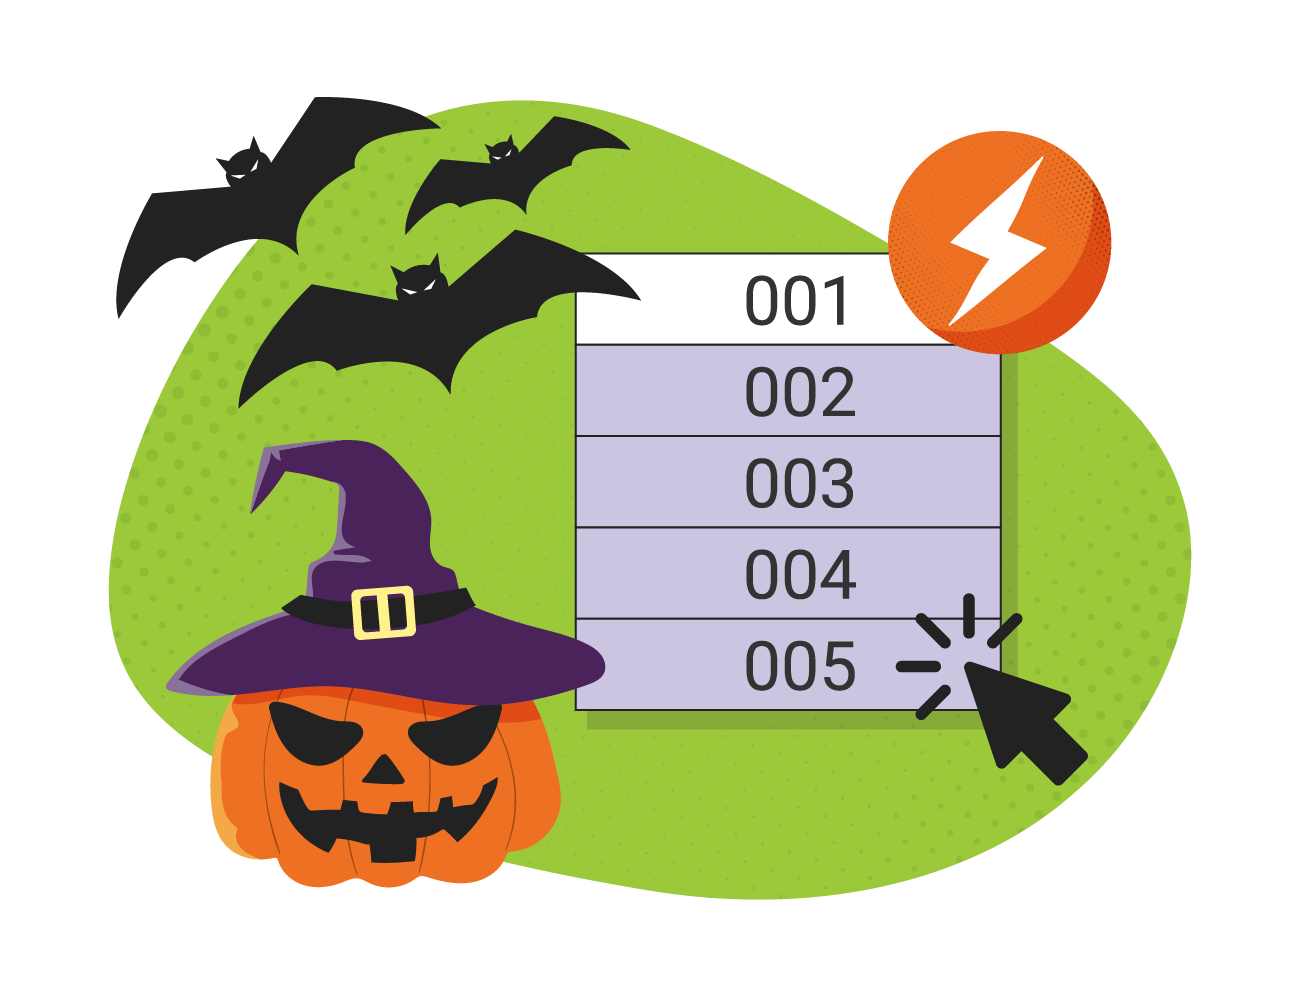
Take a look at this harmless-looking chart. It shows monthly electricity consumption for a facility set to report:
| Month | Monthly Electricity Consumption (MWh) |
| January 2019 | 133,500 |
| February 2019 | 122,400 |
| March 2019 | 138,900 |
| April 2019 | 141,600 |
| May 2019 | 141,601 |
| June 2019 | 141,602 |
| July 2019 | 141,603 |
| August 2019 | 141,604 |
| September 2019 | 141,605 |
| October 2019 | 141,606 |
| November 2019 | 141,607 |
| December 2019 | 141,608 |
During review, the auditor notices a distinct trend from April to December, indicating false data overwritten by a stray double-click. Eventually, the auditor required re-entering all invoice data for dozens of facilities to correct the issue. Where the original data went and how autofill went astray remains a mystery.

Imagine using a massive spreadsheet with lots of linked calculations for your annual sustainability report. One of the team engineers works on the file to input more data and get it ready for presentation. But in the final steps, they accidentally delete one of the formulas that sum up the indicators. The annual total looks great for the presentation since you’ve effectively removed a portion of your resource consumption, but afterwards you discover the conclusions were incorrectly calculated. How did that error get introduced? The spreadsheet has no auditing capabilities on the individual values, so you may never know.
Excel supports multiple users editing one document simultaneously, but not well. Multiple records are saved, edits are lost, and vital data vanishes, or at best is very hard to recover. The Track Changes feature is not infallible, and over reliance on it will cause hardship.
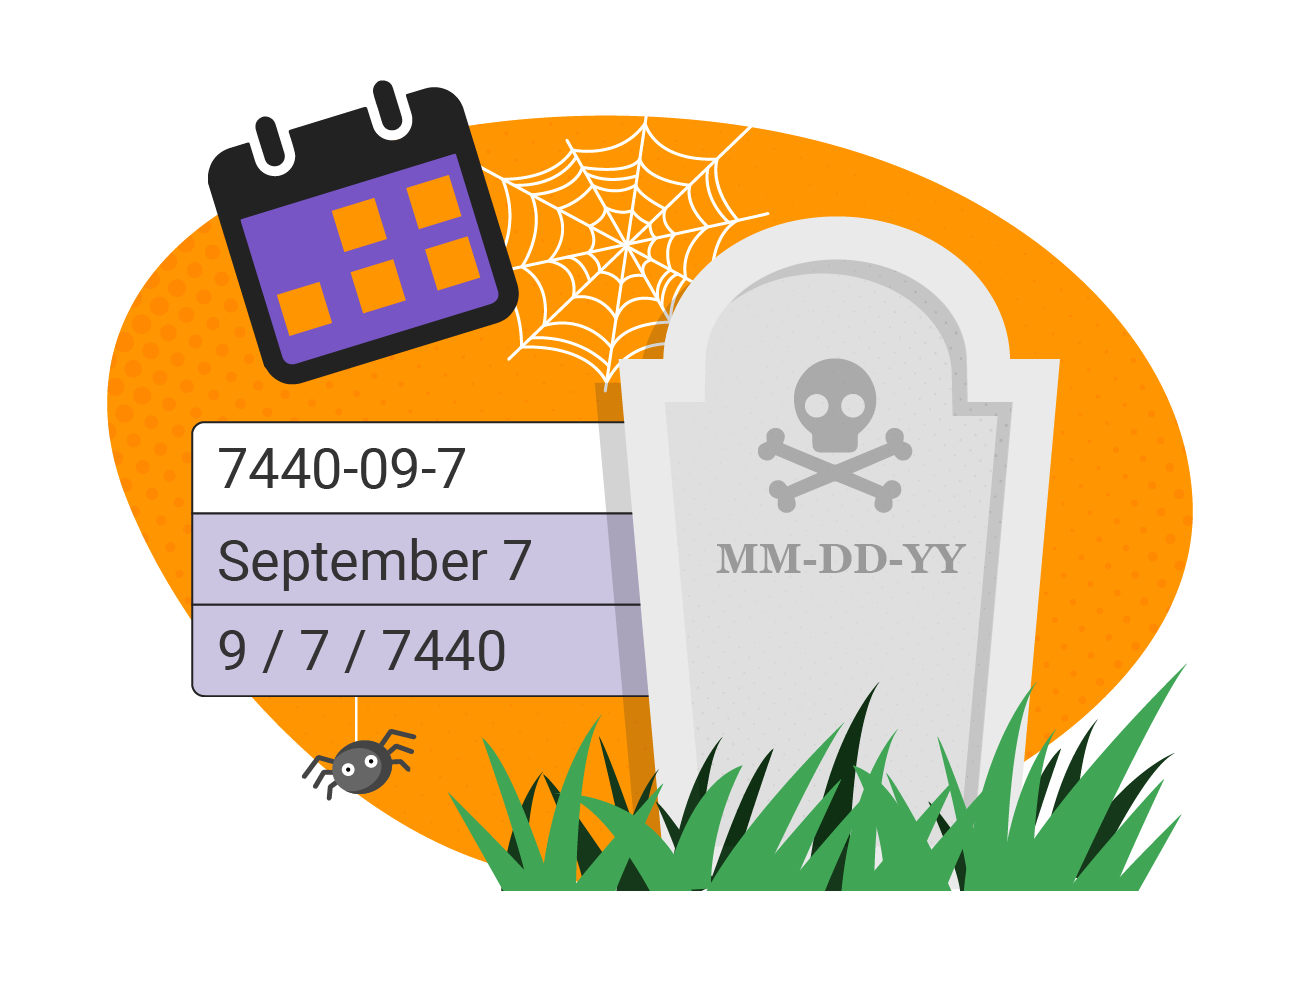
Excel has a frustrating insistence of changing CAS numbers into dates, even if they are something like “7440-09-7″ turning into September 7, 7400. If you’re not explicit in your cell formatting, Excel isn’t happy leaving values as they are.

You meant to type 1.5, but you typed “1..5” or “.1.5”. Does Excel reject these imposter numbers or let you know of a potential error? No, it’s stored in Text format. This can throw off any averages or sums you may be tracking. This minor identity theft can cause a real headache.
Other data quality issues with using Excel include, but are not limited to:
As you can see, the horrors of Excel are common, and terrifying. Without a proper system of record, auditing features, and the ability for data to vanish into the ephemera, Excel offers little in the way of data security and quality for organizations managing vital environmental and compliance data. Many are learning firsthand the superiority of database management systems over spreadsheets when it comes to managing data. Now is the time to examine the specific shortcomings of your current system and consider your options.
The ability to visualize your field and analytical data across maps, logs, and charts is a crucial part of managing environmental information. Locus makes it easy to visually display and export data for sharing in reports and presentations. We’ve compiled 7 of the most useful visualization tools in our environmental information management software.
View your data in easy-to-read text boxes right on your maps. These are location-specific crosstab reports listing analytical, groundwater, or field readings. A user first creates a data callout template using a drag-and-drop interface in the EIM enhanced formatted reports module. The template can include rules to control data formatting (for example, action limit exceedances can be shown in red text). When the user runs the template for a specific set of locations, EIM displays the callouts in the GIS+ as a set of draggable boxes. The user can finalize the callouts in the GIS+ print view and then send the resulting map to a printer or export the map to a PDF file.
Locus GIS features high-quality and industry specific graduated symbols so that you can compare relative quantitative data on customizable maps. Choose graduated symbol intervals, sizes, and colors from a large selection of color ramps and create multiple layers for data analysis. It also features a location clustering option, ideal for large sites, a historical challenge for mapping.
Multiple charts can be created in EIM at one time. Charts can then be formatted using the Format tab. Formatting can include the ability to add milestone lines and shaded date ranges for specific dates on the x axis. The user can also change font, legend location, line colors, marker sizes and types, date formats, legend text, axis labels, grid line intervals or background colors. In addition, users can choose to display lab qualifiers next to non-detects, show non-detects as white filled points, show results next to data points, add footnotes, change the y-axis to log scale, and more. All of the format options can be saved as a chart style set and applied to sets of charts when they are created.
Locus has adopted animation in its GIS+ solution, which lets a user use a “time slider” to animate chemical concentrations over time. When a user displays EIM data on the GIS+ map, the user can decide to create “time slices” based on a selected date field. The slices can be by century, decade, year, month, week or day, and show the maximum concentration over that time period. Once the slices are created, the user can step through them manually or run them in movie mode.
Locate and identify inspection and/or monitoring locations on your mobile device. View real-time and historical environmental data to quickly find areas of interest for your chemical and subsurface data. Use your camera to get precise geotagged information for spills, safety incidents, historical chemical sources, subsurface utilities, or any other type of EHS data.
Create and display clickable boring logs of your sample data—using custom style formats and cross-sections. Show depth ranges, lithology patterns, aquifer information, and detailed descriptions for your samples.
Create and visualize custom contours using multiple algorithms. Because visualizations let you chunk items together, you can look at the ‘big picture” and not get lost in tables of data results. Your working memory stays within its capacity, your analysis of the information becomes more efficient, and you can gain new insights into your data.
Locus Technologies » Applications » Page 27
299 Fairchild Drive
Mountain View, CA 94043
P: +1 (650) 960-1640
F: +1 (415) 360-5889
Locus Technologies provides cloud-based environmental software and mobile solutions for EHS, sustainability management, GHG reporting, water quality management, risk management, and analytical, geologic, and ecologic environmental data management.
