Locus EIM SaaS environmental software selected by Hudbay Minerals

The Locus EIM SaaS with integrated GIS mapping will streamline environmental field and analytical data management and reporting for Hudbay Minerals

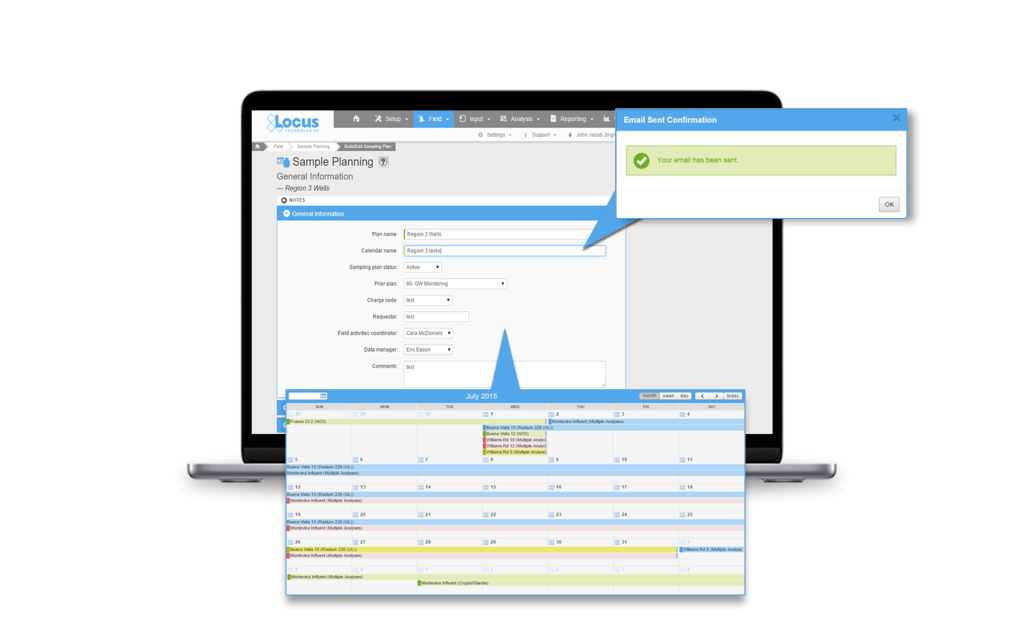
MOUNTAIN VIEW, Calif., 19 June 2018 — Locus Technologies (Locus), the industry leader in multi-tenant SaaS EHS and environmental management software, is pleased to announce that Hudbay Minerals, a premier mining company in Canada, will use Locus EIM to improve their environmental data management for field and analytical data reporting. In addition to the standard features of Locus EIM, Hudbay Minerals is opting to use Locus’ GIS+ mapping solution, Locus Mobile for iOS, and the robust LocusDocs document management solution to enhance and streamline their processes.

Locus EIM and the integrated GIS+ solution will help Hudbay Minerals to improve efficiency of sampling and monitoring activities for both field and analytical data. The SaaS solution is enhanced by Locus Mobile for field data collection, which works offline without any internet connection.

“The Hudbay team in Arizona looks forward to working with the Locus team and using the system,” said Andre Lauzon, Vice President, Arizona Business Unit at Hudbay.

“By using the powerful smart mapping technology of Locus GIS+, powered by Esri and integrated with all the functionalities of Locus EIM, Hudbay Minerals can save data queries as map layers to create more impactful visual reports,” said Wes Hawthorne, president of Locus Technologies.

12 ways commercial SaaS can save your complex environmental data (part 1/4)

Do you currently use a system of Excel spreadsheets to store your environmental data? If so, ask yourself the following questions:

  • Do you find yourself having to make the same changes in multiple spreadsheets?
  • Is your spreadsheet growing unwieldy and difficult to manage?
  • Are you finding that you’re spending more and more time scrolling through your spreadsheet, looking for specific information?
  • Do you have to jump through hoops to view specific subsets of data?
  • Do multiple people sometimes need access to the data at the same time? Or, are your colleagues continually asking you to provide them with copies or subsets of the data in your spreadsheet?
  • Are there redundancies in your data? Is the same information repeated on multiple rows of your spreadsheet?
  • Do you ever encounter erroneous entries that have been typed in by hand?
  • Are you concerned about the long-term security of your data?
  • Do you often wonder exactly where your data are?
  • Does someone else really own your data (perhaps your IT department)?

If you answer “yes” to any of these questions, you might be outgrowing your homegrown system of Excel spreadsheets.  It may be time to consider a more mature tool to manage and store your environmental data.

The advantages of databases over spreadsheets for managing complex data

Before we look at other options, let’s examine the differences in how data are stored and managed in spreadsheets and databases.

A spreadsheet consists of rows and columns. At the intersection of each are cells that store data values. Some cells can refer to other cells, and some cells can perform processing on other individual (or groups of) cell values.

In contrast, a database is made up of named tables that contain records. Each record has columns in which values are stored.  Each table stores information on a particular type of entity. For environmental data, this could be field samples, sampling locations, analytical results, regulatory limits, or laboratory methods. Typically, one or more columns in each record store values that uniquely identify an instance of the entity. In the case of a field sample, this could be the “field sample ID”; for a location, the “location ID”.

Complex data - Excel spreadsheets

Locus user tips
In Locus EIM, Site ID is also part of the primary key for locations and field samples to accommodate customers with multiple waste sites, facilities, or water systems.

As we move to analytical or field measurements, we have to use more columns to uniquely identify a record (e.g., date, time, field sample or location ID, parameter). The remaining columns in a table that are not part of the “primary key” identify other attributes of the entity.  For samples, these attributes include sample date and time, sample matrix, sample purpose, sampling event, sampling program, etc.

If you think of a data table as a grid with rows and columns, it seems very similar to a spreadsheet—but there’s a fudamental difference. With a spreadsheet, how you view or report the data is dictated by how it appears in the spreadsheetWYSIWYG. If you need to view the data differently, you must reformat the spreadsheet.  In contrast, you can view information stored in a database (or serve it up in a report) in multiple ways that doesn’t necessarily depend on how the data is stored in the underlying tables.

Databases, which are often referred to by the acronym DBMS (Database Management Systems), offer many other advantages over spreadsheets when dealing with complex data.

Here are 12 key areas where databases—especially cloud databases built for industry-specific needs—surpass their spreadsheet counterparts.

Locus user tips
Pay close attention to section 2 on “Data quality”. Over the years, Locus has helped many of our customers move their data from spreadsheets into Locus EIM. Invariably, these migrations have unearthed many data issues that went undetected until we had to map and move the data into Locus EIM.

12 reasons why commercial SaaS databases are ideal

If, at the end of this guide, you’re still not convinced of the advantages of databases over spreadsheets for data storage, consider Microsoft’s recommendations as to when to use its low-end DBMS (Access) and when to use Excel.

Microsoft emphasizes that Excel can store large amounts of data in worksheets. However, it notes that Excel is not intended to serve as a database, but is optimized for data analysis and calculation.

According to Microsoft:

Use Access when you:

  • Anticipate many people working in the database and you want robust options that safely handle updates to your data, such as record locking and conflict resolution.
  • Anticipate the need to add more tables to a dataset that originated as a flat or nonrelational table.
  • Want to run complex queries.
  • Want to produce a variety of reports or mailing labels.

Use Excel when you:

  • Require a flat or nonrelational view of your data instead of a relational database that uses multiple tables, and when your data is mostly numeric.
  • Frequently run calculations and statistical comparisons on your data.
  • Want to perform sophisticated “what-if” analysis operations on your data, such as statistical, engineering, and regression analysis.
  • Want to keep track of items in a simple list, either for personal use or for limited collaboration purposes.

In this 4-part blog series, we’ll explore in detail each of the 12 key areas where cloud-based environmental databases excel over home-grown spreadsheets.

Let’s get started!


1) Data entry is better with databases

Complex data - Data entryIf you use spreadsheets to manage your environmental information, how do you get data into it?

If you’re collecting the same information every week, month, quarter, or year, perhaps you have a template that you use. You might fill in only the data fields that change from one event to another, then append the rows in this template to an existing worksheet, or insert them into a new one. Alternatively, you might copy a set of rows in your spreadsheet, and then edit any fields with values that have changed.

In the case of analytical data, if you don’t have to type in the data manually, perhaps your lab provides data in a spreadsheet that mirrors the structure of your spreadsheet, allowing you to cut and paste it without edits.

Each of these methods of entering data has limitations and risks:

  • Manual entry inevitably introduces errors, unless someone is independently checking every entry for accuracy.
  • Copying and editing are notoriously prone to mistakes. It is too easy to overlook fields that should be updated in the copied records.
  • Getting a lab to send you data in a spreadsheet whose structure mirrors yours can be problematic, even more so if you deal with different labs for different types of analyses. Even then, there is no check on the validity of the laboratories’ entries.
    • Are all date and number fields actually the correct data types?
    • Do all required fields have values in them?

Databases provide various means of data input.  Two of the most commonly used methods are form entry (for when you need to enter a few records at a time) and EDDs (Electronic Data Deliverables), used for uploading text files containing tens, hundreds, or even thousands of data records in text or zipped files.

Flexible form configuration as a standard database feature

Databases provide unlimited flexibility in designing forms—with searchable lookup fields, advanced form controls, sophisticated styling, context-sensitive help, data validation, event handlers, and the ability to conditionally display individual or blocks of fields, based on the user’s selections.

Locus user tips
Locus EIM offers over 30 forms for entering and editing water systems, locations, sample collection, chains of custody, analytical data, field measurements, water levels, boreholes, well construction and other information. All of these input forms have multiple dropdown list boxes for the display of lookup values and online help.  You can easily hide unused forms for your organization to simplify the system interface and menu structure.

Better, faster batch data loading with EDDs

The real strength of databases comes about from their ability to load and process EDDs. Each record in an EDD typically consists of 10-50 fields (e.g., in the case of laboratory analyses: Field Sample ID, Analytical Method, Analysis Date, Lab Result, Units, etc.).  The data in these EDDs can be checked for incorrect data types, missing required values, entries that are restricted by lookup tables or LOVs (Lists of Values), and duplicates.

Locus user tips
Locus EIM’s powerful EDD loader can upload and error check several thousand records in under a minute. Labs need not all use the same format – the data will still end up in the same place in the database.  In fact, Locus EIM even has a special lab interface so (with your permission) your labs can upload their own EDDs.  This lab interface shows only a very small part of Locus EIM, namely the EDD Loader and selected LOVs that lab users would need to know.


Make sure to read the entire series to find out about 12 reasons commercial SaaS databases excel at managing complex environmental data!


About the author—Gregory Buckle, PhD, Locus Technologies

Gregory Buckle, PH.D.Dr. Buckle has more than 30 years of experience in the environmental field, most of which have been devoted to the design, development, and implementation of environmental database management systems. When he joined Locus in 1999, he was responsible for building and deploying Locus’ cloud-based EIM software. He was also instrumental in customizing EIM for the water utility industry and developing EIM’s powerful Sample Planning and Data Validation modules. The latest iteration of the Sample Planning module that Dr. Buckle built is currently being used by Los Alamos National Laboratory and San Jose Water Company to plan and schedule thousands of samples per year.


About the author—Marian Carr, Locus Technologies

Marian CarrMs. Carr is responsible for managing overall customer solution deployments and customer relationships with Locus’ government accounts. Her career at Locus includes heading the product development team of the award-winning cloud-based environmental ePortal solution as well as maintaining and growing key customer accounts with Locus’ Fortune 100 enterprise deployments. In addition, Ms. Carr was instrumental in driving the growth and adoption of the Locus EIM platform with key federal and water organizations.


Have a question about Locus’ cloud-based environmental software?

    First name

    Last name

    Email address

    Phone number

    Company

    Job title

    Tell us about your company's needs

    Locus is committed to preserving your privacy.

    EHS Compliance Software: The difference between configurability and customization

    As you shop around for EHS compliance software, you’re quite likely to hear two similar words: “configurable” and “customizable.” You might hear these two words in answer to your question, “Can your software do _______ ?” Your implementation success will depend on which of the two words you put more weight in your selection of the vendor. Therefore, it is important to understand the difference between these two similar words.

    Configurable means the software can do what you’re asking it to do “out of the box” with a few simple keystrokes. The software is designed to be easily modified by the end user (user developer) who has no programming background. For example, if exceeding water quality limit for a certain parameter in your software is called an “exceedance” but your new water utility customer is using the term “outlier”, configurable software lets you change the word on the form from “exceedance” to “outlier” without any programming or recompiling of the code involved, and without needing assistance from your software vendor. Often, the software will feature configuration options or a configuration workbench where you simply input all such terms and titles from a series of dropdown menus or drag-and-drop functionality. In other words, features and functions of the software are configurable if they are part of the off-the-shelf product.

    Customization is a completely different feature. Unlike configurability, customization requires additional software programming (expensive), typically performed by software developers. Customizing software often incurs additional expense to the client. It also takes longer time and requires you to execute a change order—never a pleasant process.

    Understanding the difference between configurability and customization also brings awareness of the total cost of ownership (TCO) of your EHS software. Configurability is rolled into the software and has no additional fees. Customization requires expensive programming, usually for an additional charge (think “change order”). It is good practice to ask your software vendor upfront which features are configurable and which are customizable. The entire focus of EHS software selection should be on configurability.

    I have seen many customers and their consultants and research analysts make a cardinal mistake by focusing on software features and functionality that exist in the software off-the-shelf without asking a single question about configurability. No wonder so many EHS software implementations fail or cost orders of magnitude more than the winning bid. It is not about features and functionality that exist in existing EHS applications, but it is about how easy it is to add, build, or configure features, functionality, or whole new applications that may not be present today using non-developers. It is about the flexibility of the platform, not about the rigidity of applications.


    Locus Platform EHS configuration workbench custom workflows


    When you’re selecting configurable EHS software, make sure to consider this: If you have domain expertise in EHS and you know how to build a PowerPoint presentation, or you can draw a flowchart, or you can build a spreadsheet using formulae, with sorting tables and charts, then you can build any feature and functionality into your EHS software—provided the software is configurable off-the-shelf.

    To put it in simple terms, you are a user developer. You will save your company lots of money and headache and avoid tons of change orders. I should also note that most of the end-user configurable software is built on multi-tenant SaaS architecture and offers drag-and-drop functionality.

    Locus application support services for configurable EHS software

    Aquam Corporation selects Locus Technologies software for IoT integration

    Aquam Corporation integrates Locus software to Orbis Intelligent Systems platform, ensuring a robust, reliable, and secure data platform

    MOUNTAIN VIEW, Calif., 5 June 2018 — Locus Technologies (Locus), a leader in multi-tenant Software-as-a-Service (SaaS) for environmental compliance and sustainability management, will provide its IoT integration capability to Aquam Corporation (“Aquam”), a global provider of risk mitigation technologies for water and energy transmission and distribution assets, to create a robust data platform for its customers via Orbis Intelligent Systems.  The Locus software will be integrated with the Orbis platform to allow interconnectivity across multiple devices, data streams, and geographical locations.

    Orbis Intelligent Systems is positioned to be a market leader in infrastructure and water quality data-driven monitoring for commercial, domestic and utility applications.

    “We chose Locus software for the reliability and data security that enables our technology platform to operate with robust, data-driven communication for all Aquam customers around the world to utilize. With the integration of rapidly scalable Locus software, we are at the forefront of IoT and well-positioned to offer asset ‘active management’—a core value to our customers and value proposition,” said Danny Krywyj, president for Orbis.

    Locus Technologies’ multi-tenant cloud platform can help organizations to manage, organize, and monitor the structured and unstructured data coming from various sources.  This allows customers to create a centralized data repository to analyze the key indicators for environmental data management, sustainability, and environmental compliance.

    “Aquam Corporation will reap the benefits of IoT integration for monitoring data  generated by different streaming devices, by centrally connecting these sources in a scalable cloud-based application for better managing compliance. Real-time monitoring of data directly and effectively solves many challenges related to smarter environmental management and sustainability initiatives,” said Wes Hawthorne, president of Locus Technologies.


    ABOUT AQUAM CORPORATION

    Aquam Corp is a global provider of technology solutions for water and energy distribution infrastructure. We ensure the health, longevity, safety, and reliability of vital resources for water and gas utility, municipal, commercial, residential, and industrial markets. Our award-winning proprietary technologies address water scarcity issues by the diagnosis, cleaning, and remediation of aging infrastructure. Aquam also provides end-to-end service solutions and technologies for the maintenance, life extension, and full rehabilitation of network distribution infrastructure, which include: Nu Flow Technologies, a leader in small-diameter infrastructure rehabilitation technologies; Specialized Pipe Technologies (SPT), a pipe assessment and rehabilitation services provider; Aquam Pipe Diagnostics, a global pipeline assessment specialist.  Aquam services are available in North America, South America, Europe, Africa, Australasia, and the Middle East. For more information visit www.aquamcorp.com or contact aquam@missionC2.com.

    Locus is ready for e-Manifest

    EPA is establishing a national system for tracking hazardous waste shipments electronically. This system, known as “e-Manifest,” will modernize the nation’s cradle-to-grave hazardous waste tracking process. EPA is on schedule to launch e-Manifest on June 30, 2018.


    e-Manifest infographic

    Download the latest fact sheets for e-Manifest stakeholders.
    These fact sheets provide an overview of the e-Manifest program and the impacts it will have on each stakeholder. Each fact sheet outlines basic information about the e-Manifest system, how the specific stakeholder will be impacted, and what actions they need to take to use the e-Manifest system.

    [sc_button link=”https://www.locustec.com/applications/ehs-compliance/waste-management/” text=”Learn more about Locus’ Waste Management application” link_target=”_self” color=”ffffff” background_color=”52a6ea”]

    Have a question about Locus’ e-Manifest support?

      First name

      Last name

      Email address

      Phone number

      Company

      Job title

      Tell us about your company's needs

      Locus is committed to preserving your privacy.

      Locus Technologies to offer its EHS multi-tenant SaaS Locus Platform on Amazon Web Services

      Locus and AWS will simplify and expand how customers capture, analyze and take action on EHS compliance and sustainability activities

      MOUNTAIN VIEW, Calif., 24 April 2018 — Locus Technologies (Locus), a leader in multi-tenant Software-as-a-Service (SaaS) environmental compliance and sustainability management, today announced it will offer its award-winning EHS Locus Platform SaaS on Amazon Web Services (AWS). Locus announced it will deliver Locus SaaS services designed to simplify and expand how customers capture, analyze and take action on their data and EHS compliance activities. Additionally, Locus announced that the AWS US West (Oregon) Region will be the first new AWS Region supported in Locus’ planned international infrastructure expansion on AWS. Locus’ customers will be able to use the company’s core service—including Locus Platform and more—delivered on AWS, with general availability expected in May 2018. Locus Environmental Information Management (EIM) will be moved to AWS in early 2019.

      Locus also plans to deliver integrations that will connect the Locus Platform with AWS Internet of Things (IoT), Amazon CloudFront, and Amazon Virtual Private Cloud (Amazon VPC). Locus intends to leverage AWS IoT by building a new native integration to help businesses generate value from the billions of events generated by connected devices such as real-time environmental monitoring sensors and environmental treatment systems controls.

      AWS IoT is a set of cloud services that let connected devices easily and securely interact with cloud applications like Locus Platform and other devices. Locus IoT Cloud will connect with AWS IoT to combine device data with customer data in Locus Platform, allowing businesses to create meaningful customer experiences based on real-time activity and emissions monitoring across all their connected sensors and devices.

      For example, a water utility company that maintains millions of IoT-enabled sensors for water flow, pressure, pH, or other water quality measuring devices across their dispersed facilities can use AWS IoT combined with Locus Platform as a whole solution to ingest and manage the data generated by those sensors and devices, and interpret it in real time. By combining water sensor data from AWS IoT with Locus IoT customer data, the water utility company will be able to automatically create an emergency shutdown if chemical or other exceedances or device faults are detected and will be better prepared to serve their customers.

      By combining the powerful, actionable intelligence and rapid responsiveness through Locus Platform with the scalability and fast-query performance of AWS, customers can seamlessly analyze large datasets on arrival in real time. This will allow Locus’ customers to instantly explore information, find insights, and take actions from a greater variety and volume of data—all without investing the significant time and resources required to administer a self-managed on-premises data warehouse.

      Locus Platform offers a highly configurable, user-friendly interface to fully meet individual organizations’ environmental management needs.  “Locus Platform, when combined with the power and security of AWS, can improve companies’ data collection, analysis, and most importantly, reporting capabilities, resulting in streamlined EH&S compliance and the mitigation of regulatory risks and fines.”  said Wes Hawthorne, President, Locus Technologies.

      Shape of Water: Cape Town running out of drinking water

      The city cut daily water use limits first to 87 liters and then 50 in a bid to avert shutting off supplies.

      The city had set a 50-liter daily limit and had told citizens “Day Zero” was approaching when people would have to queue at standpipes.
      But water-saving efforts in the South African city have seen the day pushed back from April to 27 August. Seasonal rains should mean that date is now averted, the city said. The shortages follow three years of low rainfall. The city had resorted to increasingly drastic measures to clamp down on water usage, including “naming and shaming” the 100 addresses using the most water and fining residents who failed to comply with the 50 liters (13 gallons) limit per person.

      By comparison, the average California consumer uses some 322 liters (85 gallons) of water per day. Water use in California was highest in the summer months of June through September, where it averaged 412 liters per person per day. By comparison, during the cooler and wetter months of January through March of 2016, average per capita water use was only 242 liters per person per day.

      Although the risk that piped water supplies will be shut off this year has receded, politicians and environmentalists warn that the water crisis is there to stay in Cape Town, as year-on-year rainfall levels dwindle.

      Shipping industry to discuss cuts in CO2 emissions

      International shipping produces about 1,000 million tons of CO2 annually – that’s more than the entire German economy.

      A meeting of the International Maritime Organisation in London that starts tomorrow will discuss how shipping industry can radically reduce its CO2 emissions. The shipping industry, if it does not change the way it operates, will contribute almost a fifth of the global total of CO2 by 2050. A group of nations led by Brazil, Saudi Arabia, India, Panama, and Argentina is resisting CO2 targets for shipping. Their submission to the meeting says capping ships’ overall emissions would restrict world trade. It might also force goods on to less efficient forms of transport. This argument is dismissed by other countries which believe shipping could benefit from a shift towards cleaner technology. European nations are proposing to shrink shipping emissions by 70-100 percent of their 2008 levels by 2050.

      The problem has developed over many years. As the shipping industry is international, it evades the carbon-cutting influence of the annual UN talks on climate change, which are conducted on a national basis. Instead, the decisions have been left to the IMO; a body recently criticized for its lack of accountability and transparency. The IMO did agree on a design standard in 2011 ensuring that new ships should be 30 percent more efficient by 2025. But there is no rule to reduce emissions from the existing fleet.

      The Clean Shipping Coalition, a green group focusing on ships, said shipping should conform to the agreement made in Paris to stabilize the global temperature increase as close as possible to 1.5C. The pressure is on the IMO to produce an ambitious policy. The EU has threatened that if the IMO doesn’t move far enough, the EU will take over regulating European shipping. That would see the IMO stripped of some of its authority.

      Some say huge improvements in CO2 emissions from existing ships can be easily be made by obliging them to travel more slowly. They say a carbon pricing system is needed.

      WM Symposia 2018 provided an excellent showcase for Locus GIS+ in LANL’s Intellus website

      At the annual WM Symposia, representatives from many different DOE sites and contractors gather once a year and discuss cross-cutting technologies and approaches for managing the legacy waste from the DOE complex.  This year, Locus’ customer Los Alamos National Laboratory (LANL) was the featured laboratory.  During their presentation, they discussed Locus GIS+, which powers Intellus, their public-facing environmental monitoring database website.

      If you haven’t been to LANL’s Intellus website recently, you are in for a surprise!  It was recently updated to better support casual users, and it features some of the best new tools Locus has to offer.  Locus reimagined the basic query engine and created a new “Quick search” to streamline data retrieval for casual users.  The guided “Quick search” simplifies data queries by stepping you through the filter selections for data sources, locations, dates, and parameters, providing context support at each step along the way.

      Intellus - quick searchWhile a knowledgeable environmental scientist may be able to easily navigate a highly technical system, that same operation is bound to be far more difficult for a layperson interested in what chemicals are in their water.  Constructing the right query is not as simple as looking for a chemical in water—it really matters what type of water you want to look within.  On the Intellus website (showing the environmental data from the LANL site), there are 16 different types of water (not including “water levels”).  Using the latest web technologies and our domain expertise, Locus created a much easier way to get to the data of interest.

      Just querying data is not necessarily the most intuitive activity to gain insights.  Locus integrated our new GIS+ visualization engine to allow users to instantly see all the data they just queried in detailed, context-rich maps.

      Intellus GIS+ Map

      Intellus GIS+ map showing “Quick search” query results for chromium levels in the LANL area

      Instead of a dense data grid, GIS+ gives users an instant visual representation of the issue, enabling them to quickly spot the source of the chemicals and review the data in the context of the environmental locations and site activities.  Most importantly for Intellus users, this type of detailed map requires no GIS expertise and is automatically created based on your query.  This directly supports Intellus’ mission to provide transparency into LANL’s environmental monitoring and sampling activities.

      GIS+ also allows users (albeit with a bit more experience in GIS mapping) to integrate maps from a wide range of online sources to provide even more insight to the available data.  In the example below, we overlaid the publicly-available US Fish and Wildlife critical habitat maps with data from the LANL site to show the relationship of the site to critical habitats.  This type of sophisticated analysis is the future of online GIS.  Locus takes full advantage of these opportunities to visualize and integrate data from varying sources with our GIS+ tools, made simple for users and integrated with ArcGIS Online by Esri.

      Intellus GIS+ Map

      Intellus GIS+ map showing imported layers of US Fish and Wildlife critical habitats in relation to LANL environmental sampling data

      WM 2018 - Sean and Nita

      Overall, Locus is very proud of our cross-cutting environmental information management tools.  We were one of many WM18 attendees enjoying LANL’s presentation and getting even more ideas from the audience on the next steps for better environmental visualization.

      [sc_button link=”https://www.locustec.com/wp-content/uploads/2018/03/WM-18-PPT.pdf” text=”View a copy of the presentation” link_target=”_blank” color=”ffffff” background_color=”52a6ea”]

      Webinar: IoT technology for enhanced environmental compliance

      IoT is considered one of the fastest growing trends in technology and has a potentially huge impact to automate how we manage water quality, air emissions and other key environmental performance indicators for data monitoring.