Industrial Controls that Stand the Test of Time
In December of 2024, Dan Ducasse, Locus Technologies’ longest-serving employee retired after contributing to the company’s growth and evolution for 28 years.
In December of 2024, Dan Ducasse, Locus Technologies’ longest-serving employee retired after contributing to the company’s growth and evolution for 28 years.
When looking for a GHG reporting program, there is one element that is typically overlooked. This short video gives us more insight.
When looking for a GHG reporting program, there is one element that is typically overlooked. This short video gives us more insight.
How did Locus succeed in deploying Internet-based products and services in the environmental data sector? After several years of building and testing its first web-based systems (EIM) in the late 1990s, Locus began to market its product to organizations seeking to replace their home-grown and silo systems with a more centralized, user-friendly approach. Such companies were typically looking for strategies that eliminated their need to deploy hated and costly version updates while at the same time improving data access and delivering significant savings.
Several companies immediately saw the benefit of EIM and became early adopters of Locus’s innovative technology. Most of these companies still use EIM and are close to their 20th anniversary as a Locus client. For many years after these early adoptions, Locus enjoyed steady but not explosive growth in EIM usage.
E. M. Roger’s Diffusion of Innovation (DOI) Theory has much to offer in explaining the pattern of growth in EIM’s adoption. In the early years of innovative and disruptive technology, a few companies are what he labels innovators and early adopters. These are ones, small in number, that are willing to take a risk, that is aware of the need to make a change, and that are comfortable in adopting innovative ideas. The vast majority, according to Rogers, do not fall into one of these categories. Instead, they fall into one of the following groups: early majority, late majority, and laggards. As the adoption rate grows, there is a point at which innovation reaches critical mass. In his 1991 book “Crossing the Chasm,” Geoffrey Moore theorizes that this point lies at the boundary between the early adopters and the early majority. This tipping point between niche appeal and mass (self-sustained) adoption is simply known as “the chasm.”
Rogers identifies the following factors that influence the adoption of an innovation:
In its early years of marketing EIM, some of these factors probably considered whether EIM was accepted or not by potential clients. Our early adopters were fed up with their data stored in various incompatible silo systems to which only a few had access. They appreciated EIM’s organization, the lack of need to manage updates, and the ability to test the design on the web using a demonstration database that Locus had set up. When no sale could be made, other factors not listed by Rogers or Moore were often involved. In several cases, organizations looking to replace their environmental software had budgets for the initial purchase or licensing of a system but had insufficient monies allocated for recurring costs, as with Locus’s subscription model. One such client was so enamored with EIM that it asked if it could have the system for free after the first year. Another hurdle that Locus came up against was the unwillingness of clients at the user level to adopt an approach that could eliminate their co-workers’ jobs in their IT departments. But the most significant barriers that Locus came up against revolved around organizations’ security concerns regarding the placement of their data in the cloud.
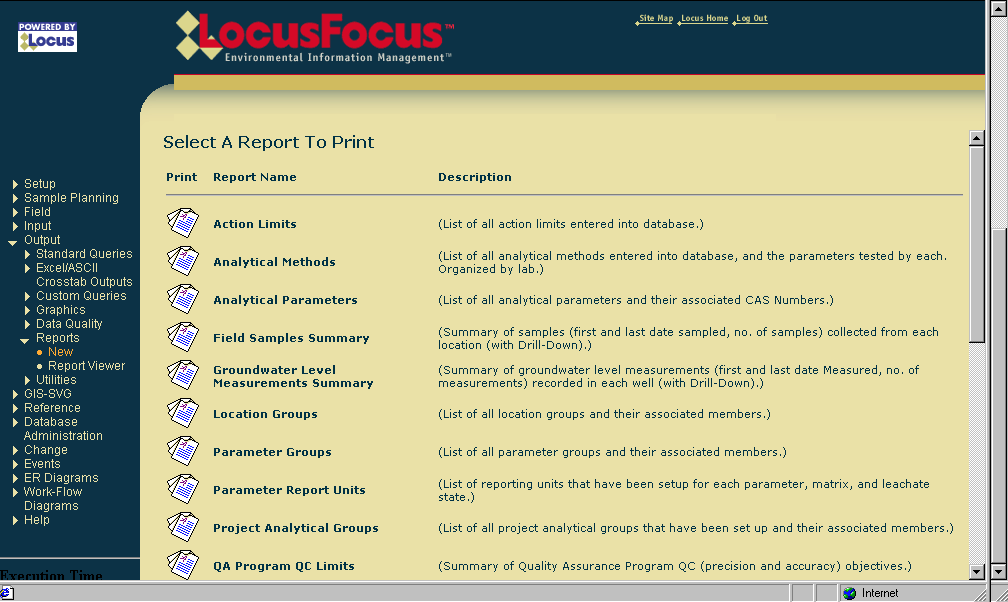
One of the earliest versions of EIM
Oh, how so much has changed in the intervening years! The RFPs that Locus receives these days explicitly call out for a web-based system or, much less often, express no preference for a web-based or client-server system. We believe this change in attitudes toward SaaS applications has many root causes. Individuals now routinely do their banking over the web. They store their files in Dropbox and their photos on sites like Google Photos or Apple and Amazon Clouds. They freely allow vendors to store their credit card information in the cloud to avoid entering this information anew every time they visit a site. No one who keeps track of developments in the IT world can be oblivious to the explosive growth of Amazon Web Services (AWS), Salesforce, and Microsoft’s Azure. We believe most people now have more faith in the storage and backup of their files on the web than if they were to assume these tasks independently.
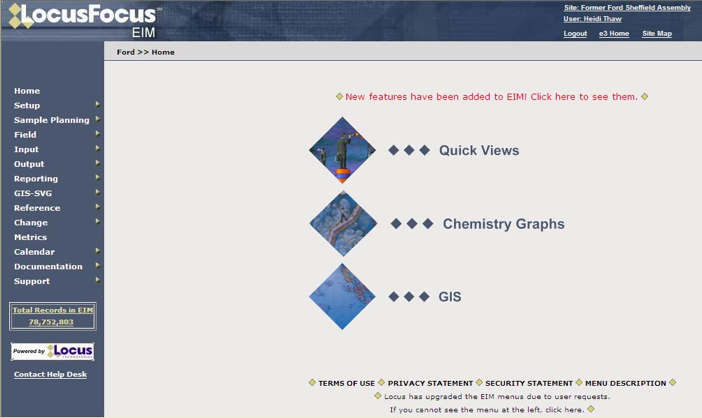
An early update to EIM software
Changes have also occurred in the attitudes of IT departments. The adoption of SaaS applications removes the need to perform system updates or the installation of new versions on local computers. Instead, for systems like EIM, updates only need to be completed by the vendor, and these take place at off-hours or at announced times. This saves money and eliminates headaches. A particularly nasty aspect of local, client-server systems is the often experienced nightmare when installing an updated version of one application causes failures in others that are called by this application. None of these problems typically occur with SaaS applications. In the case of EIM, all third-party applications used by it run in the cloud and are well tested by Locus before these updates go live.
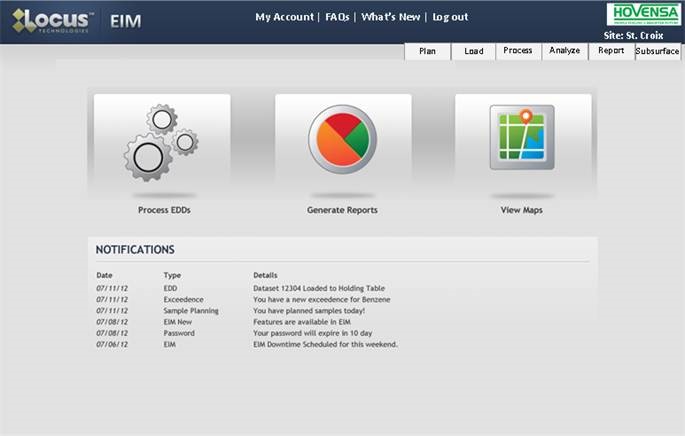
Locus EIM continues to become more streamlined and user friendly over the years.
Yet another factor has driven potential clients in the direction of SaaS applications, namely, search. Initially, Locus was primarily focused on developing software tools for environmental cleanups, monitoring, and mitigation efforts. Such efforts typically involved (1) tracking vast amounts of data to demonstrate progress in the cleanup of dangerous substances at a site and (2) the increased automation of data checking and reporting to regulatory agencies.
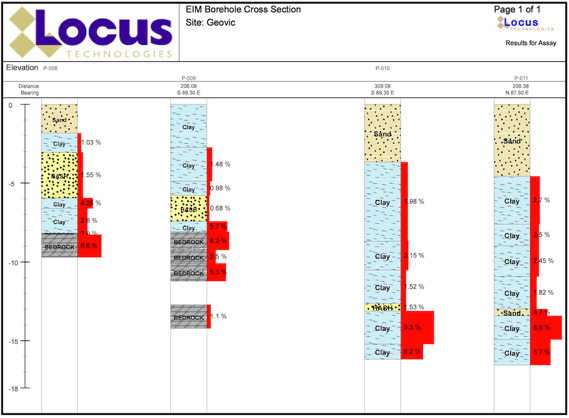
Locus EIM handles all types of environmental data.
Before systems like EIM were introduced, most data tracking relied on inefficient spreadsheets and other manual processes. Once a mitigation project was completed, the data collected by the investigative and remediation firms remained scattered and stored in their files, spreadsheets, or local databases. In essence, the data was buried away and was not used or available to assess the impacts of future mitigation efforts and activities or to reduce ongoing operational costs. Potential opportunities to avoid additional sampling and collection of similar data were likely hidden amongst these early data “storehouses,” yet few were aware of this. The result was that no data mining was taking place or possible.
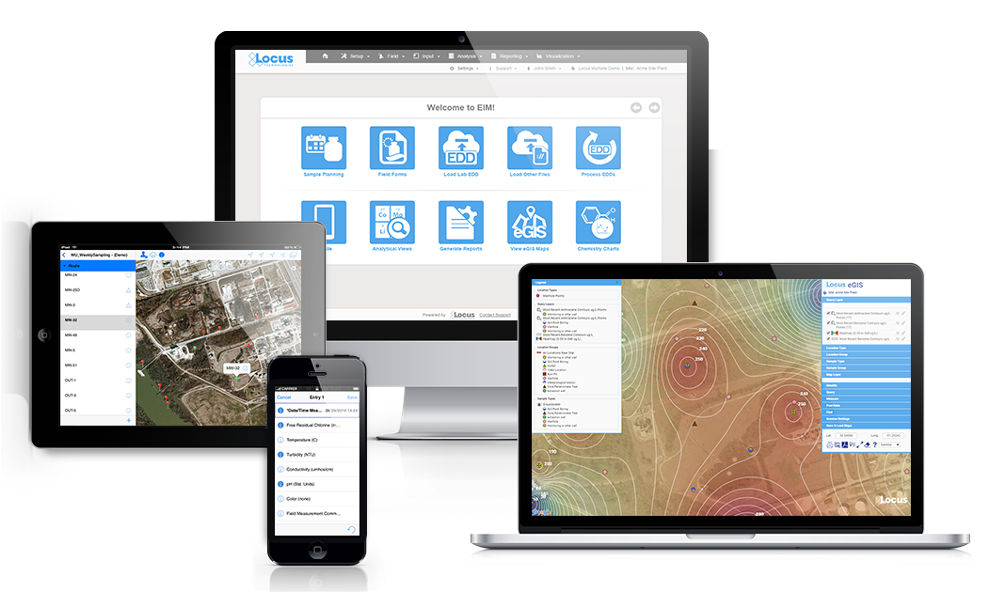
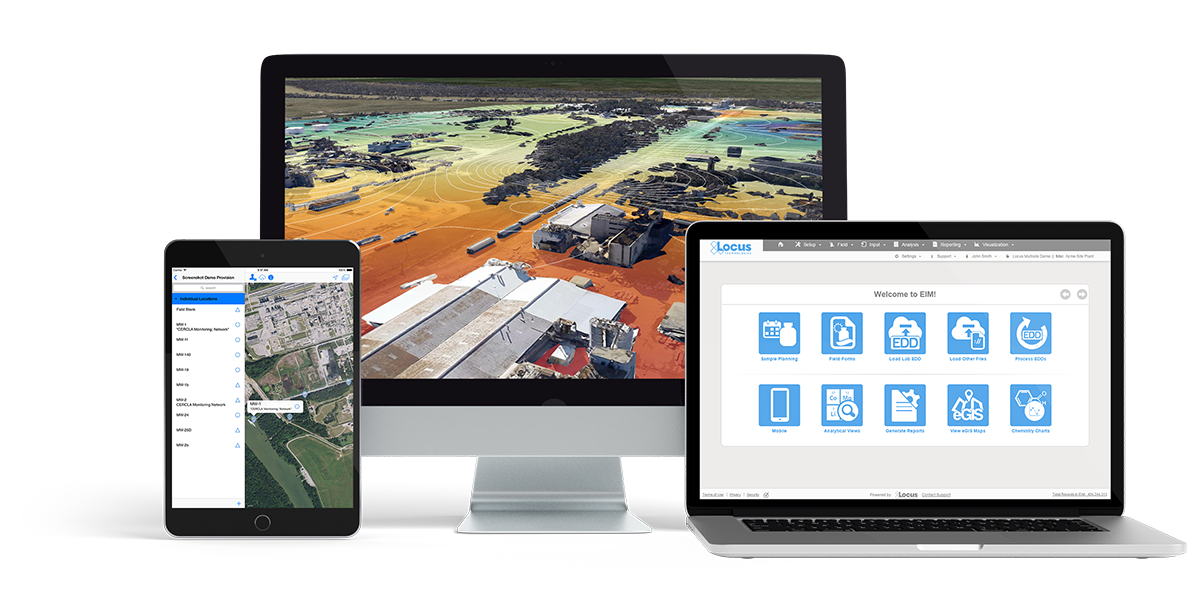
Locus EIM in 2022
The early development of EIM took place while searches on Google were relatively infrequent (see years 1999-2003 below). Currently, Google processes 3.5 billion searches a day and 1.2 trillion searches per year. Before web-based searches became possible, companies that hired consulting firms to manage their environmental data had to submit a request such as “Tell me the historical concentrations of Benzene from 1990 to the most recent sampling date in Wells MW-1 through MW-10.” An employee at the firm would then have to locate and review a report or spreadsheet or perform a search for the requested data if the firm had its database. The results would then be transmitted to the company in some manner. Such a request need not necessarily come from the company but perhaps from another consulting firm with unique expertise. These search and retrieval activities translated into prohibitive costs and delays for the company that owned the site.

Google Searches by Year
Over the last few decades, everyone has become dependent on and addicted to web searching. Site managers expect to be able to perform their searches, but honestly, these are less frequent than we would have expected. What has changed are managers’ expectations. They hope to get responses to requests like those we have imagined above in a matter of minutes or hours, not days. They may not even expect a bill for such work. The bottom line is that the power of search on the web predisposes many companies to prefer to store their data in the cloud rather than on a spreadsheet or in their consultant’s local, inaccessible system.
The world has changed since EIM was first deployed, and as such, many more applications are now on the path, that Locus embarked on some 20 years ago. Today, Locus is the world leader in managing on-demand environmental information. Few potential customers question the merits of Locus’s approach and its built systems. In short, the software world has caught up with Locus. EIM and LP have revolutionized how environmental data is stored, accessed, managed, and reported. Locus’ SaaS applications have long been ahead of the curve in helping private, and public organizations manage their environmental data and turn their environmental data management into a competitive advantage in their operating models.
We refer to the competitive advantages of improved data quality and flow and lower operating costs. EIM’s Electronic Data Deliverable (EDD) module allows for the upload of thousands of laboratory results in a few minutes. Over 60 automated checks are performed on each reported result. Comprehensive studies conducted by two of our larger clients show savings in the millions gained from the adoption of EIM’s electronic data verification and validation modules and the ability of labs to load their EDDs directly into a staging area in the system. The use of such tools reduces much of the tedium of manual data checking and, at the same time, results both in the elimination of manually introduced errors and the reduction of throughput times (from sampling to data reporting and analysis). In short, the adoption of our systems has become a win-win for companies and their data managers alike.
This is the second post highlighting the evolution of Locus Technologies over the past 25 years. The first can be found here. This series continues with Locus at 25 Years: Locus Platform, Multitenant Architecture, the Secret of our Success.
MOUNTAIN VIEW, CA and LOS ALAMOS, N.M., 21 April 2022 —
A significant software improvement is driving enhanced decision-making on N3B Los Alamos’ environmental cleanup at Los Alamos National Laboratory (LANL).
Samples collected of soil, sediment, water and other parts of the environment potentially contaminated by historical LANL operations now receive faster and more comprehensive validation due to software tool improvements made by N3B and leading environmental software provider Locus Technologies.
The improved software functionality is part of a database containing all data associated with environmental cleanup at LANL. N3B implements the legacy portion of that cleanup on behalf of the U.S. Department of Energy’s Environmental Management Los Alamos Field Office. Legacy cleanup involves the remediation of contamination from Manhattan Project and Cold War era weapons development and government-sponsored nuclear research.
The software improvement ensures more thorough validation of results from third-party analytical laboratories that analyze collected samples for various contaminants, which may include metals, radionuclides, high explosives, and human-made chemicals used in industrial solvents, known as volatile organic compounds.
The types of contaminants potentially found in these samples, along with levels of contamination, guide N3B’s cleanup.
“Decisions on legacy environmental cleanup are based on the validity and quality of this analytical data, including the nature and extent of contamination, how much we clean up, and how well the interim remediation measure is working to mitigate migration of the hexavalent chromium groundwater plume,” said Sean Sandborgh, sample and data management director at N3B. “If you have lapses in the quality of analytical data, that could have negative effects on our program’s decision-making capacity.”
Once N3B personnel collect samples from potentially contaminated sites, they send them to a third-party laboratory for analysis. When N3B receives the results of those samples, they perform a validation process to demonstrate data is sufficient in quality and supports defensible decision-making.
“Validation consists of determining the data quality and the extent to which external analytical laboratories accurately and completely reported all sample and quality control results,” Sandborgh said.
The process can catch data quality issues that may result from incorrect calibration of equipment in a laboratory or issues inherent in the samples, such as improper preservation or temperature control, that mask detection of contaminants.
With the improved functionality, more of the validation process is automated, instead of manually conducted, which means a lower likelihood of errors.
Another crucial improvement is the ability to evaluate sample results containing radioactive material at lower activity concentrations, which provides quick information on the potential for low levels of radionuclide activity.
The improved functionality is also being used by LANL’s management and operating contractor, Triad, and will soon be used by the New Mexico Environment Department Oversight Bureau.
The software improvement saved N3B 265 hours of labor and more than $25,000 in taxpayer dollars since its launch nearly one year ago.
“As we’ve done for the past 25 years, Locus is committed to continually improving our solutions for the often costly and complex data review process,” said Locus Technologies President Wes Hawthorne. “We are proud to enable a data-forward approach with a focus on accuracy that results in confident and correct decisions.”
“The quality and defensibility of environmental data generated from sampling activities is a key component of an effective remediation process,” said Sandborgh. “When the automated data review is used in conjunction with manual examination of sample data packages, we meet and exceed our data quality requirements.”
ABOUT N3B Los Alamos
N3B manages the 10-year, $1.4 billion Los Alamos Legacy Cleanup Contract for the U.S. Department of Energy Environmental Management’s Los Alamos Field Office. N3B is responsible for cleaning up contamination that resulted from LANL operations before 1999. N3B personnel also package and ship radioactive and hazardous waste off-site for permanent disposal.
The ability to visualize your field and analytical data across maps, logs, and charts is a crucial part of managing environmental information. Locus makes it easy to visually display and export data for sharing in reports and presentations. We’ve compiled 7 of the most useful visualization tools in our environmental information management software.
View your data in easy-to-read text boxes right on your maps. These are location-specific crosstab reports listing analytical, groundwater, or field readings. A user first creates a data callout template using a drag-and-drop interface in the EIM enhanced formatted reports module. The template can include rules to control data formatting (for example, action limit exceedances can be shown in red text). When the user runs the template for a specific set of locations, EIM displays the callouts in the GIS+ as a set of draggable boxes. The user can finalize the callouts in the GIS+ print view and then send the resulting map to a printer or export the map to a PDF file.
Locus GIS features high-quality and industry specific graduated symbols so that you can compare relative quantitative data on customizable maps. Choose graduated symbol intervals, sizes, and colors from a large selection of color ramps and create multiple layers for data analysis. It also features a location clustering option, ideal for large sites, a historical challenge for mapping.
Multiple charts can be created in EIM at one time. Charts can then be formatted using the Format tab. Formatting can include the ability to add milestone lines and shaded date ranges for specific dates on the x axis. The user can also change font, legend location, line colors, marker sizes and types, date formats, legend text, axis labels, grid line intervals or background colors. In addition, users can choose to display lab qualifiers next to non-detects, show non-detects as white filled points, show results next to data points, add footnotes, change the y-axis to log scale, and more. All of the format options can be saved as a chart style set and applied to sets of charts when they are created.
Locus has adopted animation in its GIS+ solution, which lets a user use a “time slider” to animate chemical concentrations over time. When a user displays EIM data on the GIS+ map, the user can decide to create “time slices” based on a selected date field. The slices can be by century, decade, year, month, week or day, and show the maximum concentration over that time period. Once the slices are created, the user can step through them manually or run them in movie mode.
Locate and identify inspection and/or monitoring locations on your mobile device. View real-time and historical environmental data to quickly find areas of interest for your chemical and subsurface data. Use your camera to get precise geotagged information for spills, safety incidents, historical chemical sources, subsurface utilities, or any other type of EHS data.
Create and display clickable boring logs of your sample data—using custom style formats and cross-sections. Show depth ranges, lithology patterns, aquifer information, and detailed descriptions for your samples.
Create and visualize custom contours using multiple algorithms. Because visualizations let you chunk items together, you can look at the ‘big picture” and not get lost in tables of data results. Your working memory stays within its capacity, your analysis of the information becomes more efficient, and you can gain new insights into your data.
The Vapor Intrusion tools in Locus’ Environmental Information Management (EIM) software solve the problem of time-consuming monitoring, reporting, and mitigation by automating data assembly, calculations, and reporting.
Quickly and easily generate validated reports in approved formats, with all of the calculations completed according to your specific regulatory requirements. Companies can set up EIM for its investigation sites and realize immediate cost and time savings during each reporting period.
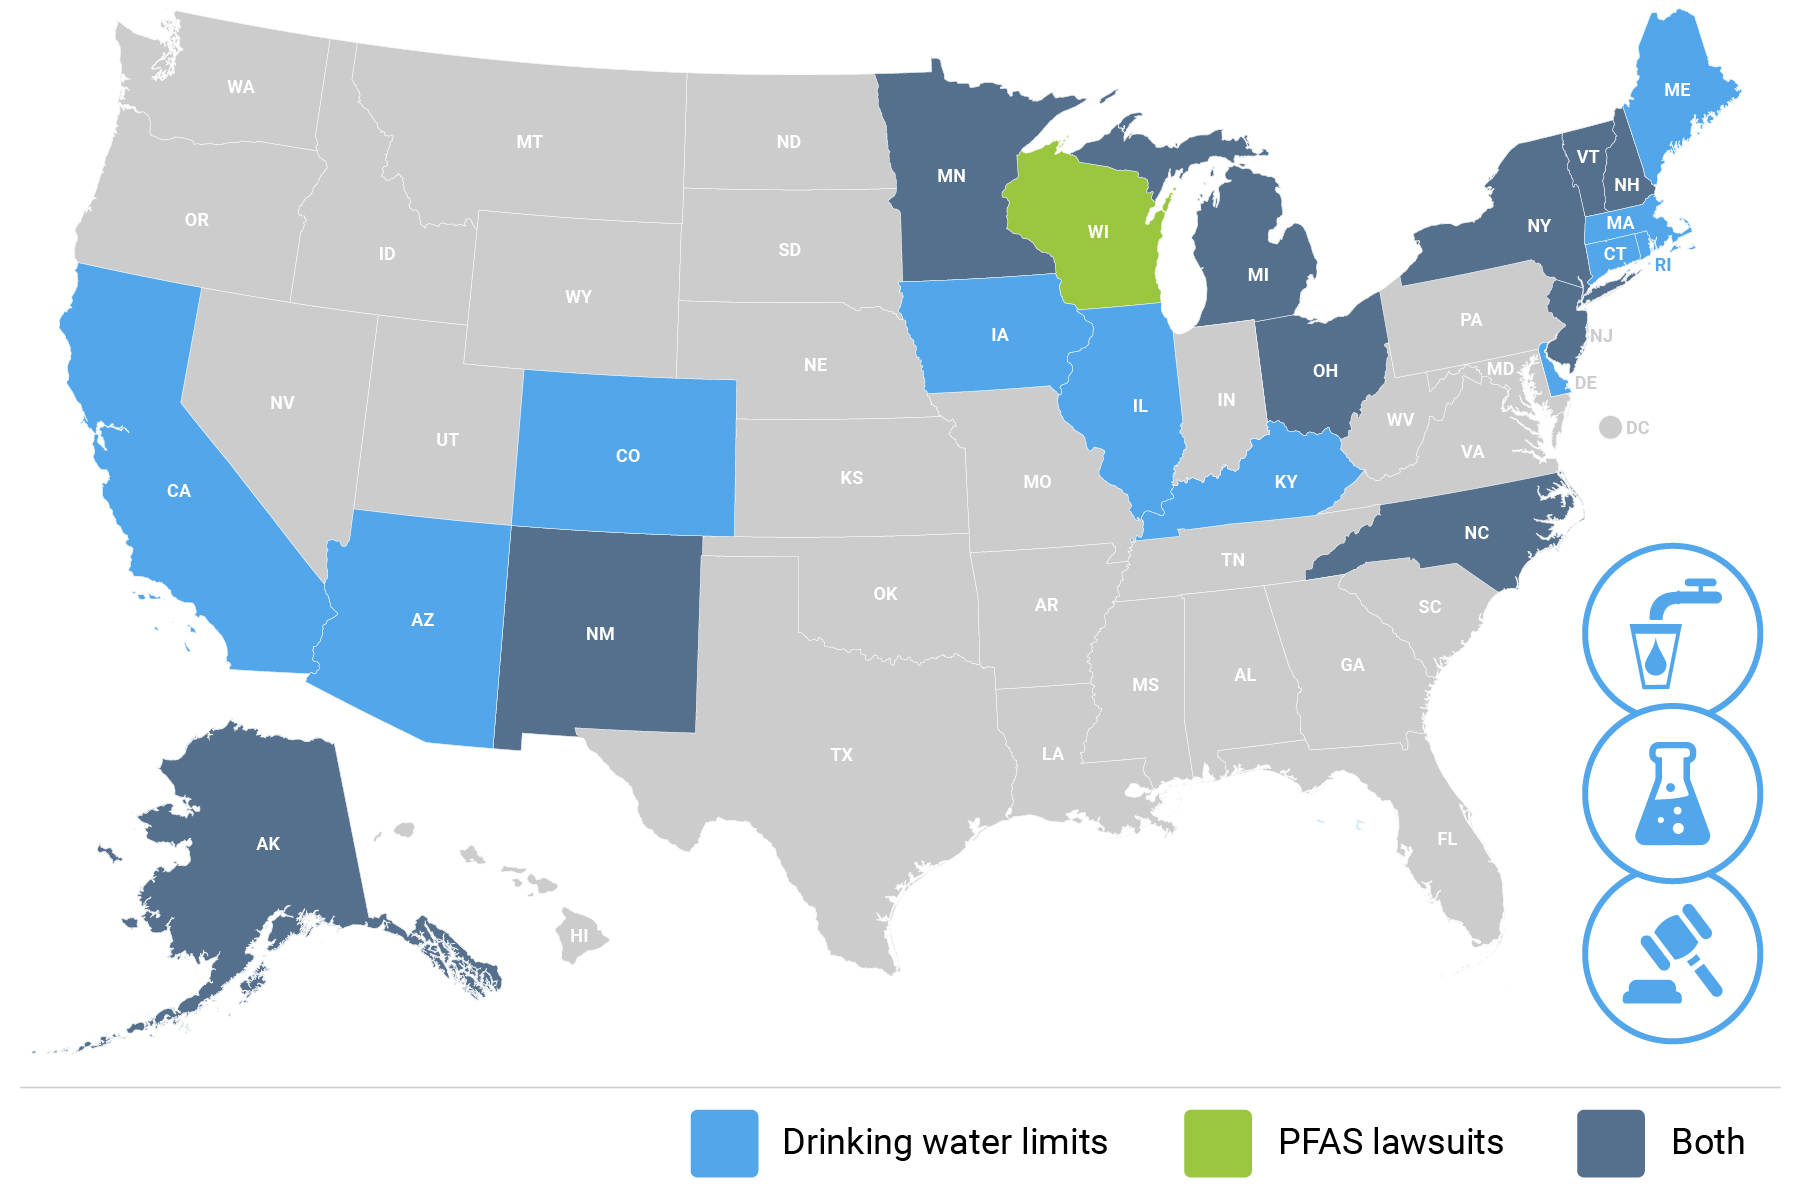
PFAS chemicals were first invented in the 1930s and have since been used in several applications from non-stick coatings to waterproof fabrics to firefighting foams. In recent years, PFAS studies and research funding have increased remarkably, but as of right now the EPA has yet to implement regulations on the chemicals. Many states have leapfrogged the EPA by implementing regulations on PFAS use, safe PFAS levels in drinking water, and by suing manufacturers of PFAS chemicals. This creates a complex set of regulatory requirements, depending on where you operate.
Updated August 30, 2021
Locus offers software solutions for PFAS management and tracking. Our EHS software features tools to manage multiple evolving regulatory standards, as well as sample planning, analysis, validation, and regulatory reporting—with mobile and GIS mapping functionality. Simplify tracking and management of PFAS chemicals while improving data quality and quality assurance. With future PFAS regulations being an inevitability, the time is right to adopt a software that can track and manage these and other chemicals.
MOUNTAIN VIEW, CA–(Marketwired – February 02, 2016) — Locus Technologies announced today that Environmental Business Journal (EBJ), a business research publication which provides high value strategic business intelligence to the environmental industry, granted the company the 2015 award for Information Technology in the environmental and sustainability industry for the tenth year running.
Locus was recognized for continuing its strategic shift to configurable Multitenant pure Software as a Service (SaaS) EHS solutions and welcoming new, high profile customers. In 2015 Locus scored record revenue from Cloud software with annual growth over 20 percent. Locus also achieved a record renewal rate of 99 percent and signed up new customers including Shell Oil Company, Philips 66, Ameresco, California Dairies, Cemex, Frito-Lay, Genentech, Lockheed Martin, PPG Industries, United Airlines and US Pipe & Foundry. Locus also became the largest provider of SaaS environmental software to the commercial nuclear industry; currently over 50 percent of U.S. nuclear generating capacity uses Locus’ flagship product. Locus’ configurable Locus Platform gained momentum in 2015 with new implementations in the manufacturing, agricultural and energy sectors, including a major contract with Sempra Energy for greenhouse gas management and reporting.
“Locus continues to influence the industry with its forward-thinking product set, pure SaaS architecture, and eye for customer needs,” said Grant Ferrier, president of Environmental Business International Inc. (EBI), publisher of Environmental Business Journal.
“We are very proud and honored to receive the prestigious EBJ Information Technology award in environmental business for a tenth time. We feel it is a testament to our unwavering commitment and dedication to accomplish this level of recognition, especially now as we lead the market by providing robust solutions for the emerging space of cloud and mobile-based environmental information management,” said Neno Duplan, President and CEO of Locus Technologies.
The 2015 EBJ awards will be presented at a special ceremony at the Environmental Industry Summit XIV in San Diego, Calif. on March 9-11, 2016. The Environmental Industry Summit is an annual three-day executive retreat hosted by EBI Inc.
How do companies currently handle and store their environmental information?
Managing an environmental project (contaminated site, emission source, or GHG inventory) is similar to making a Hollywood movie, with one difference: duration. A movie is usually made in few months, whereas an environmental project typically spans years or decades.
The work involved in investigating, remediating or monitoring of contaminated or emissions sites is almost universally performed by outside consulting firms. Large companies rarely “put all their eggs in one basket,” choosing instead to apportion their environmental work amongst several to 10, 20, or even more consulting firms. The actual work at a particular site is generally managed and performed by the nearest local office of the firm that has been assigned to the site.
At larger production facilities such refinery or a Superfund site, the environmental work is likely to span 10, 20, or 30 years while monitoring may continue even longer. Over this period of time, investigations are planned, samples collected, reports written, remedial designs created, and following agency approval, one or more remedies may be implemented. Not only is turnover in personnel commonplace, but owing to the rebidding of national contracts, the firm assigned to do the work typically changes multiple times over the life span of a remedial project.
The investigation of a single large, potentially contaminated site often requires the collection of hundreds or even thousands of samples. A typical sample may be tested for the presence of several hundreds of chemicals, and many locations may be sampled multiple times per year over the course of many years. The end result is an extraordinary amount of information. Keep in mind that this is just for one site. Large companies with manufacturing and/or production facilities often have anywhere from a few to several hundred sites. Those that also have a retail component to their operations (e.g., oil companies) can have thousands of sites. Add to this list compliance and reporting data, engineering studies, real time emission monitoring, and the amount of data becomes staggering and unmanageable by conventional databases and spreadsheets. Given the magnitude and importance of this information, one would expect environmental data management to be a high priority item in the overall strategy of any company subject to environmental laws and regulations. But this is not so; instead, our surveys of the industry reveal that a large portion of information sits in spreadsheets and home-built databases. In short, you have an entire industry with billions in liability making decisions using tools that are not up to the task. Robust databases are standard tools in other industries – but for whatever reason, the environmental business has failed to fully embrace them.
As a result, many organizations and governmental agencies are simply “flying blind” when it comes to managing their environmental information.
The lack of standards and inconsistencies in information management practices among the firms performing environmental work for a company impose a significant cost on the company’s overall environmental budget. The fact that some firms may use spreadsheets, others their own databases, and still other various commercial applications may appear on the surface to be a benign practice, as each firm’s office uses the tools it is most comfortable with. But the overall cost to the customer in fact is enormous.
Is there a better approach that companies (both consultants and owners of environmental liability) can adopt to manage their environmental data? The solution seems obvious: get all the information about sites out of paper files, spreadsheets, and stand-alone or inaccessible databases and into an electronic repository in a structured and formatted form that—and this is the crucial point — any project participant can access, preferably from the web, at any time or any place. In other words, the solution is not merely to use computers, but to use the web to link the parties involved in an emission management or site cleanup, and this includes not only site owners and their consultants but also regulators, laboratories, and insurers, thus making them, in current jargon, “interoperable.” This may be obvious, but today it is also a very distant goal.
What would the ideal IT architecture of environmental industry in future look like? It would start, with wireless data entry using mobile devices by technicians in the field and wireless sensors where feasible. Labs would upload the results of analytical testing directly from their instrumentation and LIMS systems into the web-based database. During the upload process any necessary error checking and data validation would take place automatically. Consultants would review these uploads and put their stamp of approval on the data before it becomes part of the permanent database. Air monitoring devices and sensors would automatically upload their measurements into the same system. Ditto for any water or air treatment systems installed at facilities, metering devices for consumption of energy, water, or fuel, etc. Anything with an IP address and connected to the internet that produces data relevant to environmental or sustainability monitoring should feed data into the same system. (In today’s word there is a word for it: Internet of Things or IoT).
Behind the scenes, all data would be formatted and stored according to recognized and standard protocols. Contrary to widespread concerns, this does not require a single central repository for all data or any particular hardware architecture. Instead, it relies on common software protocols and formats so that individual computer applications can find and talk to one another across the Internet. The good news is that the most of these standards, such as XML, SOAP, AJAX, REST, and WSDL, already exist and are used by many industries. Others, such as DMR, SEDD, GRI, CDP, EDF, CROMERR, or EDD (spelling them out makes them sound no less obscure) are unique to the environmental industry and govern data interchange between, laboratories, consultants, clients and regulatory agencies. On top of these, there needs to be hacker-proof layers of authentication and password protection so that only the right people can access critical or sensitive information.
There is still some work to do to refine these technologies but the basic building blocks are already readily available and implemented by few progressive companies and regulatory agencies. The problems that this changed approach would address are many. First, data would be entered or uploaded just once, preferably electronically. Secondly, data transfer costs would drop and data quality would improve. No longer would the need exist to transfer data whenever one consulting firm is replaced by another or to maintain multiple databases that must be kept in sync. Third, the significant amounts of time that engineers, managers, and scientists now spend determining where a particular report is correct or looking up information on a site would dramatically decline. Fourth, by having their data in a consistent electronic format, companies would be in a better position to comply with the emerging demand to upload information on their sites to state or federal agencies and organizations. Several progressive states have already imposed electronic deliverable standards (e.g., California and New Jersey), and US EPA is working on its own standards based on XML technology. Last, and most significantly, site owners would assume possession of their data and as such, finally gain ready access to information about their own sites. This would seem particularly beneficial to public companies attempting to comply with the SOX.
The good news is that a system described above already exists.
We would love to discuss your environmental data situation with you. Contact us or call (650) 960-1640.
299 Fairchild Drive
Mountain View, CA 94043
P: +1 (650) 960-1640
F: +1 (415) 360-5889
Locus Technologies provides cloud-based environmental software and mobile solutions for EHS, sustainability management, GHG reporting, water quality management, risk management, and analytical, geologic, and ecologic environmental data management.
