Mapping All of Space and Time

Today is GIS Day, a day started in 1999 to showcase the many uses of geographical information systems (GIS). To celebrate the passage of another year, this blog post examines how maps and GIS show time, and how Locus GIS+ supports temporal analysis for use with EIM, Locus’s cloud-based, software-as-a-service application for environmental data management.

Space and Time

Since GIS was first imagined in 1962 by Roger Tomlinson at the Canada Land Inventory, GIS has been used to display and analyze spatial relationships. Every discrete object (such as a car), feature (such as an acre of land), or phenomenon (such as a temperature reading) has a three-dimensional location that can be mapped in a GIS as a point, line, or polygon. The location consists of a latitude, longitude, and elevation. Continuous phenomenon or processes can also be located on a map. For example, the flow of trade between two nations can be shown by an arrow connecting the two countries with the arrow width indicating the value of the traded goods.

However, everything also has a fourth dimension, time, as locations and attributes can change over time. Consider the examples listed above. A car’s location changes as it is driven, and its condition and value change as the car gets older. An acre of land might start covered in forest, but the land use changes over time if the land is cleared for farming, and then later if the land is paved over for a shopping area. The observed temperature at a given position changes with time due to weather and climate changes spanning multiple time scales from daily to epochal. Finally, the flow of trade between two countries changes as exports, imports, and prices alter over time.

Maps and Time

Traditional flat maps already collapse three dimensions into two, so it’s not surprising that such maps do not handle the extra time dimension very well. Cartographers have always been interested in showing temporal data on maps, though, and different methods can be employed to do so. Charles Minard’s famous 1861 visualization of Napoleon’s Russian campaign in 1812-1813 is an early example of “spatial temporal” visualization. It combines two visuals – a map of troop movements with a time series graph of temperature – to show the brutal losses suffered by the French army. The map shows the army movement into Russia and back, with the line width indicating the troop count. Each point on the chart is tied to a specific point on the map. The viewer can see how troop losses increased as the temperature went from zero degrees Celsius to -30 degrees. The original thick tan line has decreased to a black sliver at the end of the campaign.

Minard's map

Charles Minard’s map of Napoleon’s Russian campaign in 1812-1813.

The Minard visual handles time well because the temperature chart matches single points on the map; each temperature value was taken at a specific location. Showing time changes in line or area features, such as roads or counties, is harder and is usually handled through symbology. In 1944, the US Army Corps of Engineers created a map showing historical meanders in the Mississippi River. The meanders are not discrete points but cover wide areas. Thus, past river channels are shown in different colors and hatch patterns. While the overlapping meanders are visually complex, the user can easily see the different river channels. Furthermore, the meanders are ‘stacked’ chronologically, so the older meanders seem to recede into the map’s background, similar to how they occur further back in time.

Alluvial Valley

Inset from Geological Investigation of the Alluvial Valley of the Lower Mississippi River.

Another way to handle time is to simply make several maps of the same features, but showing data from different times. In other words, a temporal data set is “sliced” into data sets for a specific time period. The viewer can scan the multiple maps and make visual comparisons. For example, the Southern Research Station of the US Forest Service published a “report card” in 2011 for Forest Sustainability in western North Carolina. To show different land users over time, small maps were generated by county for three years. Undeveloped land is colored green and developed land is tan. Putting these small maps side by side shows the viewer a powerful story of increasing development as the tan expands dramatically. The only drawback is that the viewer must mentally manipulate the maps to track a specific location.

Buncombe County land use map

Land Use change over time for Buncombe County, NC

GIS and Time

The previous map examples prove that techniques exist to successfully show time on maps. However, such techniques are not widespread. Furthermore, in the era of “big data” and the “Internet of Things”, showing time is even more important. Consider two examples. First, imagine a shipment of 100 hazardous waste containers being delivered on a truck from a manufacturing facility to a disposal site. The truck has a GPS unit which transmits its location during the drive. Once at the disposal site, each container’s active RFID tag with a GPS receiver tracks the container’s location as it proceeds through any decontamination, disposal, and decommission activities. The locations of the truck and all containers have both a spatial and a temporal component. How can you map the location of all containers over time?

As a second example, consider mobile data collection instruments deployed near a facility to check for possible contamination in the air. Each instrument has a GPS so it can record its location when the instrument is periodically relocated. Each instrument also has various sensors that check every minute for chemical levels in the air plus wind speed and temperature. All these data points are sent back to a central data repository. How would you map chemical levels over time when both the chemical levels and the instrument locations are changing?

In both cases, traditional flat maps would not be very useful given the large amounts of data that are involved. With the advent of GIS, though, all the power of modern computers can be leveraged. GIS has a powerful tool for showing time: animation. Animation is similar to the small “time slice” maps mentioned above, but more powerful because the slices can be shown consecutively like a movie, and many more time slices can be created. Furthermore, the viewer no longer has to mentally stack maps, and it is easier to see changes over time at specific locations.

Locus has adopted animation in its GIS+ solution, which lets a user use a “time slider” to animate chemical concentrations over time. When a user displays EIM data on the GIS+ map, the user can decide to create “time slices” based on a selected date field. The slices can be by century, decade, year, month, week or day, and show the maximum concentration over that time period. Once the slices are created, the user can step through them manually or run them in movie mode.

To use the time slider, the user must first construct a query using the Locus EIM application. The user can then export the query results to the GIS+ using the time slider option. As an example, consider an EIM query for all benzene concentrations sampled in a facility’s monitoring wells since 2004. Once the results are sent to the GIS+, the time slider control might look like what is shown here. The time slices are by year with the displayed slice for 3/30/2004 to 3/30/2005. The user can hit play to display the time slices one year at a time, or can manually move the slider markers to display any desired time period.

Locus GIS+ time slider

Locus GIS+ time slider

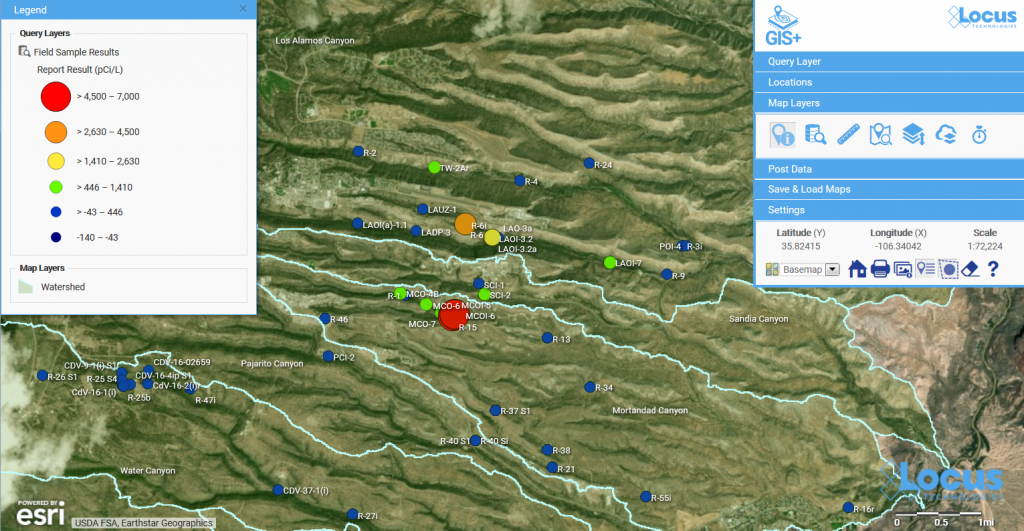
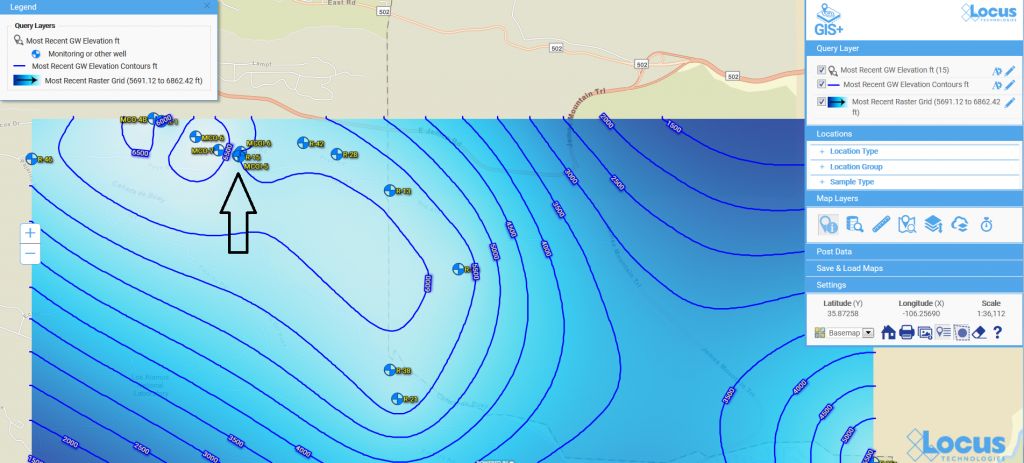
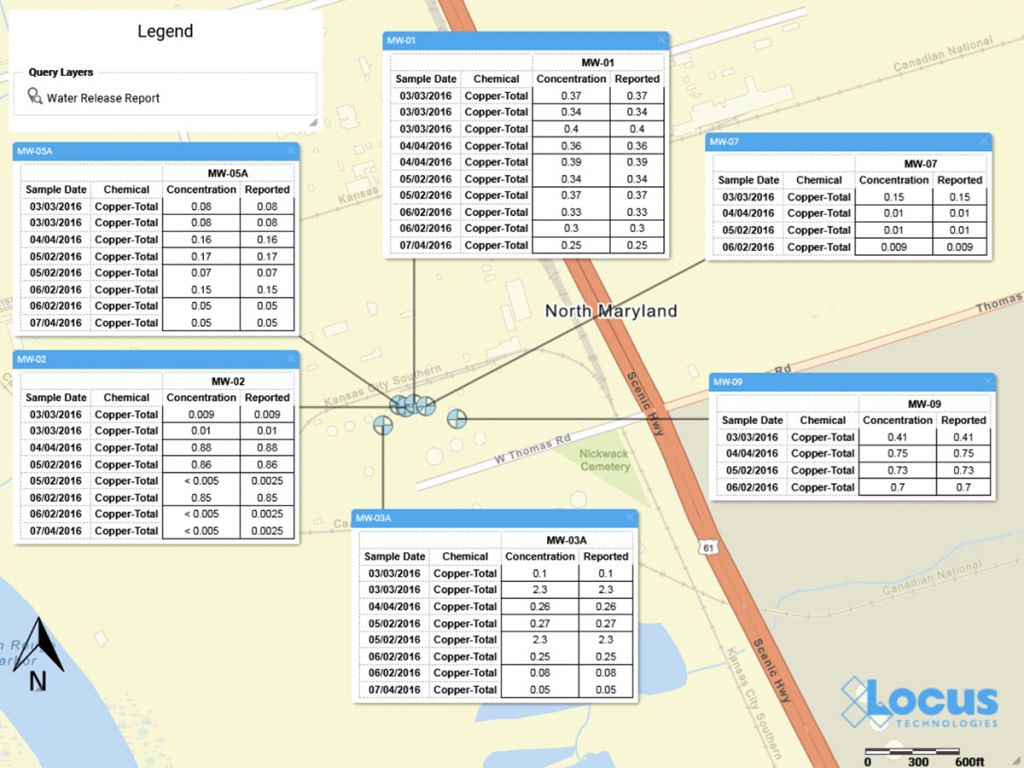
Here is an example of a time slice displayed in the GIS+. The benzene results are mapped at each location with a circle symbol. The benzene concentrations are grouped into six numerical ranges that map to different circle sizes and colors; for example, the highest range is from 6,400 to 8,620 µg/L. The size and color of each circle reflect the concentration value, with higher values corresponding to larger circles and yellow, orange or red colors. Lower values are shown with smaller circles and green, blue, or purple colors. Black squares indicate locations where benzene results were below the chemical detection limit for the laboratory. Each mapped concentration is assigned to the appropriate numerical range, which in turn determines the circle size and color. This first time slice for 2004-2005 shows one very large red “hot spot” indicating the highest concentration class, two yellow spots, and several blue spots, plus a few non-detects.

Locus GIS+ time slice

Time slice for a year for a Locus GIS+ query

Starting the time slider runs through the yearly time slices. As time passes in this example, hot spots come and go, with a general downward trend towards no benzene detections. In the last year, 2018-2019, there is a slight increase in concentrations. Watching the changing concentrations over time presents a clear picture of how benzene is manifesting in the groundwater wells at the site.

GIS+ time slider in action

GIS+ time slider in action

While displaying time in maps has always been a challenge, the use of automation in GIS lets users get a better understanding of temporal trends in their spatial data. Locus continues to bring new analysis tools to their GIS+ system to support time data in their environmental applications.

Time slice for a Locus GIS+ query

Time slice for a Locus GIS+ query

Interested in Locus’ GIS solutions?

Locus GIS+ features all of the functionality you love in EIM’s classic Google Maps GIS for environmental management—integrated with the powerful cartography, interoperability, & smart-mapping features of Esri’s ArcGIS platform!

[sc_button link=”https://www.locustec.com/applications/gis-mapping/” text=”Learn more about Locus’ GIS solutions” link_target=”_self” color=”#ffffff” background_color=”#52a6ea” centered=”1″]

[sc_image width=”150″ height=”150″ src=”16303″ style=”11″ position=”centered” disable_lightbox=”1″ alt=”Dr. Todd Pierce”]

About the Author—Dr. Todd Pierce, Locus Technologies

Dr. Pierce manages a team of programmers tasked with development and implementation of Locus’ EIM application, which lets users manage their environmental data in the cloud using Software-as-a-Service technology. Dr. Pierce is also directly responsible for research and development of Locus’ GIS (geographic information systems) and visualization tools for mapping analytical and subsurface data. Dr. Pierce earned his GIS Professional (GISP) certification in 2010.

EPA to set tougher requirements for lead in water

The Environmental Protection Agency (EPA) announced that it would impose stricter requirements on water utilities to manage lead and copper contamination in drinking water supplies. The EPA said that tackling water pollution is a core duty of the agency.

The proposed changes, the first affecting lead level in water since 1991, would also give utilities more time to replace lead pipes in their systems. Some environmental groups are not happy with the proposed rule because the change slows by 20 years the timeline for removing aging lead service pipes that could expose children to lead. Lead is a toxin known to harm developing brains. The rule slows down the removal of pipelines where lead levels exceed 15 μg/L to 33 years from the 13 years in the original law.

The new rule requires water utilities to identify and remove sources of lead when a water sample at faucet exceeds 15 micrograms per liter (μg/L). The EPA said water systems would also have to follow new, improved sampling procedures and adjust sampling sites to better target locations with higher lead levels.

Health advocates estimate that as many as six million or more lead water lines remain underground in U.S. cities and towns. Additional sampling and monitoring can help to identify affected areas, and ensure the quality of drinking water sources.

[sc_button link=”https://www.locustec.com/applications/industry/water-utilities/” text=”Locus for water quality management” link_target=”_self” color=”#ffffff” background_color=”#52a6ea” centered=”1″]

Predicting Water Quality with Machine Learning

At Locus Technologies, we’re always looking for innovative ways to help water users better utilize their data. One way we can do that is with powerful technologies such as machine learning. Machine learning is a powerful tool which can be very useful when analyzing environmental data, including water quality, and can form a backbone for competent AI systems which help manage and monitor water. When done correctly, it can even predict the quality of a water system going forward in time. Such a versatile method is a huge asset when analyzing data on the quality of water.

To explore machine learning in water a little bit, we are going to use some groundwater data collected from Locus EIM, which can be loaded into Locus Platform with our API. Using this data, which includes various measurements on water quality, such as turbidity, we will build a model to estimate the pH of the water source from various other parameters, to an error of about 1 pH point. For the purpose of this post, we will be building the model in Python, utilizing a Jupyter Notebook environment.

When building a machine learning model, the first thing you need to do is get to know your data a bit. In this case, our EIM water data has 16,114 separate measurements. Plus, each of these measurements has a lot of info, including the Site ID, Location ID, the Field Parameter measured, the Measurement Date and Time, the Field Measurement itself, the Measurement Units, Field Sample ID and Comments, and the Latitude and Longitude. So, we need to do some janitorial work on our data. We can get rid of some columns we don’t need and separate the field measurements based on which specific parameter they measure and the time they were taken. Now, we have a datasheet with the columns Location ID, Year, Measurement Date, Measurement Time, Casing Volume, Dissolved Oxygen, Flow, Oxidation-Reduction Potential, pH, Specific Conductance, Temperature, and Turbidity, where the last eight are the parameters which had been measured. A small section of it is below.

Locus Machine Learning - Data

Alright, now our data is better organized, and we can move over to Jupyter Notebook. But we still need to do a bit more maintenance. By looking at the specifics of our data set, we can see one major problem immediately. As shown in the picture below, the Casing Volume parameter has only 6 values. Since so much is missing, this parameter is useless for prediction, and we’ll remove it from the set.

Locus Machine Learning - Data

We can check the set and see that some of our measurements have missing data. In fact, 261 of them have no data for pH. To train a model, we need data which has a result for our target, so these rows must be thrown out. Then, our dataset will have a value for pH in every row, but might still have missing values in the other columns. We can deal with these missing values in a number of ways, and it might be worth it to drop columns which are missing too much, like we did with Casing Volume. Luckily, none of our other parameters are, so for this example I filled in empty spaces in the other columns with the average of the other measurements. However, if you do this, it is necessary that you eliminate any major outliers which might skew this average.

Once your data is usable, then it is time to start building a model! You can start off by creating some helpful graphs, such as a correlation matrix, which can show the relationships between parameters.

Locus Machine Learning - Corr

For this example, we will build our model with the library Keras. Once the features and targets have been chosen, we can construct a model with code such as this:

Locus Machine Learning - Construct

This code will create a sequential deep learning model with 4 layers. The first three all have 64 nodes, and of them, the initial two use a rectified linear unit activation function, while the third uses a sigmoid activation function. The fourth layer has a single node and serves as the output.

Our model must be trained on the data, which is usually split into training and test sets. In this case, we will put 80% of the data into the training set and 20% into the test set. From the training set, 20% will be used as a validation subset. Then, our model examines the datapoints and the corresponding pH values and develops a solution with a fit. With Keras, you can save a history of the reduction in error throughout the fit for plotting, which can be useful when analyzing results. We can see that for our model, the training error gradually decreases as it learns a relationship between the parameters.

Locus Machine Learning - Construct

The end result is a trained model which has been tested on the test set and resulted in a certain error. When we ran the code, the test set error value was 1.11. As we are predicting pH, a full point of error could be fairly large, but the precision required of any model will depend on the situation. This error could be improved through modifying the model itself, for example by adjusting the learning rate or restructuring layers.

Locus Machine Learning - Error

You can also graph the true target values with the model’s predictions, which can help when analyzing where the model can be improved. In our case, pH values in the middle of the range seem fairly accurate, but towards the higher values they become more unreliable.

Locus Machine Learning - Predict

So what do we do now that we have this model? In a sense, what is the point of machine learning? Well, one of the major strengths of this technology is the predictive capabilities it has. Say that we later acquire some data on a water source without information on the pH value. As long as the rest of the data is intact, we can predict what that value should be. Machine learning can also be incorporated into examination of things such as time series, to forecast a trend of predictions. Overall, machine learning is a very important part of data analytics and the development of powerful AI systems, and its importance will only increase in the future.

What’s next?

As the technology around machine learning and artificial intelligence evolves, Locus will be working to integrate these tools into our EHS software. More accurate predictions will lead to more insightful data, empowering our customers to make better business decisions.

Contact us today to learn how machine learning and AI can help your EHS program thrive

    Name

    Company Email

    Phone

    Tell us about your company's needs

    Locus is committed to preserving your privacy.

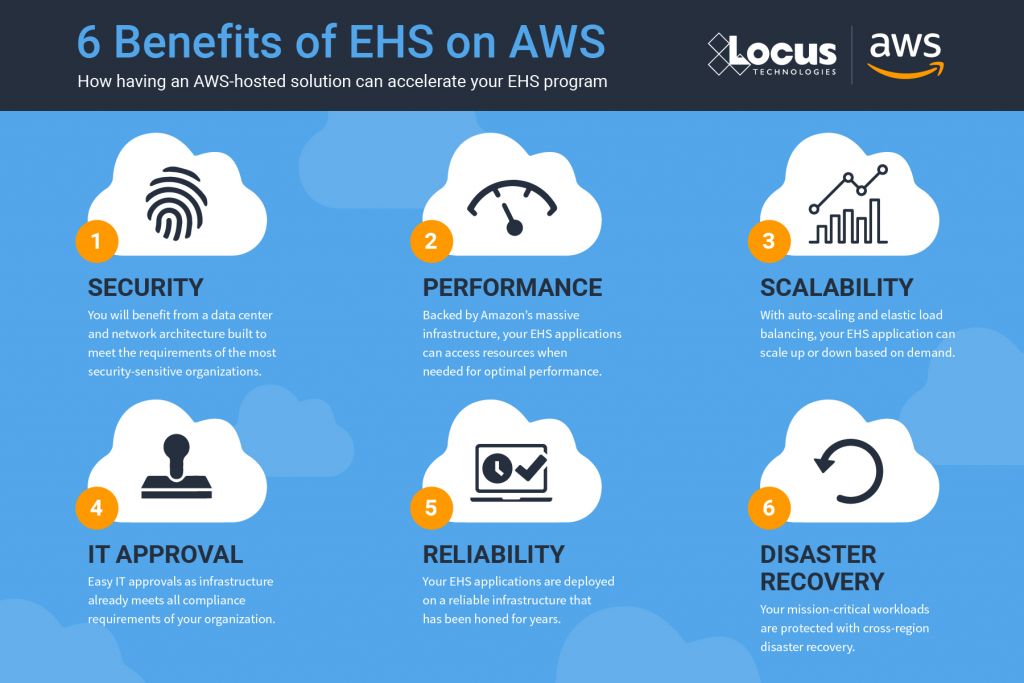
    Infographic: 6 Benefits of EHS on AWS

    In this infographic, we have outlined a few of the ways EHS programs benefit from having an AWS-hosted solution. Locus customers recently received these benefits as a result of moving our entire infrastructure to Amazon Web Services—the world’s leading cloud. Learn more about the move to AWS.

    Infographic: 6 Benefits of EHS on AWS

    Contact us to learn more about these benefits

      Name

      Company Email

      Phone

      Tell us about your company's needs

      Locus is committed to preserving your privacy.

      Artificial Intelligence and Environmental Compliance–Revisited–Part 4: AI, Big Data + Multi-Tenancy = The Perfect System

      AI and Big Data to Drive EHS Decisions via Multi-tenant SaaS

      With data and information streaming from devices like fire hydrants, there is little benefit from raw data, unless a company owning the data has a way to integrate the data into its record system and pair it with regulatory databases and GIS. That is where the advancement in SaaS tools and data sources mashups has helped set the stage for AI as a growing need.

      Humans are not very good at analyzing large datasets. This is particularly true with data at the planetary level that are now growing exponentially to understand causes and fight climate change. Faced with a proliferation of new regulations and pressure to make their companies “sustainable” EHS departments keep adding more and more compliance officers, managers, and outside consultants, instead of investing in technology that can help them. Soon, they will be turning to AI technology to stay on top of the ever-changing regulatory landscape. 

      Locus - Big Data - IoT - AI

      AI, in addition to being faster and more accurate, should make compliance easier. Companies spend too much time and effort on the comprehensive quarterly or annual reporting—only to have to duplicate the work for the next reporting period. The integrated approach, aided by AI, will automate these repetitive tasks and make it easier than just having separate analyses performed on every silo of information before having a conversation with regulators.

      In summary, whether it is being used to help with GHG emissions monitoring and reporting, water quality management, waste management, incident management, or other general compliance functions, AI can improve efficiency, weed out false-positive results, cut costs and make better use of managers’ time and company resources.

      Complex data - Data redundancy

      Another advantage of AI, assuming it is deployed properly, concerns its inherent neutrality on data evaluation and decision making. Time and time again we read in the papers about psychological studies and surveys that show people on opposite sides of a question or topic cannot even agree on the “facts.” It should not be surprising then to find that EHS managers and engineers are often limited by their biases. As noted in the recent best-seller book by Nobel Memorial Prize in Economics laureate Daniel Kahneman, “Thinking, Fast and Slow,” when making decisions, they frequently see what they want, ignore probabilities, and minimize risks that uproot their hopes. Even worse, they are often confident even when they are wrong. Algorithms with AI built-in are more likely to detect our errors than we are. AI-driven intelligent databases are now becoming powerful enough to help us reduce human biases from our decision-making. For that reason, large datasets, applied analytics, and advanced charting and data visualization tools, will soon be driving daily EHS decisions.

      In the past, companies almost exclusively relied upon on-premise software (or single-tenant cloud software, which is not much different from on-premise). Barriers were strewn everywhere. Legacy systems did not talk to one another, as few of the systems interfaced with one another. Getting data into third-party apps usually required the information to be first exported in a prescribed format, then imported to a third-party app for further processing and analysis. Sometimes data was duplicated across multiple systems and apps to avoid the headache of moving data from one to another.  As the world moves to the multi-tenant SaaS cloud, all this is now changing. Customers are now being given the opportunity to analyze not just their company’s data, but data from other companies and different but potentially related and coupled categories via mashups. As customers are doing so, interesting patterns are beginning to emerge.

      The explosion of content—especially unstructured content—is an opportunity and an obstacle for every business today.

      The emergence of artificial intelligence is a game-changer for enterprise EHS and content management because it can deliver business insights at scale and make EHS compliance more productive. There are numerous advantages when you combine the leading multi-tenant EHS software with AI:

      • Ability to handle the explosion of unstructured content where legacy on-premise EHS solutions can’t.
      • AI can organize, illuminate, and extract valuable business insights if all your content is managed in one secure location in the cloud.
      • Locus helps you take advantage of best-of-breed AI technologies from industry leaders and apply them to all your content.

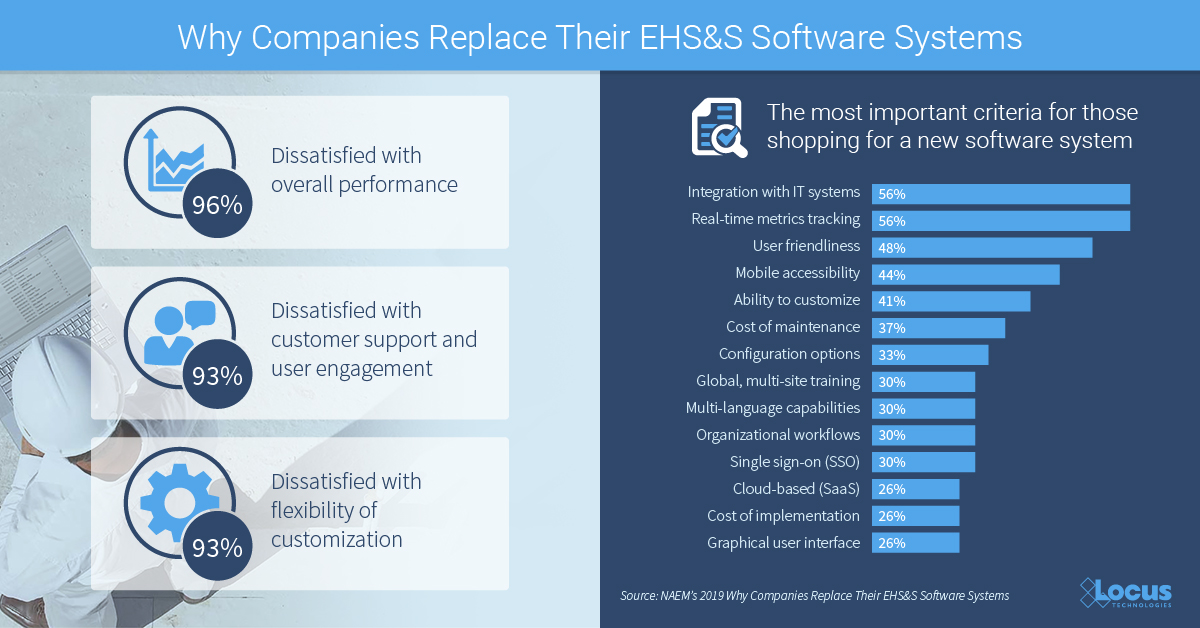
      We are seeing in the most recent NAEM white paper, Why Companies Replace Their EHS&S Software Systems, that people want the ability to integrate with other systems as a top priority.  Once the ability to share/consolidate data is available, AI is not far behind in the next generation of EHS/Water Quality software.

      This concludes the four-part blog series on Big Data, IoT, AI, and multi-tenancy. We look forward to feedback on our ideas and are interested in hearing where others see the future of AI in EHS software – contact us for more discussion or ideas! Read the full Series: Part One, Part Two, Part Three.

      Contact us to learn more about Locus uses IoT and AI

        Name

        Company Email

        Phone

        Tell us about your company's needs

        Locus is committed to preserving your privacy.

        Locus Technologies goes all-in on AWS

        SAN FRANCISCO, Calif., 23 July 2019 — Locus Technologies (Locus), the market leader in multi-tenant SaaS water quality, environmental compliance, and sustainability management, today announced that it is going all-in on Amazon Web Services, Inc. (AWS), moving its entire infrastructure to the world’s leading cloud. By moving its flagship product EIM (Environmental Information Management) to AWS this month, Locus will complete its transition to AWS. Locus previously moved its Locus Platform (LP) to AWS in 2018.

        EIM is the world’s leading water quality management software used by many Fortune 500 companies, water utilities, and the US Government since 1999. Among its many features, EIM delivers real-time tools to ensure that water utilities deliver clean water to consumers’ taps and don’t discharge contaminated wastewater above allowable limits to groundwater or surface water bodies like streams, lakes, or oceans.

        EIM generates big data, and with over 500 million analytical records at over 1.3 million locations worldwide, it is one of the largest centralized, multi-tenant water quality management SaaS systems in the world. With anticipated growth in double digits stemming from the addition of streaming data from sensors and many IoT monitoring devices, Locus needed to have a highly scalable architecture for its software hosting. The unmatched performance and scalability of AWS’s offerings are just the right match for powering Locus’ SaaS.

        Because of the scope of its applications, Locus is expecting to leverage the breadth and depth of AWS’s services (including its database systems, serverless architecture, IoT streaming, blockchain, machine learning, and analytics) to automate and enhance the on-demand EHS compliance, sustainability, facility, water, energy, and GHG management tools that Locus’ software provides to its customers.

        Running on AWS’s fault-tolerant and highly performant infrastructure will help support Locus’s everyday business, and will scale easily for peak periods, where reporting demand such as GHG calculation engine or significant emissions incidents like spills can skyrocket scalability demand.

        By leveraging Amazon CloudFront, Amazon Virtual Private Cloud (Amazon VPC), Amazon Elastic Kubernetes Service (Amazon EKS) and AWS Lambda, Locus is migrating to a microservices architecture to create more than 150 microservices that independently scale workloads while reducing complexity in the cloud, thereby enhancing every element of the customer cloud experience. Locus built a data lake on Amazon Simple Storage Service (Amazon S3) and will leverage Amazon Redshift to analyze the vast amount of data it is storing in the cloud, delivering insights and predictive analytics that uncover chemicals trending patterns and predict future emissions releases at various locations.

        Locus intends to leverage AWS IoT services and Amazon Managed Blockchain by building a new native integration to help businesses generate value from the millions of events generated by connected devices such as real-time environmental monitoring sensors and environmental treatment systems controls. AWS IoT is a set of cloud services that let connected devices easily and securely interact with cloud applications like EIM and Locus Platform and other devices. Locus IoT Cloud on AWS allows customers to experience real-time emissions monitoring and management across all their connected sensors and devices. And for customers who want to allow multiple parties to transact (e.g. GHG trading) without a trusted central authority, AWS provides a fully managed, scalable blockchain service. Amazon Managed Blockchain is a fully managed service makes it easy to setup, deploy, and manage scalable blockchain networks that Locus intends to use for emissions management and trading.

        For example, a water utility company that maintains thousands of IoT-enabled sensors for water flow, pressure, pH, or other water quality measuring devices across their dispersed facilities and pipeline networks will be able to use Locus IoT on AWS to ingest and manage the data generated by those sensors and devices, and interpret it in real time. By combining water sensor data with regulatory databases, water utility companies will be able to automatically create an emergency shutdown if chemical or other exceedances or device faults are detected and as such, will be better prepared to serve their customers and environment.

        By combining the powerful, actionable intelligence in EIM and rapid responsiveness through Locus Platform with the scalability and fast-query performance of AWS, customers will be able to analyze large datasets seamlessly on arrival in real time. This will allow Locus’ customers to explore information quickly, find insights, and take actions from a greater variety and volume of data—all without investing the significant time and resources required to administer a self-managed on-premises data warehouse.

        “After 22 years in business, and after evaluating AWS for a year with our Locus Platform, we decided to switch and continue all our business on AWS. We are taking advantage of their extensive computing power, depth and breadth of services and expertise to develop an effective cloud infrastructure to support our growing business and goal of saving the planet Earth by providing and managing factual information on emissions management, all the while reducing operational costs of Locus’ customers,” said Neno Duplan CEO of Locus. “By operating on AWS, we can scale and innovate quickly to provide new features and improvements to our services – such as blockchain-based emissions management – and deliver exceptional scalability for our enterprise customers. With AWS, we don’t have to focus on the undifferentiated heavy lifting of managing our infrastructure, and can concentrate instead on developing and improving apps and services.”

        “By organizing and analyzing environmental, sustainability, and water quality information in the cloud, Locus is helping organizations to understand the impact of climate change on drinking water,” said Mike Clayville, Vice President, Worldwide Commercial Sales at AWS. “AWS’s unmatched portfolio of cloud services, proven operational expertise, and unmatched reliability will help Locus to further automate environmental compliance for companies ranging from local water utilities to multinational manufacturing corporations, to federal government research agencies. ”By choosing to go all-in on AWS, Locus is able to innovate and expand globally, developing new solutions that will leverage comprehensive analytics and machine learning services to gain deeper insights and forecast sustainability metrics that will help deliver clean drinking water to consumers around the world.”

        Read on GlobeNewswire

        Artificial Intelligence and Environmental Compliance–Revisited–Part 3: Multi-Tenancy and AI

        SaaS–Multi-Tenant Cloud Architecture

        Multi-tenancy offers distinct benefits over traditional, single-tenant software hosting. A multi-tenant SaaS provider’s resources are focused on maintaining a single, current version of the application, rather than having its resources diluted in an attempt to support multiple software versions for its customers. If a provider is not using multi-tenancy, it may be hosting or supporting thousands of single-tenant customer implementations. By doing so, a provider cannot aggregate information across customers and extract knowledge from large data sets as every customer may be housed on a different server and possibly a different version of software. For these reasons, it is almost impossible and prohibitively expensive to deliver modern AI tools via single-tenancy.

        Locus Multi-Tenant Software
        View Infographic | Download White Paper

        Multi-tenancy has other advantages as well. Because every customer is on the same version of the software and the same instance, machine-learning (a prerequisite for building an AI system) can happen more quickly as large datasets are constantly fed into a single system. A multi-tenant SaaS vendor can integrate and deploy new AI features more quickly, more frequently, and to all customers at once. Lastly, a single software version creates more of a sense of community among users and facilitates the customers’ ability to share their lessons learned with one another (if they chose to do that). Most of today’s vendors in the EH&S software space cannot offer AI, sustain their businesses, and grow unless they are a true multi-tenant SaaS provider. Very few vendors are.

        AI

        Almost 30 years after the publication of our paper on the hazardous data explosion, SaaS technologies combined with other advancements in big data processing are rising to the challenge of successful processing, analyzing, and interpreting large quantities of environmental and sustainability data. It is finally time to stop saying that AI is a promising technology of the future. A recent Gartner study indicates that about 20 percent of data will be created or gathered by computers by 2018. Six billion connected devices will acquire the ability to connect and share data with each other. This alone will fuel AI growth as we humans cannot interpret such massive amounts of data.

        Gone are the days where EHS software was just a database. There are two factors that are fueling the adoption of AI technologies for water quality management and  EHS compliance. First, there is a vast increase that we have mentioned of data that needs sorting and understanding (big data). Second, there is the move to true multi-tenant SaaS solutions, which enables the intake and dissection of data from multiple digital sources (streaming data) from multiple customers, all in real-time.

        AI has entered the mainstream with the backing and advocacy of companies like IBM, Google, and Salesforce, who are heavily investing in the technology and generating lots of buzzes (and we are seeing the consequent talent war happening industry-wide). It is remarkable to observe how quickly AI is proliferating in so many verticals, as CBS’s 60 Minutes segment showed us.

        For our purposes, let’s look at where AI is likely to be applied in the EHS space. The mission-critical problem for EHS enterprise software companies is finding solutions that both enhance compliance and reduce manual labor and costs. This is where AI will play a major role. So far, companies have largely focused on aggregating their data in a record system(s); they have done little to interpret that data without human interaction. To address the ever-changing growth in environmental regulations, companies have been throwing people at the problem, but that is not sustainable.

        Locus Artificial Intelligence

        AI and natural language processing (NLP) systems have matured enough to read through the legalese of regulations, couple them with company’s monitoring and emissions data, and generate suggestions for actions based on relevant regulations and data. Take, for example; a CEMS installed at many plants to monitor air emissions in real-time. Alternatively, a drinking water supply system monitoring for water quality. In each of these systems, there are too many transactions taking place to monitor manually to ascertain which ones are compliant and which ones are not? I see no reason why similar algorithms that are used for computerized trading (as described in the recent best-seller “Flash Boys”) to trade stocks in fractions of a second cannot be used for monitoring exceedances and automatically shutting down discharges if there is an approaching possibility of emission exceedance. It is an onerous task to figure out every exceedance on a case-by-case basis. Intelligent databases with a built-in AI layer can interpret data on arrival and signal when emissions exceed prescribed limits or when other things go wrong. The main driver behind applying AI to EHS compliance is to lower costs and increase the quality of EHS compliance, data management, and interpretation, and ultimately, to avoid all fines for exceedances.

        For example, a large water utility company has to wade through thousands of analytical results to look for outliers of a few dozen chemicals they are required to monitor to stay compliant. Some of these may be false-positives, but that still leaves some results to be investigated for outliers. Each of those investigations can take time. However, if a software algorithm has access to analytical results and can determine that the problem rests with a test in the lab, that problem can be solved quickly, almost without human interaction. That is powerful.

        Combing through data and doing this by hand or via spreadsheet could take days and create a colossal waste of time and uncertainty. Hundreds of billable hours can be wasted with no guaranteed result. Using AI-driven SaaS software to determine what outliers need investigation allows compliance managers, engineers, and chemists to focus their expertise on just these cases and thus avoid wasting their time on the remaining ones that the AI engine indicates need no further examination.

        Predictive analytics based on big data and AI will also make customer data (legacy and new) work harder for customers than any team(s) of consultants. A good analogy that came to me after watching 60 minutes is that the same way the clinical center in North Carolina used AI to improve cancer treatment for their patients, engineers and geologists can improve on selecting the site remedy that will be optimized for given site conditions and will lead to a faster and less expensive cleanup with minimum long-term monitoring requirements.

        A final example where AI will be playing a role is in the area of enterprise carbon management. SaaS software is capable of integrating data from multiple sources, analyzing and aggregating it. This aggregated information can then be distributed to a company’s divisions or regulatory agencies for final reporting and validation/verification, all in real-time. This approach can save companies lots of time and resources. Companies will be able to access information from thousands of emission sources across the states, provinces, and even countries where their plants are located. Because each plant is likely to have its set of regulatory drivers and reporting requirements, these would have to be incorporated into the calculation and reporting engine. After data from each plant is uploaded to a central processing facility, the information would be translated into a “common language,” the correct calculation formulae and reporting requirements applied, and the results then returned to each division in a format suitable for reporting internally and externally.

        Blockchain for EHS—Looking ahead

        And finally, another emerging technology, blockchain, will further augment the power of AI for EHS monitoring and compliance. While blockchain is in its infancy, its decentralized approach coupled with AI will bring another revolution to EHS compliance and water monitoring.

        Blockchain technology

        Parts one, two, and four of this blog series complete the overview of Big Data, IoT, AI, and multi-tenancy. We look forward to feedback on our ideas and are interested in hearing where others see the future of AI in EHS software – contact us for more discussion or ideas!

        Contact us to learn more about Locus uses IoT and AI

          Name

          Company Email

          Phone

          Tell us about your company's needs

          Locus is committed to preserving your privacy.

          Stories and conversations from this summer’s radiological workshop

          Locus recently joined the nuclear power plant community in Orlando, FL for this year’s Radiological Effluents and Environmental Workshop. It’s always a pleasure to join other professionals in a space that encourages discussion, education, and awareness of industry processes and compliance.

          Locus Technologies at the NEI Radiological Conference, Orlando, 2019

          Bill Donaldson and Danny Moore of Locus Technologies.

          Each conference we attend is an opportunity to learn. Whether talking with current or potential customers, it’s always fascinating to hear some of the success and horror stories experienced in their daily operations. We’ve summarized a few of those conversations below. And since REEW takes place in the summer, there’s a theme.


          Locus SaaS does not have version numbers.Version Island

          Imagine you’ve spent years utilizing a certain feature of your radiological software. You’ve gone through the training process, the growing pains, and you are finally enjoying the fruits of that labor. Now imagine learning that the latest and greatest version being released has removed the feature that you’ve grown to rely on. You are now stuck on a version island. At this point, a costly and time consuming upgrade will cause more problems. Locus SaaS has no version numbers, meaning you will never need to upgrade.


          Ditch Excel and go off the gridOff the Grid

          At one time, the simple columns and rows in Excel seemed to provide a sufficient solution to prepare your REMP sampling data for reports. However, when you need to transfer data between systems, or create more sophisticated reports, those grids begin to feel like prison bars. Maybe it’s time to go off the grid and deploy a more modern solution that can connect and work side by side with your existing tools.


          Locus helps with decommissioningSunsetting (Decommissioning)

          Closing a power plant is a long and involved process that many attendees were in the process of dealing with or will be in the near future. This operational change can be the motivation to rethink the way radiological data is sampled and managed. Some software packages can be too big for the job. Locus offers a modular approach where you only pay for what you need. Choosing which system tools are relevant to the type of data sampling and resources available can minimize implementation cost and increase productivity.


          Locus' cloud securitySerene Security

          Many people we spoke with at REEW had serious security concerns. Locus takes those concerns seriously. We are SOC 1 and SOC 2 certified and have migrated our software to Amazon Web Services. All customer data is stored with AWS, one of the most advanced and secure cloud-hosting providers on the planet. Locus provides the ability to control user permissions, customizing access based on job duties. This provides a more granular approach to data security.


          Locus sample planningMaking Plans

          Using a sample planning application organizes sample events and allows for scheduling weeks, months, or years in advance. Many were interested in this powerful tool that is flexible enough to adapt when a reactor changes modes, allowing for one-time, ad-hoc samples. Mobile applications that integrate with planned samples and events minimize setup, ease data collection, speed up loading field data, and can expedite samples to the lab more efficiently.


          Your feedback has helped Locus build a solution that makes it easy to manage all your facility’s data for RETS/REMP, helping you meet your NRC reporting requirements. We enjoyed speaking with everyone at REEW and we look forward to seeing you again next year!

          [sc_button link=”https://www.locustec.com/applications/industry/nuclear/” text=”Learn more about Locus for Nuclear” link_target=”_self” background_color=”#52a6ea” centered=”1″ separator_style=”double”]


          About the author—Danny Moore, Locus Technologies

          Danny Moore, Marketing Manager, Locus Technologies

          Mr. Moore has spent the last decade designing and marketing for enterprise SaaS systems. In his career at Locus, he leads a team of marketing professionals in branding, content creation, social media engagement, and email outreach. Mr. Moore enjoys attending conferences as a Locus brand ambassador and sharing any feedback gained to improve product development.


          About the author—Bill Donaldson, Locus Technologies

          Bill Donaldson, Locus Technologies

          Mr. Donaldson has 5 years experience in SaaS systems, performing Product Management and QA/QC of Locus Mobile iOS application and Locus’ Environmental Information Management system (EIM). While completing his B.S., Mr. Donaldson held several paid internships, where he configured a Relational GeoDatabase and a Database Management System (DBMS), for biological data entry.

          Does your EHS software have a version number?

          Freedom from product release tyranny

          I love the article by Geoffrey Moore on the power of software as a service (SaaS) business model published on LinkedIn. In SaaS’s Real Triumph he writes: “by far the greatest contribution of SaaS is to free the enterprise from the tyranny of the product release model.”

          He cites the operational burden, enterprise-wide distraction and associated cost to roll out an enterprise software and then the subsequent hesitation to repeat that when a new release of that software becomes available as that deployment model is not sustainable nor affordable. Companies spend big dollars buying and then deploying EHS software that they know will be outdated in just a few years. Only IT personnel benefits from that model as it may extend their employment for a few years before IT department goes out of business for good. Moore points out the painful truth, stating: “you have paid maintenance of 18 to 20% per year for anywhere from five to ten years for the express purpose of not availing yourself of the innovation created during that time period.”

          Probably the main benefit of SaaS multi-tenancy (that is frequently overlooked during the software selection process) is no software versioning. This is because multi-tenant software typically provides a rolling upgrade program: incremental and continuous improvements. It is an entirely new architectural approach to software delivery and maintenance model. Companies have to develop applications from the ground up for multi-tenancy. Legacy client-server or single-tenant software cannot qualify for multi-tenancy. Let’s take a look at definitions:

          No version number

          Single-Tenant – A single instance of the software and supporting infrastructure serves a single customer. With single-tenancy, each customer has his or her own independent database and instance of the software. Essentially, there is no sharing happening with this option.

          Multi-Tenant – Multi-tenancy means that a single instance of the software and its supporting infrastructure serves multiple customers. Each customer shares the software application and also shares a single database. Each tenant’s data is isolated and remains invisible to other tenants.

          Benefits of SaaS Multi-Tenant Architecture

          The multi-tenant architecture provides lower costs through economies of scale: With multi-tenancy, scaling has far fewer infrastructure implications than with a single-tenancy-hosted solution because new customers get access to the same software.

          Shared infrastructure leads to lower costs: SaaS allows companies of all sizes to share infrastructure costs. Not having to provision or manage any infrastructure or software above and beyond internal resources enables businesses to focus on everyday tasks.

          Ongoing maintenance and updates: Customers don’t need to pay costly upgrades to get new features or functionality. 

          Configuration can be done while leaving the underlying codebase unchanged: Single-tenant-hosted solutions are often customized, requiring changes to an application’s code. This customization can be costly and can make upgrades expensive and time-consuming because the upgrade might not be compatible with customers changes to the earlier software version.

          Multi-tenant solutions are designed to be highly configurable so that businesses can make the application perform the way they want. There is no changing the code or data structure, making the upgrade process easy.

          Multi-tenancy ensures that every customer is on the same version of the software. As a result, no customer is left behind when the software is updated to include new features and innovations. A single software version also creates a unique sense of community where customers and partners share knowledge, resources, and learning. Smart managers work with their peers and learn from them and what they are doing. A multi-tenant SaaS provider’s resources are focused on maintaining a single, current (and only) version of the application, rather than spread out in an attempt to support multiple software versions for customers. If a provider isn’t using multi-tenancy, it may be hosting thousands of single-tenant customer implementations. Trying to maintain that is too costly for the vendor, and those costs, sooner or later, become the customers’ costs.

          A vendor who is invested in on-premise, hosted, and hybrid models cannot commit to providing all the benefits of a true SaaS model due to conflicting revenue models. Their resources are going to be spread thin, supporting multiple versions rather than driving innovation. Additionally, if the vendor makes the majority of their revenue selling on-premise software, it is difficult for them to fully commit to a true SaaS solution since the majority of their resources are allocated to supporting the on-premise software.

          Before you engage future vendors for your enterprise EHS software, assuming you already decided to go with SaaS solution, ask these questions:

          1. Does your software have version numbers? 
          2. Do you charge for upgrades and how often do you upgrade?

          If the answer is yes to any of these two questions, you should not consider that vendor as they are not true multi-tenant SaaS. You should not select that vendor if they answer “we are in the process of switching to multi-tenancy.” Multi-tenancy train departed a long time ago, and no EHS vendor who is single-tenant is not going to make that switch in time to make it work.

          And if they suddenly introduce a “multi-tenant” model (after selling an on-premises version for 10+ years) who in the world would want to migrate to that experimental cloud without putting the contract out to bid to explore a switch to well established and market-tested true multi-tenant providers? The first-mover advantage when it comes to multi-tenancy is a huge advantage for any vendor.

          Multi-tenant architecture


          City of San Marcos, Texas selects Locus water quality compliance software

          Locus will provide cloud environmental water quality software with GIS and mobile integration 

          MOUNTAIN VIEW, Calif., 9 July 2019 — Locus Technologies, (Locus), the industry leader in water quality, EHS, sustainability, and compliance management software, is pleased to announce that the City of San Marcos, Texas Water/Wastewater Utility selected Locus Environmental Information Management (EIM) software to streamline water quality and wastewater management and compliance.

          “With Locus’ water quality software we can streamline and modernize how we manage and report our critical water quality and wastewater data,” said Ron Riggins, San Marcos Water Quality Manager. “With an integrated mobile application, we will be able to access and react to field information faster than ever before.”

          “By selecting Locus EIM water quality software, the City of San Marcos, Texas can simplify managing water and wastewater data and integrate with their existing GIS system. This will provide them a modern cloud solution with fully integrated mobile capabilities,” said Wes Hawthorne, President of Locus.