Improved wastewater distribution and treatment technologies have largely eradicated once-common waterborne diseases.
Water supply and distribution were ranked as the fourth greatest engineering achievement of the 20th century by the National Academy of Engineering (NAE), and rightfully so.
Developments in water management have drastically improved public health and safety. In the early 1900s, for example, dysentery and diarrhea, both waterborne diseases, were the third largest cause of death in the United States (Wulf, 2000).
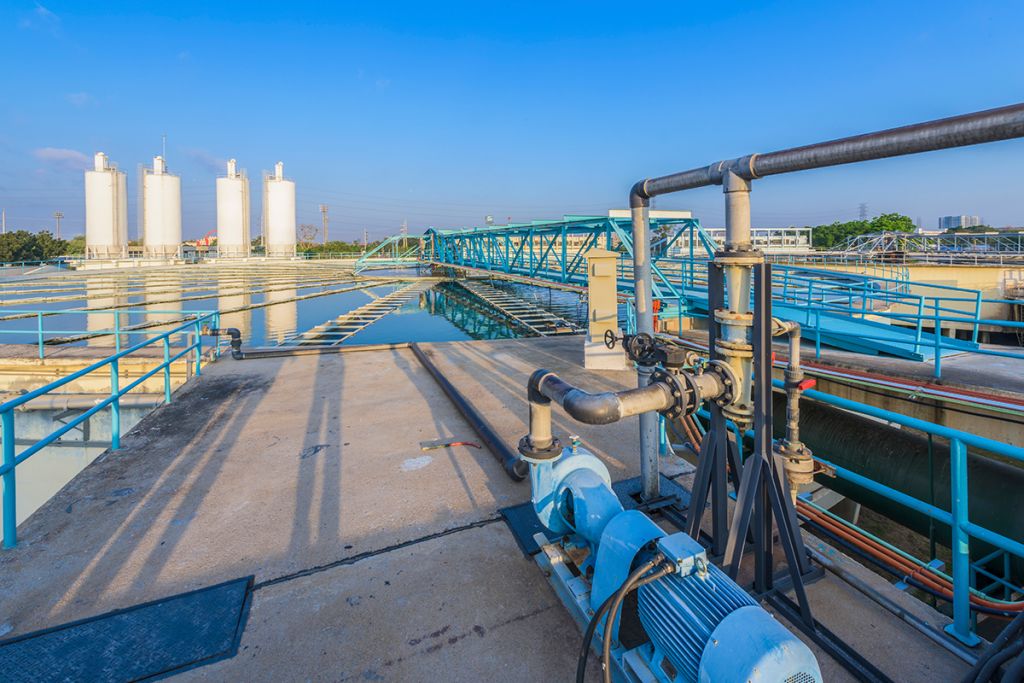
Currently, incidences of waterborne diseases in the United States are minimal, thanks in large measure to improved water distribution and treatment technologies. Additionally, cities are now less susceptible to flooding due to the development and implementation of storm drain systems. The current paradigm in urban water management entails a centralized drinking water plant, connected to individual households through an underground network of pipes, and a sewer that carries the wastewater to a centralized treatment plant for further discharge into a natural water stream. This system has permitted significant progress in our society.
Our clean water supply and sanitation systems may be endangered
NAE also says that providing access to clean water is the fifth greatest challenge that we will face this century. Despite all its positive qualities, the urban water management paradigm has some serious limitations that are likely to get worse in the future due to increasing urban population, expansion of paved areas, scarcity of water, and climate change:
- Reliance on large quantities of water
Centralized systems depend heavily on large quantities of water— an already scarce resource that will likely become even more so, with increasing population and climate change. Population growth also requires increasing the capacity of the water treatment plants and expanding the already-complex network of water lines.
- More runoff
Fast-growing cities mean larger paved areas and, therefore, higher runoff during rain events. Runoff, which carries pollutants from the street surface, is difficult and expensive to contain and treat. Many cities— including some cities here in the San Francisco Bay Area— discharge their storm water runoff directly to the sea, with minimal treatment. If you live in the San Francisco Bay area, you may have noticed blue signs posted next to storm drains, which read “Drains to the Bay”. Runoff is expected to become an even bigger issue due to the variability in rainfall caused by climate change.
- Expensive operation and maintenance
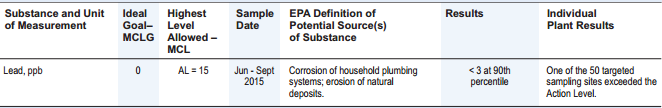
Extensive underground pipe networks for drinking and wastewater are expensive to operate and maintain. They make urban planning more difficult because pipe locations are not always known, and multiple independent agencies and companies run pipes and cables underground. Furthermore, the lead poisoning in Flint, Michigan, shows us that poorly maintained old pipes can present a serious public health issue.
- Leaky pipes
An estimated 10 – 40% of the global urban water supply is lost due to leaky pipes, which are difficult and costly to repair (Larsen et al., 2016)..
- Lost nutrients
Centralized water systems are not particularly efficient in recovering the nutrients that wastewater offers (i.e., nitrogen and phosphorous).
In search of a more sustainable solution
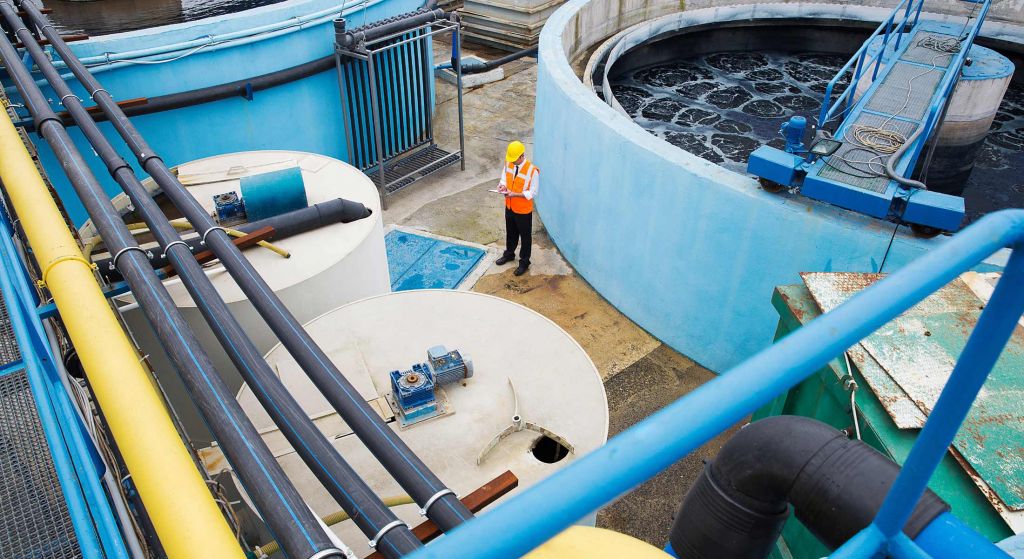
Centralized treatment plants have vastly improved public health, but perhaps a more decentralized urban water management system would address some of their shortcomings.
Across the country and the world, innovative teams have proposed and implemented multiple improvements and alternatives to the current urban water management paradigm. But there is still no widely-accepted solution to the current and future challenges in urban water management.
A real, sustainable solution would involve a combination of measures adapted to local needs. One promising approach to replace or supplement our current systems is to decentralize the management of urban water. This means treating the wastewater close to the source in small-scale treatment systems, instead of transporting it through a complex network of pipes to a centralized treatment plant. Decentralization offers a series of advantages— such as less reliance on pipes, easier coverage expansion in rapidly growing cities, lower variability in the loading of the treatment systems, and efficient utilization of the wastewater as a resource.
Decentralized systems, for example, offer the opportunity to separate blackwater (urine, faeces, flushwater), brownwater (faeces and flushwater), and greywater (water from washing food, clothes, and dishware, and from bathing)— which would be very complicated in a centralized system, due to the need to install separate pipelines for each.
Separating these sources makes wastewater treatment more efficient, as each of them require different extents of treatment. It also opens the possibility of water reuse. For example, greywater can easily be treated at a local scale and reused, therefore saving water and energy. Source separation also provides the opportunity to recover nutrients from human waste more efficiently. Urine, for example, contains a high concentration of nitrogen, which is lost as nitrogen gas in most centralized treatment plants. By separating the urine in a decentralized system, nitrogen could be recovered.
Nevertheless, decentralized systems have their own challenges. These include the complexity of operating, maintaining, and inspecting a network of treatment systems; the development of reliable and robust small-scale systems; and public acceptance. Decentralized urban water management is still in its early development, but it’s an idea that certainly deserves further consideration.
Why now?
Historically, major innovations in urban water management have been triggered by crises: the overpopulation of Ancient Rome led to the development of large scale water distribution systems; the cholera and typhoid fever outbreaks in Europe led to the development of disinfection; and the severe pollution of water stream led to development and implementation of wastewater treatment (Sedlak, 2014). With increasing world population, rapid urbanization, climate change, and a growing scarcity of resources, our current urban water management systems will be under increasingly significant stress. It is crucial to our health, our safety, and the overall well-being of our society that we anticipate the challenges and start innovating now.
—
References
Hansen, R. D. (n.d.). Water and Wastewater Systems in Imperial Rome. [online] <Accessed 16 December 2016>
Larsen, T. A., Hoffmann, S., Lüthi, C., Truffer, B., Maurer, M. (2016). Emerging solutions to the water challenges of an urbanizing world. Science, 352 (6288), pp. 928-933.
National Academy of Engineering. (2008). Grand Challenges for Engineering. National Academy of Science.
San Francisco Public Utilities Commission. (n.d.). Only Drain Down the Rain. [online] <Accessed on 16 December 2016>
Sedlak, D. (2014). Water 4.0: The Past, Present, and Future of the World’s Most Vital Resource. Yale University Press.
Tilley, E., Ulrich, L., Lüthi, C., Reymond, P., Schertenleib, R., Zurbrügg C. (2014). Compendium of Sanitation Systems and Technologies, 2nd Revised Edition. Swiss Federal Institute of Aquatic Science and Technology (Eawag), Dübendorf.
Wulf, W. A. (2000). Great Achievements and Grand Challenges. The Bridge, 30 (3&4), pp. 5-10.
—
Still looking for the right EHS software to revolutionize your environmental and compliance initiatives? Book a demo with us today!

About guest blogger— Victor Huanambal, Locus Technologies
Victor Huanambal has been working at Locus for close to two years as an environmental engineer. He graduated from the University of California, Berkeley, in 2014.
At Locus, he is mostly involved in projects related to groundwater remediation, environmental compliance, and greenhouse gases verification.