Locus Technologies adds EPA WQX export capability to Locus EIM

Submitting to EPA’s Water Quality eXchange (WQX) from EIM just got easier

MOUNTAIN VIEW, Calif., 25 April 2017 — Locus Technologies (Locus), the leader in cloud-based environmental compliance and sustainability management software, is excited to announce the release of the WQX Export Tool for EIM. The tool, exclusively in Locus’ EIM environmental information management software, provides users with simple intuitive interface to load data with the EPA’s Water Quality eXchange (WQX) into the EPA Storage and Retrieval (STORET) data warehouse, following the standards and protocols of the National Environmental Information Exchange Network.

Locus customers that need to share water quality data with EPA via WQX and STORET, such as Tribes, States and their data partners, now have an easy way to translate EIM data to WQX-compatible formats for simplified data submission. This allows customers to take advantage of the many benefits of a sophisticated environmental data system and still easily provide data to EPA per their agreed upon requirements. They can use EIM to seamlessly integrate laboratory deliverables, manage time series field data, complex analytical data, spatial data, and also take advantage of Locus Mobile for field sampling.

“We are pleased to add this export capability to EIM to expand its utility to a wider range of customers”, said Wes Hawthorne, President of Locus Technologies. “By taking a defined set of export requirements and simplifying the submission process, we have enabled a range of new customers to be able to use EIM for all their regulatory reporting needs.”

Locus adds Consumer Confidence Report (CCR) module to Locus EIM Water

Streamline and simplify annual CCR preparation with powerful and intuitive tools

MOUNTAIN VIEW, Calif., 28 March 2017 — Locus Technologies (Locus), the leader in cloud-based environmental compliance and sustainability management software, is excited to announce the release of the Consumer Confidence Report (CCR) module as an addition to Locus EIM Water.

The Locus EIM Water configuration is designed for water system owners and operators to simplify the sampling, management, tracking, and regulatory reporting of drinking water data. With the addition of the CCR module, the system now streamlines a complex and often tedious process of preparing the annual calculations required for the report.

The module guides the user through the steps of calculating the required statistics for the various analytical groups, as specified in the regulations. This tool also provides access to both the raw data that was used in the construction of the report as well as various intermediate calculations. Additionally, it addresses contaminant groups not sampled in the current year, making complying with the requirements significantly easier.

The EPA Safe Water Drinking Act requires that water system owners and operators annually prepare the Consumer Confidence Report for their customers. This report is something most water consumers are very familiar with throughout the U.S., as in most cases the local water provider directly provides a copy of the report to consumers. By design, the CCR is simple and easy to read, and conveys a detailed view of drinking water quality for consumers. What is not apparent in the report that consumers see is the complex process behind creating the report, including a structured review of one or more years of compliance data. This is where Locus EIM Water makes a difference for water system owners and operators.

“We are excited to add this key module to Locus EIM Water”, said Wes Hawthorne, President of Locus Technologies. “We know that Locus EIM Water is a great tool for managing the routine sampling and reporting needs of water system owners and operators, but we knew the CCR was one area where our customers often requested help. With our simple and intuitive module, the CCR preparation process will be greatly streamlined, which is a win-win for the water system owners/operators and consumers.”

Rethinking Urban Water Management


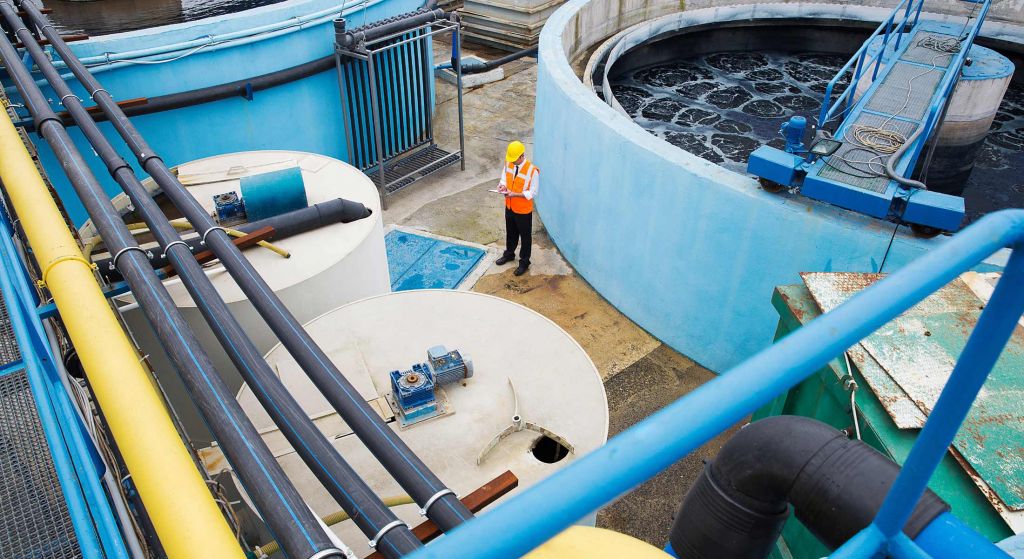
Water utility worker stands among tanks

Improved wastewater distribution and treatment technologies have largely eradicated once-common waterborne diseases.

Water supply and distribution were ranked as the fourth greatest engineering achievement of the 20th century by the National Academy of Engineering (NAE), and rightfully so.

Developments in water management have drastically improved public health and safety.  In the early 1900s, for example, dysentery and diarrhea, both waterborne diseases, were the third largest cause of death in the United States (Wulf, 2000).

Currently, incidences of waterborne diseases in the United States are minimal, thanks in large measure to improved water distribution and treatment technologies.  Additionally, cities are now less susceptible to flooding due to the development and implementation of storm drain systems. The current paradigm in urban water management entails a centralized drinking water plant, connected to individual households through an underground network of pipes, and a sewer that carries the wastewater to a centralized treatment plant for further discharge into a natural water stream.  This system has permitted significant progress in our society.

Our clean water supply and sanitation systems may be endangered

NAE also says that providing access to clean water is the fifth greatest challenge that we will face this century.  Despite all its positive qualities, the urban water management paradigm has some serious limitations that are likely to get worse in the future due to increasing urban population, expansion of paved areas, scarcity of water, and climate change:

  • Reliance on large quantities of water
    Centralized systems depend heavily on large quantities of water— an already scarce resource that will likely become even more so, with increasing population and climate change.  Population growth also requires increasing the capacity of the water treatment plants and expanding the already-complex network of water lines.
  • More runoff
    Fast-growing cities mean larger paved areas and, therefore, higher runoff during rain events.  Runoff, which carries pollutants from the street surface, is difficult and expensive to contain and treat. Many cities— including some cities here in the San Francisco Bay Area— discharge their storm water runoff directly to the sea, with minimal treatment.  If you live in the San Francisco Bay area, you may have noticed blue signs posted next to storm drains, which read “Drains to the Bay”.  Runoff is expected to become an even bigger issue due to the variability in rainfall caused by climate change.
  • Expensive operation and maintenance
    Extensive underground pipe networks for drinking and wastewater are expensive to operate and maintain.  They make urban planning more difficult because pipe locations are not always known, and multiple independent agencies and companies run pipes and cables underground. Furthermore, the lead poisoning in Flint, Michigan, shows us that poorly maintained old pipes can present a serious public health issue.
  • Leaky pipes
    An estimated 10 – 40% of the global urban water supply is lost due to leaky pipes, which are difficult and costly to repair (Larsen et al., 2016)..
  • Lost nutrients
    Centralized water systems are not particularly efficient in recovering the nutrients that wastewater offers (i.e., nitrogen and phosphorous).
In search of a more sustainable solution
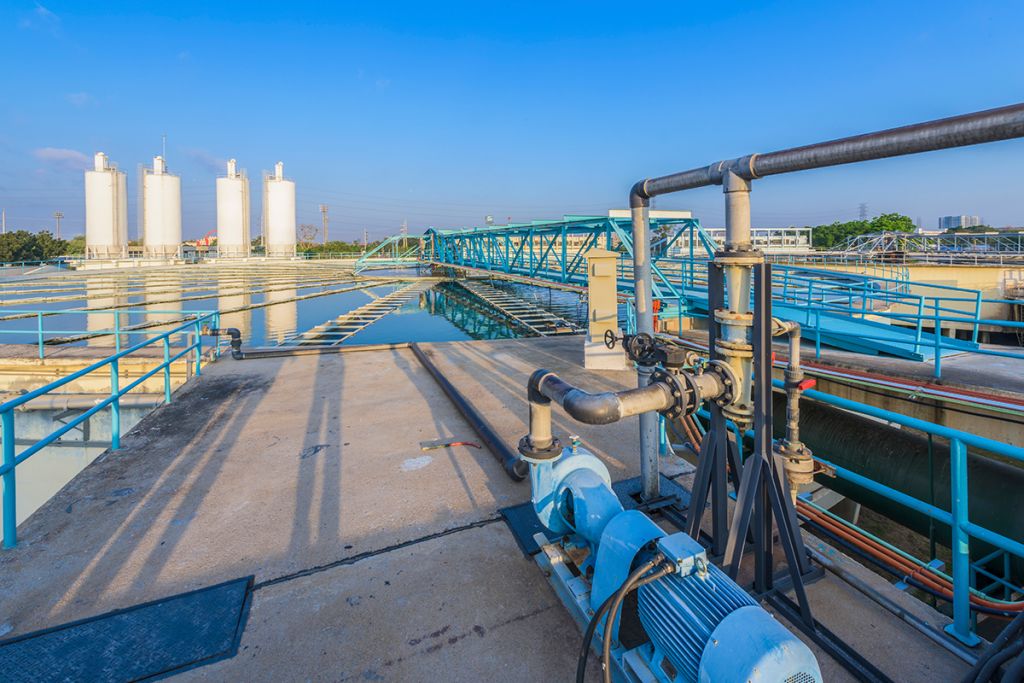
Water treatment utility plant

Centralized treatment plants have vastly improved public health, but perhaps a more decentralized urban water management system would address some of their shortcomings.

Across the country and the world, innovative teams have proposed and implemented multiple improvements and alternatives to the current urban water management paradigm.  But there is still no widely-accepted solution to the current and future challenges in urban water management.

A real, sustainable solution would involve a combination of measures adapted to local needs.  One promising approach to replace or supplement our current systems is to decentralize the management of urban water.  This means treating the wastewater close to the source in small-scale treatment systems, instead of transporting it through a complex network of pipes to a centralized treatment plant.  Decentralization offers a series of advantages— such as less reliance on pipes, easier coverage expansion in rapidly growing cities, lower variability in the loading of the treatment systems, and efficient utilization of the wastewater as a resource.

Decentralized systems, for example, offer the opportunity to separate blackwater (urine, faeces, flushwater), brownwater (faeces and flushwater), and greywater (water from washing food, clothes, and dishware, and from bathing)— which would be very complicated in a centralized system, due to the need to install separate pipelines for each.

Separating these sources makes wastewater treatment more efficient, as each of them require different extents of treatment.  It also opens the possibility of water reuse.  For example, greywater can easily be treated at a local scale and reused, therefore saving water and energy.  Source separation also provides the opportunity to recover nutrients from human waste more efficiently.  Urine, for example, contains a high concentration of nitrogen, which is lost as nitrogen gas in most centralized treatment plants.  By separating the urine in a decentralized system, nitrogen could be recovered.

Nevertheless, decentralized systems have their own challenges.  These include the complexity of operating, maintaining, and inspecting a network of treatment systems; the development of reliable and robust small-scale systems; and public acceptance.  Decentralized urban water management is still in its early development, but it’s an idea that certainly deserves further consideration.

Why now?

Historically, major innovations in urban water management have been triggered by crises: the overpopulation of Ancient Rome led to the development of large scale water distribution systems; the cholera and typhoid fever outbreaks in Europe led to the development of disinfection; and the severe pollution of water stream led to development and implementation of wastewater treatment (Sedlak, 2014).  With increasing world population, rapid urbanization, climate change, and a growing scarcity of resources, our current urban water management systems will be under increasingly significant stress.  It is crucial to our health, our safety, and the overall well-being of our society that we anticipate the challenges and start innovating now.

References
Hansen, R. D. (n.d.). Water and Wastewater Systems in Imperial Rome. [online]  <Accessed 16 December 2016>

Larsen, T. A., Hoffmann, S., Lüthi, C., Truffer, B., Maurer, M. (2016). Emerging solutions to the water challenges of an urbanizing world. Science, 352 (6288), pp. 928-933.

National Academy of Engineering. (2008). Grand Challenges for Engineering. National Academy of Science.

San Francisco Public Utilities Commission. (n.d.). Only Drain Down the Rain. [online]  <Accessed on 16 December 2016>

Sedlak, D. (2014). Water 4.0: The Past, Present, and Future of the World’s Most Vital Resource. Yale University Press.

Tilley, E., Ulrich, L., Lüthi, C., Reymond, P., Schertenleib, R., Zurbrügg C. (2014). Compendium of Sanitation Systems and Technologies, 2nd Revised Edition. Swiss Federal Institute of Aquatic Science and Technology (Eawag), Dübendorf.

Wulf, W. A. (2000). Great Achievements and Grand Challenges. The Bridge, 30 (3&4), pp. 5-10.

Still looking for the right EHS software to revolutionize your environmental and compliance initiatives?  Book a demo with us today!


Locus environmental engineer Victor Huanambal

About guest blogger— Victor Huanambal, Locus Technologies

Victor Huanambal has been working at Locus for close to two years as an environmental engineer. He graduated from the University of California, Berkeley, in 2014.

At Locus, he is mostly involved in projects related to groundwater remediation, environmental compliance, and greenhouse gases verification.


San Jose Water Company selects Locus Platform for environmental compliance management


SAN FRANCISCO, Calif., 29 November 2016 — Locus Technologies (Locus), a leading provider of cloud-based software solutions to streamline EHS regulation and compliance management, has partnered with San Jose Water Company for an implementation of the Locus Platform.

San Jose Water Company is an investor-owned water utility that serves over one million people in the greater San Jose metropolitan area. San Jose Water Company has been a customer of Locus since 2014, and has been using Locus EIM and Locus Mobile for its drinking water compliance activities. After finding success with their EIM solution, San Jose Water Company is expanding its Locus usage to Locus Platform.

San Jose Water Company will take advantage of the flexibility of the Locus Platform to configure a range of environmental compliance apps for tracking and reporting water discharges and hazardous material inspections, helping Locus to further strengthen its position in the water utilities market. By choosing to build most of their applications themselves, San Jose is taking advantage of Locus Platform’s easy-to-use configuration workbench to create unique and effective solutions. They will be able to use Locus Platform to support compliance with EPA’s Clean Water Act, Clean Air Act, and Resource Conservation and Recovery Act (RCRA).

In addition to tracking discharges and inspections, San Jose Water Company will use Locus Platform’s capabilities for reminders and checklists associated with other compliance requirements. They will also take advantage of Locus Platform’s built-in mobile features to enable their custom apps and streamline data collection throughout their various departments.

Locus Platform’s configurable solution will replace a range of self-built spreadsheet solutions and consolidate the water utility’s environmental compliance in one application. With the built-in configuration flexibility, San Jose Water Company’s Locus Platform will be able to grow and change as new regulatory requirements arise.

“Our recent successes in deploying our software solutions to customers in the water utility industry proves their versatile nature. San Jose Water Company needed a data management system that was tailored to their specific business practices. The Locus Platform allows for full configurability of its data collection tools, workflows, and outputs. By using these tools, the software solution fits the business— not the other way around.” said J. Wesley Hawthorne, President of Locus Technologies. “They were also impressed with their ability to self-configure and manage their own applications, which allows them to add new applications as their needs change.”

ABOUT SAN JOSE WATER COMPANY
San Jose Water Company (SJWC), a wholly owned subsidiary of SJW Group and founded in 1866, is an investor-owned water company headquartered in San Jose and is one of the largest and most technically sophisticated urban water system in the United States. SJWC serves over 1 million people in the greater San Jose metropolitan area comprising about 138 square miles. The utility delivers safe, high quality, and reliable water and exceptional customer service.

Cortina Rancheria selects Locus Technologies’ EIM for its water quality and environmental management system software

The Locus EIM SaaS will streamline the Cortina Rancheria environmental monitoring program under U.S. EPA Clean Water Act


San Francisco, Calif., 1 November 2016 — Locus Technologies, a leader in environmental and compliance enterprise management software, announced today that the Cortina Rancheria Kletsel Dehe Band of Wintun Indians (Cortina Rancheria) has selected Locus EIM as its environmental information management system.

Cortina Rancheria is implementing the Locus EIM SaaS-based software to manage their environmental monitoring under the U.S. EPA Clean Water Act.  Locus EIM will enable the tribe to consolidate and better manage its field, water quality, and air monitoring data, with output reporting to the EPA WQX database.

Locus EIM is a comprehensive environmental data management system designed for the variety and complexity of environmental sampling and analysis. EIM has all the built-in tools necessary for any environmental media sampling event, and it includes a powerful, integrated mobile application to streamline data acquisition.  With built-in sample planning, laboratory data upload, and a wide range of reporting and visualization tools, EIM is a complete solution for any environmental monitoring and reporting need and an excellent fit for natural resources monitoring.

“As the U.S. EPA recently approved the Cortina Rancheria Kletsel Dehe Band of Wintun Indians’ right to develop tribal water quality standards, the timing for EIM implementation is perfect.  Their use of EIM will help achieve their environmental stewardship goals by providing them the software tools to efficiently manage their water quality and tribal resources” said Wes Hawthorne, President of Locus.  “Our EIM software will also support their need to upload data to the EPA’s systems in a timely and efficient manner”.

ABOUT CORTINA INDIAN RANCHERIA
Cortina Rancheria is a federally recognized tribe, enacted in 1907 by order of the U.S. Secretary of the Interior.  The Tribe has a formally adopted constitution and is governed by a duly elected five (5) member Tribal Council, overseen by the General Council.  The Rancheria is located approximately seventeen (17) miles southeast of Williams, CA at the base of the Western Foothills.  The Rancheria consists of 640 acres of sovereign land and resources and has over 200 Tribal members.

Improving Arsenic detection and keeping it out of drinking water

Arsenic, a naturally occurring element, is one of the many drinking water contaminants actively monitored by drinking water systems because it can result in adverse health conditions, including an increased risk for a range of cancers. U.S. EPA and the U.S. Bureau of Reclamation (USBR) are joining forces to launch the Arsenic Sensor Prize Competition for the development of new technology to detect arsenic in water. If you are interested in participating you can read more here:

https://blog.epa.gov/blog/2016/09/were-sensing-a-change-in-water-monitoring-introducing-the-arsenic-sensor-prize-competition/

The use of arsenic as a poison is widely documented. As a result, many people are alarmed when they hear that their drinking water, either from a public or private water system, may contain any amount of arsenic. Exposure to arsenic in drinking water at the level the U.S. Environmental Protection Agency (EPA) currently deems as safe in the United States (10 parts per billion) still may induce adverse health outcomes. The U.S. EPA recently lowered the Maximum Contaminant Level (MCL) for arsenic to 10 µ/L in public water supplies—a regulated level that is considered “safe” for a lifetime of exposure—yet concentrations of 100 µ/L and higher are commonly found in private, unregulated well water in regions where arsenic is geologically abundant, including upper New England (Massachusetts, New Hampshire, Maine), Florida, and large parts of the Upper Midwest, the Southwest, and the Rocky Mountains.

Arsenic is a natural component of the earth’s crust and is widely distributed throughout the environment in the air, water and land. It is highly toxic in its inorganic form.

Arsenic in drinking water.

Measuring and testing for arsenic require expensive instruments and lab work, as well as time. However, with new and emerging technologies, a more efficient arsenic monitoring technology could help to improve the monitoring system, reduce costs, and better protect human health and the environment. Typically, samples are sent to a laboratory for analysis, with results available days to weeks later. New technology could accelerate this process by allowing for immediate detection of arsenic in water. This could reduce monitoring costs and help water utilities more effectively control treatment to remove arsenic from the drinking water supply.
The Arsenic Sensor Prize Competition aims to improve the existing process with upcoming and emerging technology. The competition is not exclusively restricted to sensor developers but seeks applicants from all fields, including information technology. For example, besides sensor technologies, a new data collection and transmission technologies such as Internet of Things (IoT) can also accelerate water quality characterization process or better data management, visualization, and reporting via cloud-based SaaS technologies. Applicant criteria include anyone with ideas for how to rapidly, accurately, and cost-effectively measure arsenic in water.

Locus Technologies is a software company that specializes in providing a SaaS-based solution for water quality management. Arsenic is one of  a key and prolific contaminants in our vast water quality databases. We have a keen interest in supporting this excellent and timely competition to help find a way to automate detection and data collection of arsenic and other contaminants in real time. To help shed some light on the  importance of arsenic in drinking water, we performed a quick check on a total number of arsenic records, hits, and locations across all customers in Locus SaaS EIM (Yes multi-tenant SaaS as otherwise, this statistic would be impossible to gather). This is what we found:

Total number of analytical records: >520,000,000
Number of Arsenic Records: 248,850
Number of Arsenic hits (above action limit MCL of 10 µ/L): 112,597
Number of Arsenic locations: 19,304

If you have ideas and  are interested in helping protect our nation’s drinking water, Locus encourages you to participate. We will have a special prize for the winner.

Making water quality data more transparent: Lessons from an annual water quality report


A few weeks ago, I received my water bill in the mail, right on schedule. But this time, it came with a glossy pamphlet containing the annual water quality report. Normally I just toss it into the trash unread. It’s full of small print and lots of numbers, and I was never that concerned about our water quality.

I live in the NC mountains, where the water comes from “pristine mountain springs and streams”. And having grown up in New Orleans— spending 21 years drinking water from the polluted tail end of the Mississippi River— I figured any damage was already done. (But that New Orleans water sure was tasty!)

This time, though, I actually read the entire report. I’d heard about recent water issues in Flint, MI, and other cities, and I do have children who drink the water here. So I looked at this City of Asheville water quality report in detail, and here’s what I discovered.

The report contains a lot of rather informative text about how the City of Asheville treats its water and what possible risks could be present from various contaminants. The centerpiece of the report is a table that lists detected substances in the water. In 2015, 13 substances were detected out of 150 substances sampled for, and those 13 were “well within safe levels”. That sounded good.  But then I started looking at the report and wondering about certain things…

Let’s start with lead. The report has this:

City of Asheville water quality report- lead measurements

City of Asheville’s 2015 Water Quality Report: Lead, ppb

The “Highest Level Allowed” (the maximum contaminant level, or MCL) is 15 parts per billion (ppb). I did some searching and found a good article explaining lead sampling in water. If over 10% of tests come back over that level of 15 ppb, then the water utility must warn residents.

Asheville seems to have passed this test (only one sample exceeded the action level). However, the article mentioned above also describes how the tests for Flint, MI had possible problems because the Michigan Department of Environmental Quality threw out two samples.  With those samples included, the number of samples over the limit would have exceeded 10%, and water customers would have received a much earlier warning of possible lead issues.

So, back to Asheville. Were any samples thrown out— and if so, why? That information is not in the report.

Let’s take one more example: hexavalent chromium. Here is the City of Asheville report:

City of Asheville water quality report- hexavalent chromium measurements

City of Asheville’s 2015 Water Quality Report: Hexavalent Chromium, ppb

So, the average hexavalent chromium level in the water is 0.05 ppb. But there is no action level given, and the EPA definition text says nothing about any possible side effects. Through more searching, I learned that although hexavalent chromium is a carcinogen, the US EPA does not have a maximum contaminant level (MCL) for this compound.

California has a public health goal of 0.02 ppb, but North Carolina has a public health goal of 0.07 ppb. So, how would I interpret the Asheville value of 0.05 that falls in the middle of those two numbers? At least the report provides the detected range (ND – 0.08), so the maximum level in any sample was only a bit higher than the 0.07 level.

These two examples are not meant to disparage Asheville’s Annual Water Quality Report— it is a great way to deliver some basic information to water users. But for motivated water users, the report will lead to other questions— to answer these questions would require more context or a deeper dive into the actual data. Also, while I’m personally fairly tech-savvy and scientifically literate, many water users may lack the numerical and verbal literacy skills needed to understand the report.

For some closing thoughts:

  • How can water utilities make their sample data more transparent and available to users who want to take the “deeper dive”? How can users learn about sampling processes and decisions made— for example, “were any lead samples rejected, and why?”
  • How do users evaluate risks from compounds without EPA maximum contaminant levels, especially when states and regulators have conflicting levels?
  • How do water utilities present trend information and changes in water quality procedures over time? The 2015 report only shows data from that year. I dug up some older reports and found that hexavalent chromium was not detected at all in 2014. So what caused the detects in 2015? Also, lead was sampled at 100 sites in 2014, but only 50 sites in 2015.  Why was the number of samples cut in half?
  • How do you balance presenting too much information to the public (causing information overload) with presenting too little (causing users to be uninformed about quality issues)? Is there a way to show key information, but let users drill down into actual sampling data results for further details?
  • As a follow up to that last question— if you allow public access to sampling data, how do you ensure customers can interpret that data correctly, if those customers lack knowledge of sampling processes and any statistical techniques used?
  • Can the power of the internet be harnessed to distribute this data and make it understandable to customers? Are there tools that customers can use to explore the data on their own and see key findings and trends? I could not find anything online for Asheville.
  • Finally, given that a certain level of technical understanding is needed to read the Annual Report and explore any actual data— do we need a neutral party to serve as interpreter and interlocutor for the public when dealing with water utilities? Who would play that role?

Other Locus contributors will explore some of these issues in future posts.  In the meantime, please share your own thoughts and ideas in the comments section below.


Locus employee Todd Pierce

About guest blogger— Dr. Todd Pierce, Locus Technologies

Dr. Pierce manages a team of programmers tasked with development and implementation of Locus’ EIM application, which lets users manage their environmental data in the cloud using Software-as-a-Service technology. Dr. Pierce is also directly responsible for research and development of Locus’ GIS (geographic information systems) and visualization tools for mapping analytical and subsurface data.

Water Lead Contamination—From Rome to Flint

By now, the public health emergency resulting from lead-contaminated water in Flint, Mich., has been made abundantly clear.

The city changed its water source from the Detroit system to the Flint River in April 2014 as a cost-saving measure, exposing its residents to untreated water replete with lead leached from aging pipes. Last September, a local health center found that the proportion of children with elevated lead levels in their blood had nearly doubled since the switch was made. As attention grew around the issue, so too did the public alarm — with good reason. Photos showed Flint residents standing in long lines to collect bottled water and get their children’s blood tested, or standing in court calling for compensation.

And then there were the photos of people holding up samples of the water that had come out of their taps for more than a year. The liquid appears a translucent yellow-brown instead of colorless and clear; if images could emit an odor, these would be foul. But the truly terrifying fact about the water crisis in Flint is invisible. It is the insidious effect of growing up or growing old while unknowingly allowing lead into your bloodstream. According to the World Health Organization, lead creates developmental and behavioral issues in children that are believed to be irreversible.

Water lead poisoning has occurred not just in Flint but all over the country, for decades — and not only from water, but (primarily) from the paint that colors old homes.

On the federal level, there is no comprehensive understanding of the extent to which the population is being exposed to hazardous amounts of lead. Why? Because there is no federal or even state water quality database which public or impacted communities could mine for information. There is a better way. EPA and other agencies responsible for water quality must move into a new century and install a centralized, web-based water quality database where all testing results they collect from various reporting entities should be stored and make accessible in real-time to the general public. That type of transparency is the only way to avoid another Flint. The technology exists but political will may not be there yet.

Flint may have in recent months become synonymous with lead contamination in America, but it is by no means the only — or the most extreme — example of how the toxic element can make its way into our bodies.

Some historians argue that the lead poisoning contributed to the decline of the Roman empire. A team of archaeologists and scientists has recently discovered just how contaminated Roman tap water was. The team dredged sediment downstream from Rome in the harbor basin at Portus, a maritime port of imperial Rome, and from a channel connecting the port to the Tiber River. The researchers compared the lead isotopes in their sediment samples with those found in preserved Roman piping to create a historical record of lead pollution flowing from the Roman capital. Tap water from ancient Rome likely contained up to 100 times more lead than local spring water.

How come that 2000 years later we have still not learned the lesson?

Locus has been awarded by the Environmental Business Journal (EBJ) for a tenth year running!

Environmental Business Journal (EBJ) Recognizes Firms for Growth and Innovation in 2015

MOUNTAIN VIEW, CA–(Marketwired – February 02, 2016) — Locus Technologies announced today that Environmental Business Journal (EBJ), a business research publication which provides high value strategic business intelligence to the environmental industry, granted the company the 2015 award for Information Technology in the environmental and sustainability industry for the tenth year running.

Locus was recognized for continuing its strategic shift to configurable Multitenant pure Software as a Service (SaaS) EHS solutions and welcoming new, high profile customers. In 2015 Locus scored record revenue from Cloud software with annual growth over 20 percent. Locus also achieved a record renewal rate of 99 percent and signed up new customers including Shell Oil Company, Philips 66, Ameresco, California Dairies, Cemex, Frito-Lay, Genentech, Lockheed Martin, PPG Industries, United Airlines and US Pipe & Foundry. Locus also became the largest provider of SaaS environmental software to the commercial nuclear industry; currently over 50 percent of U.S. nuclear generating capacity uses Locus’ flagship product. Locus’ configurable Locus Platform gained momentum in 2015 with new implementations in the manufacturing, agricultural and energy sectors, including a major contract with Sempra Energy for greenhouse gas management and reporting.

“Locus continues to influence the industry with its forward-thinking product set, pure SaaS architecture, and eye for customer needs,” said Grant Ferrier, president of Environmental Business International Inc. (EBI), publisher of Environmental Business Journal.

“We are very proud and honored to receive the prestigious EBJ Information Technology award in environmental business for a tenth time. We feel it is a testament to our unwavering commitment and dedication to accomplish this level of recognition, especially now as we lead the market by providing robust solutions for the emerging space of cloud and mobile-based environmental information management,” said Neno Duplan, President and CEO of Locus Technologies.

The 2015 EBJ awards will be presented at a special ceremony at the Environmental Industry Summit XIV in San Diego, Calif. on March 9-11, 2016. The Environmental Industry Summit is an annual three-day executive retreat hosted by EBI Inc.

EU introduces more efficient monitoring of drinking water quality

New EU rules to improve the monitoring of drinking water across Europe come into force, improving access to wholesome and clean drinking water in Europe. As a first step following the European Citizens’ Initiative Right2Water, new rules adopted by the European Commission today provide flexibility to Member States as to how drinking water quality is monitored in around 100,000 water supply zones in Europe. This will allow for more focused, risk-based monitoring, while ensuring full protection of public health.

This new monitoring and control system will allow member states to reduce unnecessary analyses and concentrate on controls that really matter. This amendment of the Drinking Water Directive is a response to calls by citizens and the European Parliament to adopt legislation ensuring a better, fair and comprehensive water supply. It allows for an improved implementation of EU rules by Member States as it removes unnecessary burdens. Member States can now decide, on the basis of a risk assessment, which parameter to monitor given that some drinking water supply zones do not pose any risk for finding hazardous substances. They can also choose to increase or reduce the frequency of sampling in water supply zones, as well as to extend the list of substances to monitor in case of public health concerns. Flexibility in the monitoring of parameters and the frequency of sampling is framed by a number of conditions to be met, to ensure protection of citizens’ health. The new rules follow the principle of ‘hazard analysis and critical control point’ (HACCP), already used in food hygiene legislation, and the water safety plan approach laid down in the World Health Organization’s (WHO) Guidelines for Drinking Water Quality. Member States have two years to apply the provisions of this new legislation.

In order to effectively manage sampling and monitoring data at over 100,000 water supply zones water utilities and other stakeholders will need access to software like Locus EIM Water to organize complex water quality management information in real time and automate laboratory management programs and reporting. Locus EIM has been in use by numerous water utilities in the United States.