The Environmental Protection Agency (EPA) announced that it would impose stricter requirements on water utilities to manage lead and copper contamination in drinking water supplies. The EPA said that tackling water pollution is a core duty of the agency.
The proposed changes, the first affecting lead level in water since 1991, would also give utilities more time to replace lead pipes in their systems. Some environmental groups are not happy with the proposed rule because the change slows by 20 years the timeline for removing aging lead service pipes that could expose children to lead. Lead is a toxin known to harm developing brains. The rule slows down the removal of pipelines where lead levels exceed 15 μg/L to 33 years from the 13 years in the original law.
The new rule requires water utilities to identify and remove sources of lead when a water sample at faucet exceeds 15 micrograms per liter (μg/L). The EPA said water systems would also have to follow new, improved sampling procedures and adjust sampling sites to better target locations with higher lead levels.
Health advocates estimate that as many as six million or more lead water lines remain underground in U.S. cities and towns. Additional sampling and monitoring can help to identify affected areas, and ensure the quality of drinking water sources.
https://www.locustec.com/wp-content/uploads/2019/10/locus_graphic-drinking-water_800x500.jpg500800Neno Duplanhttps://www.locustec.com/wp-content/uploads/2023/12/locus_logo_2x.pngNeno Duplan2019-10-16 12:42:292025-03-17 12:38:06EPA to set tougher requirements for lead in water
At Locus Technologies, we’re always looking for innovative ways to help water users better utilize their data. One way we can do that is with powerful technologies such as machine learning. Machine learning is a powerful tool which can be very useful when analyzing environmental data, including water quality, and can form a backbone for competent AI systems which help manage and monitor water. When done correctly, it can even predict the quality of a water system going forward in time. Such a versatile method is a huge asset when analyzing data on the quality of water.
To explore machine learning in water a little bit, we are going to use some groundwater data collected from Locus EIM, which can be loaded into Locus Platform with our API. Using this data, which includes various measurements on water quality, such as turbidity, we will build a model to estimate the pH of the water source from various other parameters, to an error of about 1 pH point. For the purpose of this post, we will be building the model in Python, utilizing a Jupyter Notebook environment.
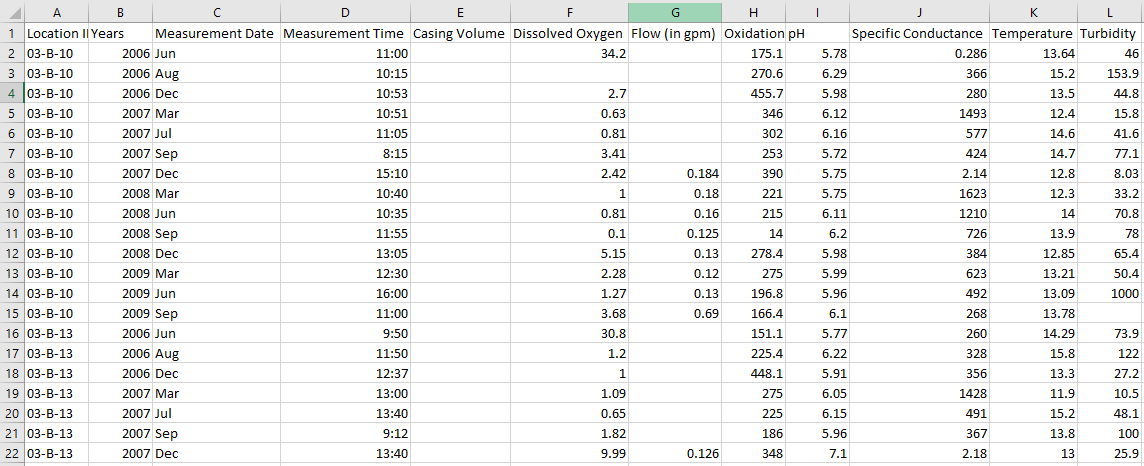
When building a machine learning model, the first thing you need to do is get to know your data a bit. In this case, our EIM water data has 16,114 separate measurements. Plus, each of these measurements has a lot of info, including the Site ID, Location ID, the Field Parameter measured, the Measurement Date and Time, the Field Measurement itself, the Measurement Units, Field Sample ID and Comments, and the Latitude and Longitude. So, we need to do some janitorial work on our data. We can get rid of some columns we don’t need and separate the field measurements based on which specific parameter they measure and the time they were taken. Now, we have a datasheet with the columns Location ID, Year, Measurement Date, Measurement Time, Casing Volume, Dissolved Oxygen, Flow, Oxidation-Reduction Potential, pH, Specific Conductance, Temperature, and Turbidity, where the last eight are the parameters which had been measured. A small section of it is below.
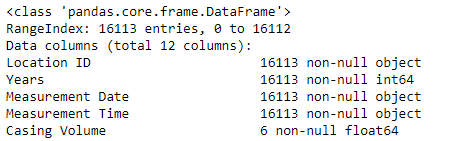
Alright, now our data is better organized, and we can move over to Jupyter Notebook. But we still need to do a bit more maintenance. By looking at the specifics of our data set, we can see one major problem immediately. As shown in the picture below, the Casing Volume parameter has only 6 values. Since so much is missing, this parameter is useless for prediction, and we’ll remove it from the set.
We can check the set and see that some of our measurements have missing data. In fact, 261 of them have no data for pH. To train a model, we need data which has a result for our target, so these rows must be thrown out. Then, our dataset will have a value for pH in every row, but might still have missing values in the other columns. We can deal with these missing values in a number of ways, and it might be worth it to drop columns which are missing too much, like we did with Casing Volume. Luckily, none of our other parameters are, so for this example I filled in empty spaces in the other columns with the average of the other measurements. However, if you do this, it is necessary that you eliminate any major outliers which might skew this average.
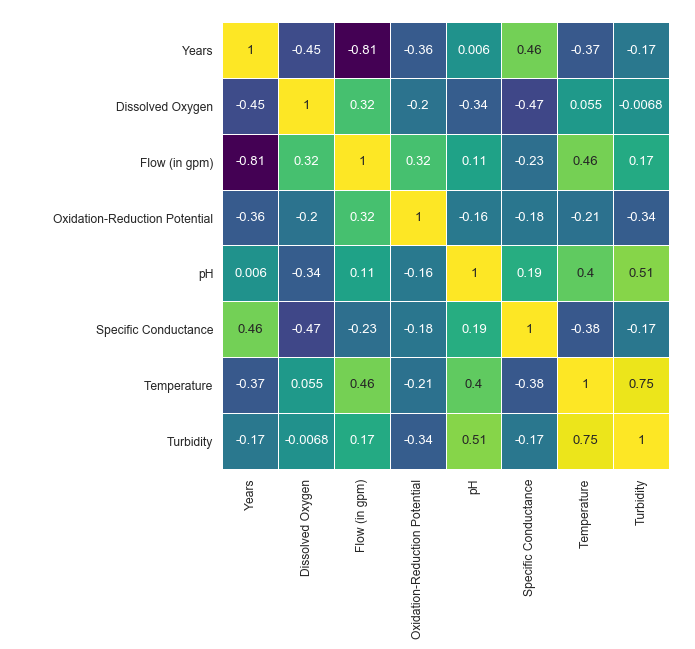
Once your data is usable, then it is time to start building a model! You can start off by creating some helpful graphs, such as a correlation matrix, which can show the relationships between parameters.
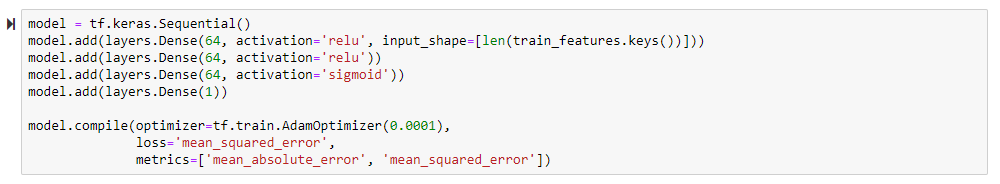
For this example, we will build our model with the library Keras. Once the features and targets have been chosen, we can construct a model with code such as this:
This code will create a sequential deep learning model with 4 layers. The first three all have 64 nodes, and of them, the initial two use a rectified linear unit activation function, while the third uses a sigmoid activation function. The fourth layer has a single node and serves as the output.
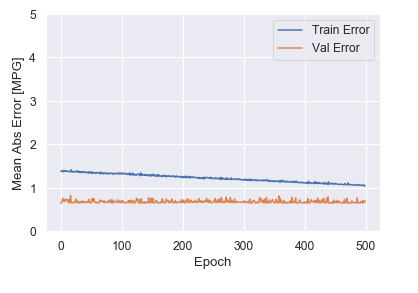
Our model must be trained on the data, which is usually split into training and test sets. In this case, we will put 80% of the data into the training set and 20% into the test set. From the training set, 20% will be used as a validation subset. Then, our model examines the datapoints and the corresponding pH values and develops a solution with a fit. With Keras, you can save a history of the reduction in error throughout the fit for plotting, which can be useful when analyzing results. We can see that for our model, the training error gradually decreases as it learns a relationship between the parameters.
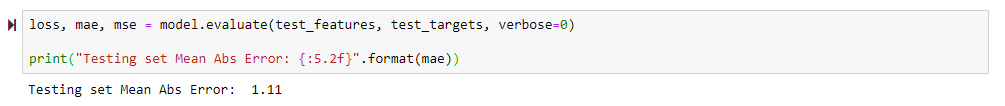
The end result is a trained model which has been tested on the test set and resulted in a certain error. When we ran the code, the test set error value was 1.11. As we are predicting pH, a full point of error could be fairly large, but the precision required of any model will depend on the situation. This error could be improved through modifying the model itself, for example by adjusting the learning rate or restructuring layers.
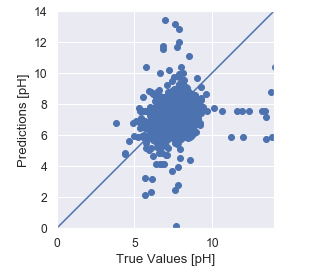
You can also graph the true target values with the model’s predictions, which can help when analyzing where the model can be improved. In our case, pH values in the middle of the range seem fairly accurate, but towards the higher values they become more unreliable.
So what do we do now that we have this model? In a sense, what is the point of machine learning? Well, one of the major strengths of this technology is the predictive capabilities it has. Say that we later acquire some data on a water source without information on the pH value. As long as the rest of the data is intact, we can predict what that value should be. Machine learning can also be incorporated into examination of things such as time series, to forecast a trend of predictions. Overall, machine learning is a very important part of data analytics and the development of powerful AI systems, and its importance will only increase in the future.
What’s next?
As the technology around machine learning and artificial intelligence evolves, Locus will be working to integrate these tools into our EHS software. More accurate predictions will lead to more insightful data, empowering our customers to make better business decisions.
https://www.locustec.com/wp-content/uploads/2019/09/locus_screenshot_machine-learning-predict.png279330Locus Product Teamhttps://www.locustec.com/wp-content/uploads/2023/12/locus_logo_2x.pngLocus Product Team2019-09-11 07:40:592025-03-17 12:38:06Predicting Water Quality with Machine Learning
Locus will provide cloud environmental water quality software with GIS and mobile integration
MOUNTAIN VIEW, Calif., 9 July 2019 — Locus Technologies, (Locus), the industry leader in water quality, EHS, sustainability, and compliance management software, is pleased to announce that the City of San Marcos, Texas Water/Wastewater Utility selected Locus Environmental Information Management (EIM) software to streamline water quality and wastewater management and compliance.
“With Locus’ water quality software we can streamline and modernize how we manage and report our critical water quality and wastewater data,” said Ron Riggins, San Marcos Water Quality Manager. “With an integrated mobile application, we will be able to access and react to field information faster than ever before.”
“By selecting Locus EIM water quality software, the City of San Marcos, Texas can simplify managing water and wastewater data and integrate with their existing GIS system. This will provide them a modern cloud solution with fully integrated mobile capabilities,” said Wes Hawthorne, President of Locus.
https://www.locustec.com/wp-content/uploads/2019/07/San-Marcos_logo_380x200.jpg200380Locus Webmasterhttps://www.locustec.com/wp-content/uploads/2023/12/locus_logo_2x.pngLocus Webmaster2019-07-08 02:00:132025-03-12 09:06:19City of San Marcos, Texas selects Locus water quality compliance software
In most cities in the US, drinking water quality conforms with the norms of the Safe Drinking Water Act, which requires EPA to set Maximum Contaminant Levels (MCL) for potential pollutants. Besides, the EPA’s Consumer Confidence Rule (CCR) of 1998 requires most public water suppliers to provide consumer confidence reports, also known as annual water quality reports, to their customers.
PFAS stands for “perfluoroalkyl and polyfluoroalkyl substances,” with the most important thing to know that this large group of synthetic chemicals includes perfluorooctanoic acid (PFOA) and perfluorooctane sulfonate (PFOS).
Not Regulated by EPA
When it comes to drinking water from the tap in the US, the phrase that fits concerning PFOA and PFOS is “caveat emptor” (buyer beware). The EPA has not regulated these chemicals. There are no federal regulations for PFOA and PFOS in drinking water in the US.
In May 2016, the EPA established a drinking water “health advisory” of 70 parts per trillion (ppt) for the combined concentrations of PFOA and PFOS. While that was a start, there’s a big difference between a health advisory and a regulation that has teeth. Moreover, many scientists consider 70 ppt too high a limit. Reportedly, the EPA is considering turning its 70 ppt health advisory into regulation.
Meanwhile, some states have stepped up to the plate to protect their residents and visitors better. In April 2019, for instance, the New Jersey Department of Environmental Protection (DEP) proposed maximum contamination levels (MCLs) of 14 ppt for PFOA and 13 ppt for PFOS in the state’s drinking water.
As a water consumer, you should be aware of this crisis, as it has the potential to affect both your health and wealth.
What are PFOA and PFOS?
This toxic couple has contaminated the drinking water supply in areas surrounding some industrial sites and military bases. They’re the most studied of the PFAS group because they’re the ones that have been produced in the most significant quantities in the United States, according to the US Environmental Protection Agency (EPA).
PFOA and PFOS, which repel water and stains of various types, have been used as coatings on fabrics and leather and in the production of stain-repellent carpeting and are found in firefighting foams — which have been used extensively on US military bases for decades — among other products. Moreover, some related polyfluoroalkyl compounds can be transformed into these chemicals in the environment, per the National Institutes of Health (NIH), with the Environmental Working Group (EWG) stating that some perfluorinated chemicals not only break down into PFOA in the environment but also can do so in the human body.
While PFOA and PFOS are no longer made in the US, that hardly matters in our global economy. Both are still produced internationally, which means they end up in our country via imports of consumer goods such as carpet, apparel, textiles, and paper and packaging.
Why all the concern about PFOA and PFOS?
These chemicals — dubbed “forever chemicals” because they’re persistent in the environment and the human body — have been linked to cancer, thyroid disease, weakened the immune system and liver function, low infant birth weight, and other health problems, according to many sources.
And this is what the EPA says: “There is evidence that exposure to PFAS can lead to adverse health outcomes in humans. If humans, or animals, ingest PFAS…the PFAS are absorbed and can accumulate in the body. PFAS stay in the human body for long periods. As a result, as people get exposed to PFAS from different sources over time, the level of PFAS in their bodies may increase to the point where they suffer from adverse health effects.”
https://www.locustec.com/wp-content/uploads/2015/12/locus_photo_wastewater-discharge-Fos-Su-Mer-France_1280x960.jpg9601280Neno Duplanhttps://www.locustec.com/wp-content/uploads/2023/12/locus_logo_2x.pngNeno Duplan2019-05-27 15:08:012025-03-17 12:38:07Is PFAS Contamination in US Drinking Water Supply the Next Crisis?
In most industrialized cities around the world, drinking water is readily available and safe. Safeguarding groundwater (aquifers), streams, rivers, reservoirs, and lakes is crucial to continue delivering clean water on the tap. So is testing and validated water quality data. There are several aspects of drinking water quality that is of concern in the United States, including Cryptosporidium, disinfection by-products, lead, perchlorates, and pharmaceutical substances.
Recent headlines about water quality issues in cities like Flint, Pittsburgh, Asheville, or Rome and Cape Town are motivating consumers to ask more questions about their water quality. Albuquerque’s groundwater is becoming seriously depleted; Fresno’s groundwater is highly susceptible to contamination; In Atlanta, Chicago, Detroit, Houston, Los Angeles, New Orleans, Newark, Philadelphia, Phoenix, San Diego and Washington, D.C., source water is threatened by runoff and industrial or sewage contamination; Water supplies in Baltimore, Fresno, Los Angeles, New Orleans, San Diego, and several other cities are vulnerable to agricultural pollution containing nitrogen, pesticides or sediment.
Locus Technologies IoT Monitoring. Connected at all times.
In most cities in the US, drinking water quality is in conformity with the norms of the Safe Drinking Water Act, which requires EPA to set Maximum Contaminant Levels (MCL) for potential pollutants. In addition, the EPA’s Consumer Confidence Report (CCR) Rule of 1998 requires most public water suppliers to provide consumer confidence reports, also known as annual water quality reports, to their customers. Each year by July 1 anyone connected to a public water system should receive in the mail an annual water quality report that tells where water in a specific locality comes from and what’s in it. Locus EIM automates this reporting and allows utilities to be transparent by publishing CCR online in real time so that consumers have access to their CCR at all times. Consumers can also find out about these local reports on a map provided by EPA.
Utilities must maintain good water quality records and manage them in a secure database with built-in alerts for any outliers so that responsible water quality managers can react quickly when there is exceedance of MCL or another regulatory limit.
https://www.locustec.com/wp-content/uploads/2019/12/locus-employee-with-tablet-field-data-2.jpg14782232Neno Duplanhttps://www.locustec.com/wp-content/uploads/2023/12/locus_logo_2x.pngNeno Duplan2019-04-19 07:23:462025-03-17 12:39:09EHS Digital Transformation: Managing Drinking Water Quality Data and Compliance: CCR in the Cloud
Manage all those ops readings without spreadsheets or paper forms
I am constantly reminded by the number of calls we receive, that no matter how robust a SCADA and HMI system is, there is always a requirement for in-field O&M verification and documentation. It’s almost universal, and spans a myriad of industries, large and small, the need to monitor and record thousands of periodic (daily/per shift/weekly, etc.) routine readings/recordings at a prescribed frequency often recorded on pen to paper field forms. The same processes sometimes use “template” spreadsheets for data collection that are then emailed/placed on shared file servers or otherwise sent to some central location for review and post processing. These processes are antiquated and subject to data quality and record keeping challenges.
It’s time for an upgrade!
Why simple form builders are not a good software solution for ops data
Electronic forms are great for collecting data and almost every business entity has built such forms in spreadsheets, word processing or simple databases to collect the information. In addition, there is a software category of form builders and they can certainly build forms. The question becomes is it a good fit so solve your business process issues? Most customers have more sophisticated needs than simply collecting information on one or more custom forms – they want to do something with all the information collected far beyond what simple form builder tools can provide. Even customers with sophisticated spreadsheet forms, can’t manage them as they multiply exponentially or their Excel gurus retire.
Here are some examples of where you may require software tools beyond a simple form builder:
Collecting equipment readings on each shift at multiple locations and report the data to centralized management, who review the data, look for trends/ issues.
Verifying and validating data at the point of data entry to eliminate data entry errors.
Automatically visualizing (charts or tables) information in near real time to make operations decisions.
Sharing the information with others.
Scheduling activities related to periodic or infrequent data collection events.
Receiving notifications when actions are due.
Automatically creating regulatory reports in prescribed formats.
Creating complex work flows and audited approval processes.
Creating intelligent forms with calculations based on past data or other criteria
Forms with Benefits
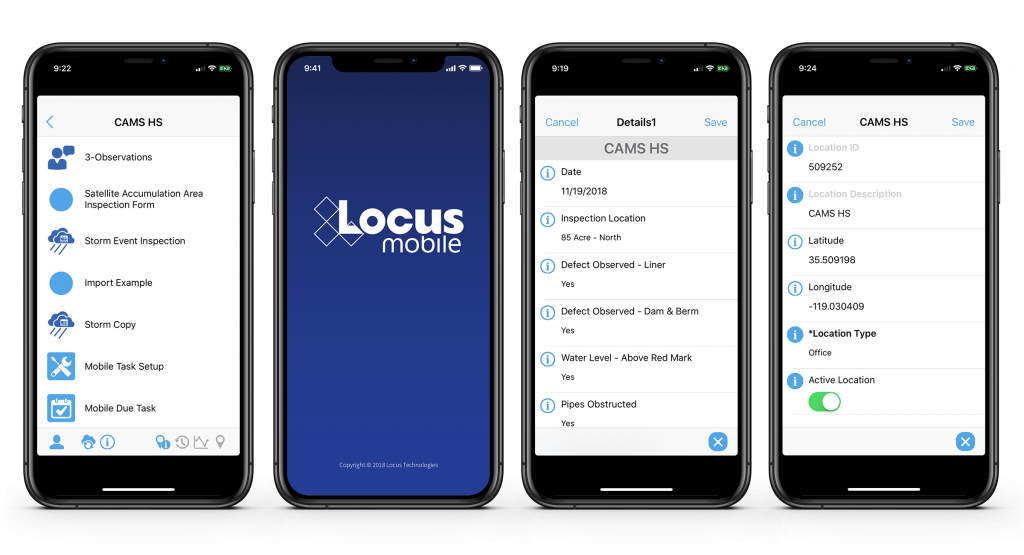
Locus Platform is a configurable platform with standard applications that are easy to configure to customers unique requirements. One of its many strengths is its powerful form builder capable of creating simple or complex forms with simple or sophisticated logic. So for customers looking to move from paper and spreadsheet templates, it’s an excellent option to consider, especially if you require more than a simple “fill in the blank” form for transmittal using mobile devices. Best of all, the data are securely stored in a database structure for reporting and alternative business uses and analyses, compared to the almost impossible management of hundreds of spreadsheets or paper forms.
Here are some examples where sophisticated forms are integrated with a flexible database:
Water Utilities – Tracking chlorination and aerobic digestion processes with daily inputs/outputs with a monthly summary and chart, and tracking well production across well fields.
Water Utilities – Tracking periodic sewer discharges and water samples for permit compliance.
Agriculture – Monitoring food processing equipment for compliance with optimum equipment operating parameters for air permits.
Pharmaceutical/Chemical Manufacturing Facilities- Tracking EHS daily, weekly, monthly, etc. investigations and in-house audits.
Universities – tracking chemical inventories.
Facility Engineering – Documenting O&M activities for groundwater treatment systems.
Electric Utilities – Monitoring water/energy/gas usage from old style meters for sustainability reporting with data entry validation.
Refineries and Terminals – Collecting O&M, usage and wastewater data.
If you still rely on paper forms and template spreadsheets and are ready to streamline your process and enhance the value of your data, give us a call and we can show you a range of options that will retire the paper forms for good!
https://www.locustec.com/wp-content/uploads/2018/06/data-is-complex-cover.jpg600900Locus Product Teamhttps://www.locustec.com/wp-content/uploads/2023/12/locus_logo_2x.pngLocus Product Team2019-03-18 09:17:222025-03-17 12:39:09A better way to manage all those ops readings
Last month I got the opportunity to attend AWWA Water Quality and Technology Conference in Toronto, Canada. I was very enthusiastic to interact first hand with end-users of different water technology tools, and interact with other water technology professionals. It’s one thing to design software and support it, it’s a whole different thing to sit and talk with the real customers and real end users and get unfiltered feedback.
As a Product Manager, I’m usually connected with our customers by the various email and messaging systems that provide an endless amount of documentation, but nothing can substitute for an in person conversation. I heard first-hand how there is a need to change existing business practices and stop using older, non-integrated systems that only provide part of the data solution. This scenario is not a new problem; there is a need by most water entities to centralize data, and more easily load, share, analyze and report data. I have had this general conversation many times, but the more in depth, one-on-one conversations about sample planning and data collection provided the most useful feedback. I had the opportunity to give a brief demonstration on “Scheduling and collecting routine water samples using Locus Mobile and EIM” at AWWA, which provided a great venue for candid feedback. Based on these conversations, I have summarized a list of frequent challenges that users encounter during their water sampling process and how they can be solved using the right tools or better communications.
Challenge 1: Finding a flexible sampling planning tool
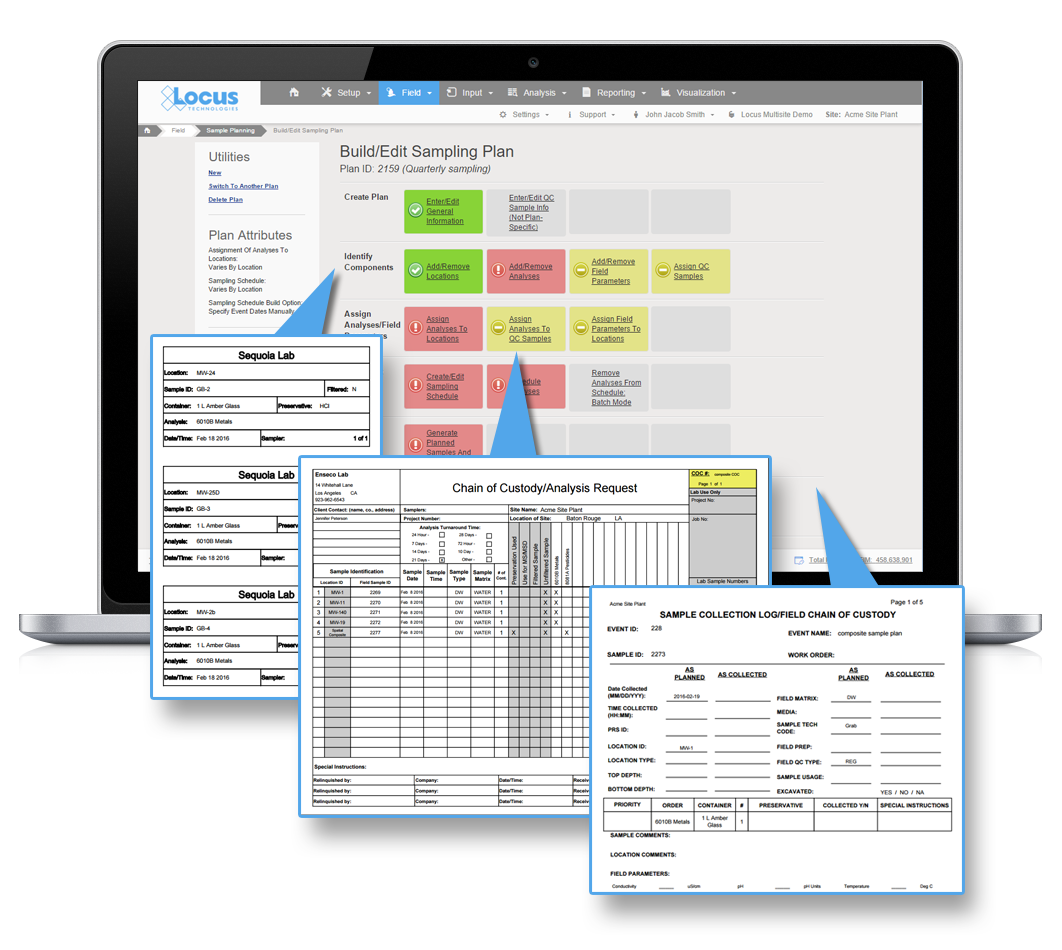
The overall feedback I heard from attendees is their sampling is generally routine, but the planning tools need to allow flexibility in terms of different sampling intervals and date ranges, different field and analytical parameters, and account for location grouping. Using a well-designed application can pull together all of this detailed information, and can provide a summary view of the individual samples. A manager can easily view sample status, and whether the sample is complete, in process, or planned. A well-designed application can also generate the chain of custody (COC), and lab and sample shipping date information and labels per sample, which is a huge time saver. This type of sample tracking detail seemed to be very useful to many conference attendees to help ensure they are in regulatory compliance with required sampling frequencies. A key feature to look for is an application that is flexible enough that it can allow one-time, unplanned sample events such as water main breaks, customer complaints and schedule changes, and can handle complex multi-year routine sampling with ease. As a plus, it’s easy for you or your manager to know where you stand at any time.
Challenge 2: Eliminating data entry errors caused by hand data entry
Everyone I talked with had dealt with data entry errors and fixing bad data when it was transcribed from field notes to Excel or other programs. Everyone wanted a better way to streamline the error prone data collection process. Many attendees were interested in an alternative to the pencil/paper/clipboard method and had goals to move to tablet or smartphone for data collection. As a field data collection mobile product manager, this was my area of expertise. The universal wish list for mobile field applications included:
Easy to use and set up
Built in data validation to catch data entry errors at the source
Direct upload to a data system so the end of the day all the daily samples were in the system with the push of a button
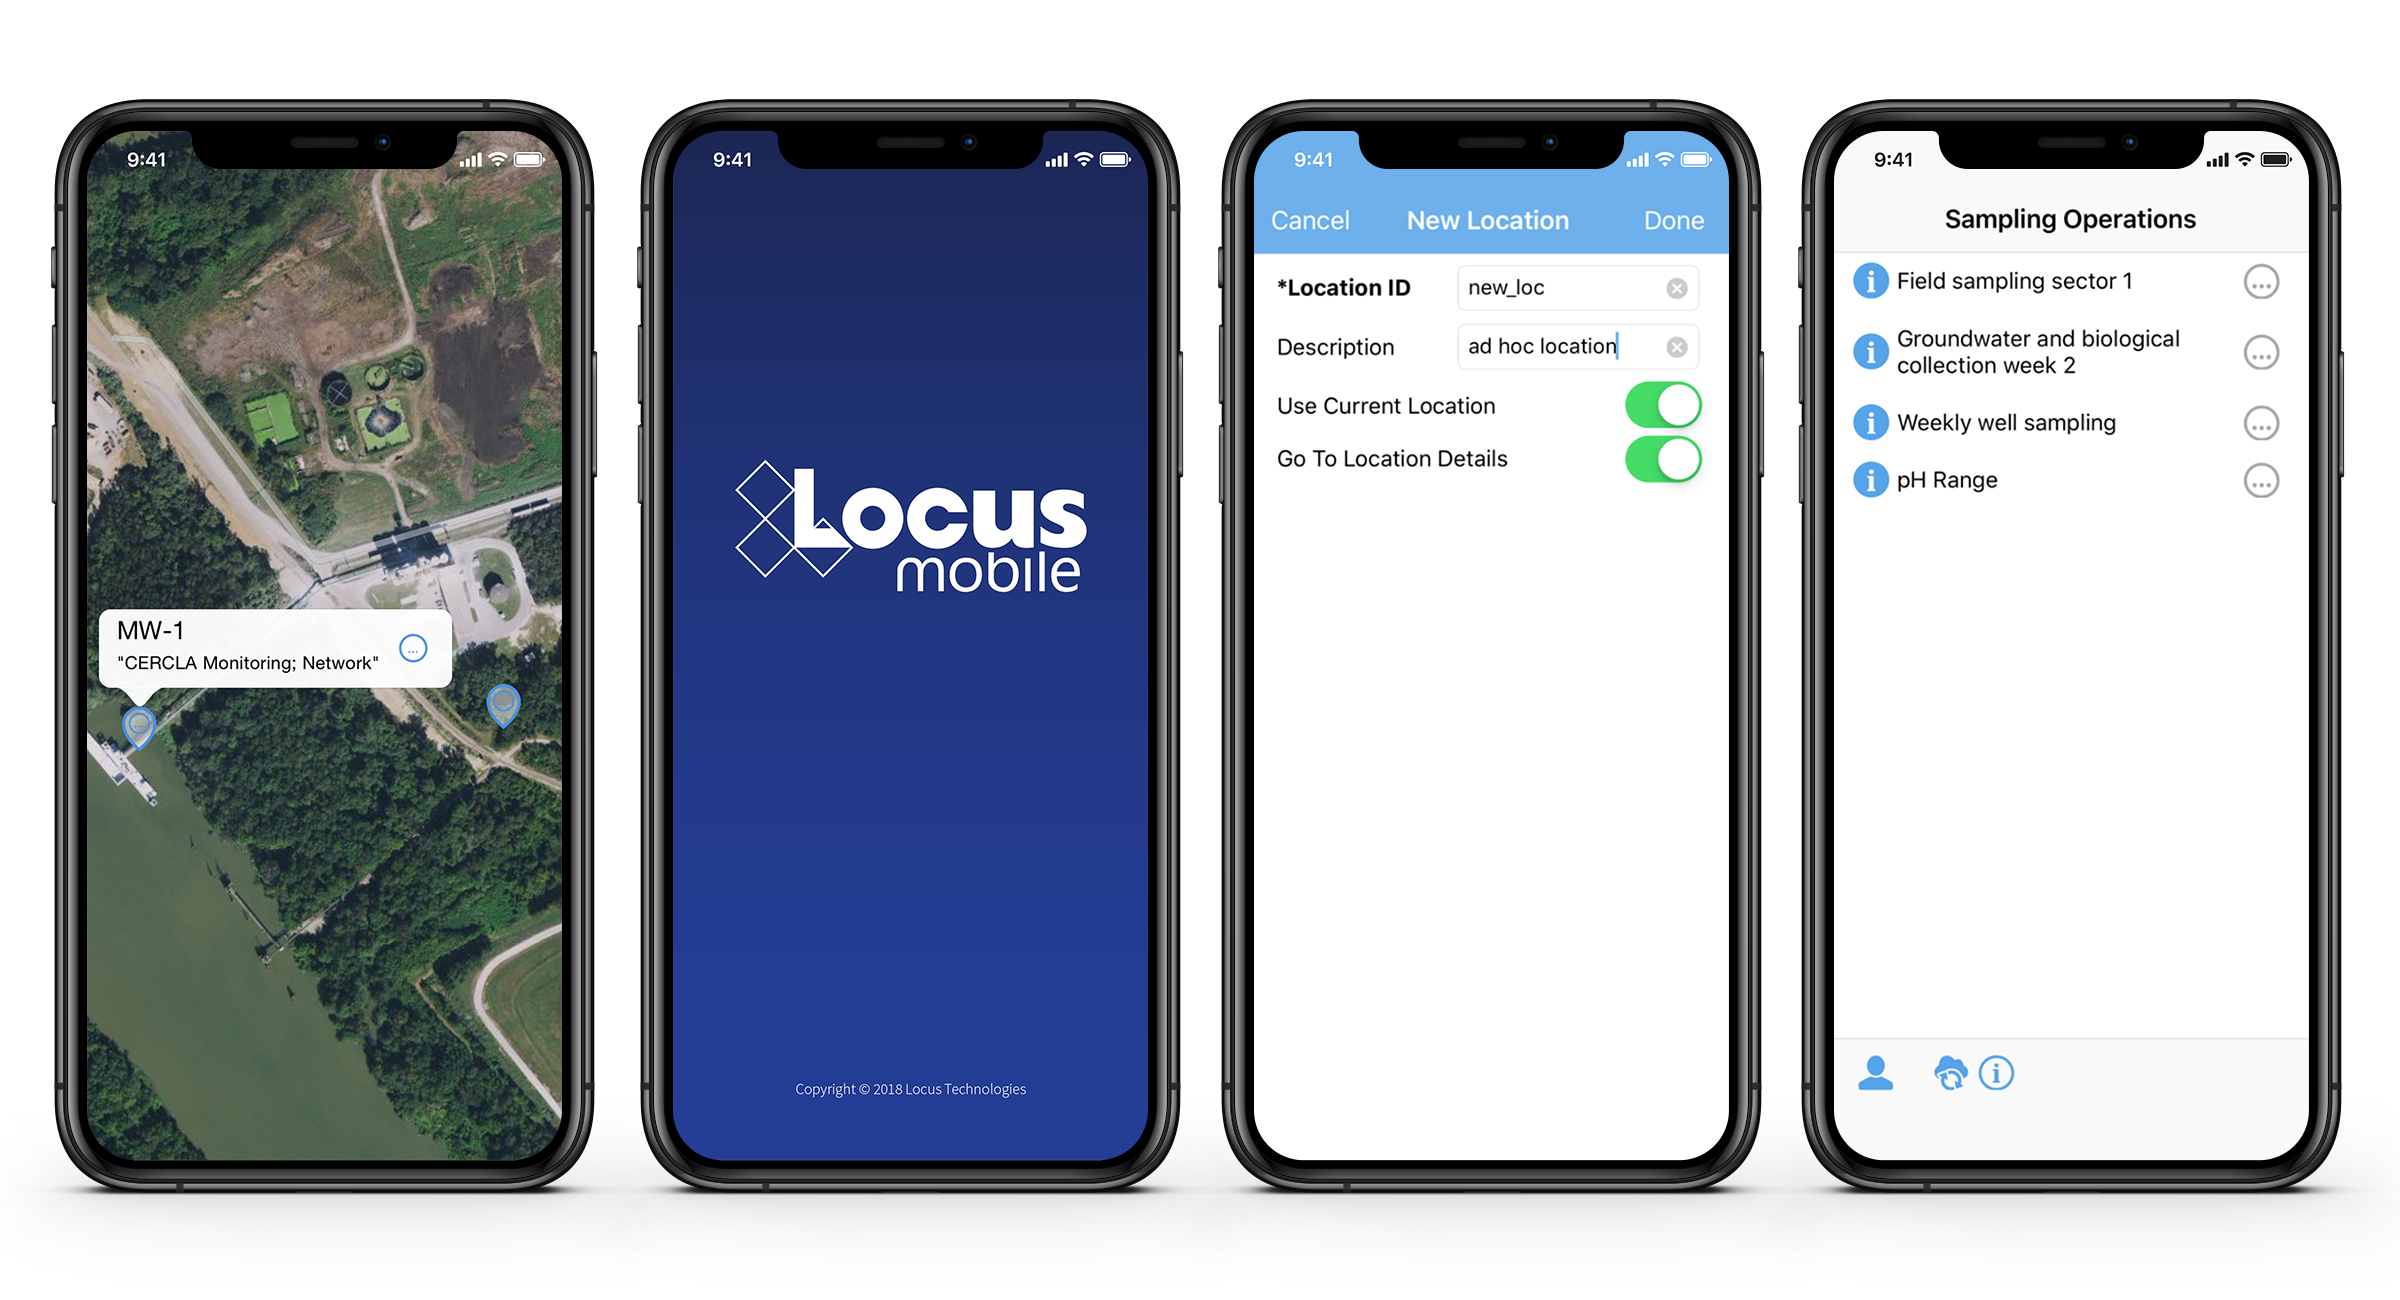
Prepopulating locations especially for large water systems
Complete field instructions for samplers on what to collect and where to collect it to eliminate missed samples
Smart tracking to know on a daily/weekly basis, what samples were collected and what samples were still outstanding
Integrated with sample planning tools (See challenge 1) to automate the sampling instructions and track the data collection activities vs plan
Challenge 3: Getting the most out of their software, especially regarding updates
Everyone one is aware that software updates all the time. Sometimes its security enhancements and sometime feature enhancements or bug fixes. Based on feedback from attendees, a source of frustration is getting a software update and not knowing what was updated or how best to incorporate a new feature/enhancement into their established process. There was also concern for impact to an established routine with field crews that were used to the existing way of doing things. Even if a functionality improved the workflow, enhancements are only valuable to a user if they understand how to use them and how to incorporate them into their existing process.
Some suggestions from the attendees included:
Concurrent documentation updates with software updates
“Quick start” guides for new functionality
Online training on the new functionality with recording for later viewing
Heads up on what is coming in the next several months so they can do strategic planning (sharing the roadmap)
Sandbox environment to test the enhancements before going in production so they can plan how to incorporate the features into their process and train field crews
Mobile applications, which appear very simple to the users, are in reality complex software and require careful integration with the receiving database for a range of complex use cases. This makes rolling out new mobile features challenging for both the developers and the users. Enhanced customer/developer communication along with a sandbox environment can go a long way towards solving some of the inherent issues with rapid innovations and updates associated with cloud and mobile software.
Take Aways
In person feedback beats everything
Communication is key.
Software tools are available and can solve a lot of the common data management challenges, but know what you want, know the problem you are trying to solve, and know it will take some time and effort but the end result will significantly improve your business processes.
About the author—Bill Donaldson, Locus Technologies
Mr. Donaldson has 5 years experience in SaaS systems, performing Product Management and QA/QC of Locus Mobile iOS application and Locus’ Environmental Information Management system (EIM). While completing his B.S., Mr. Donaldson held several paid internships, where he configured a Relational GeoDatabase and a Database Management System (DBMS), for biological data entry.
https://www.locustec.com/wp-content/uploads/2018/12/bill-at-booth.jpg30244032Bill Donaldsonhttps://www.locustec.com/wp-content/uploads/2023/12/locus_logo_2x.pngBill Donaldson2018-12-10 14:57:362025-03-17 12:39:10Solving water utility data management challenges—one conversation at a time
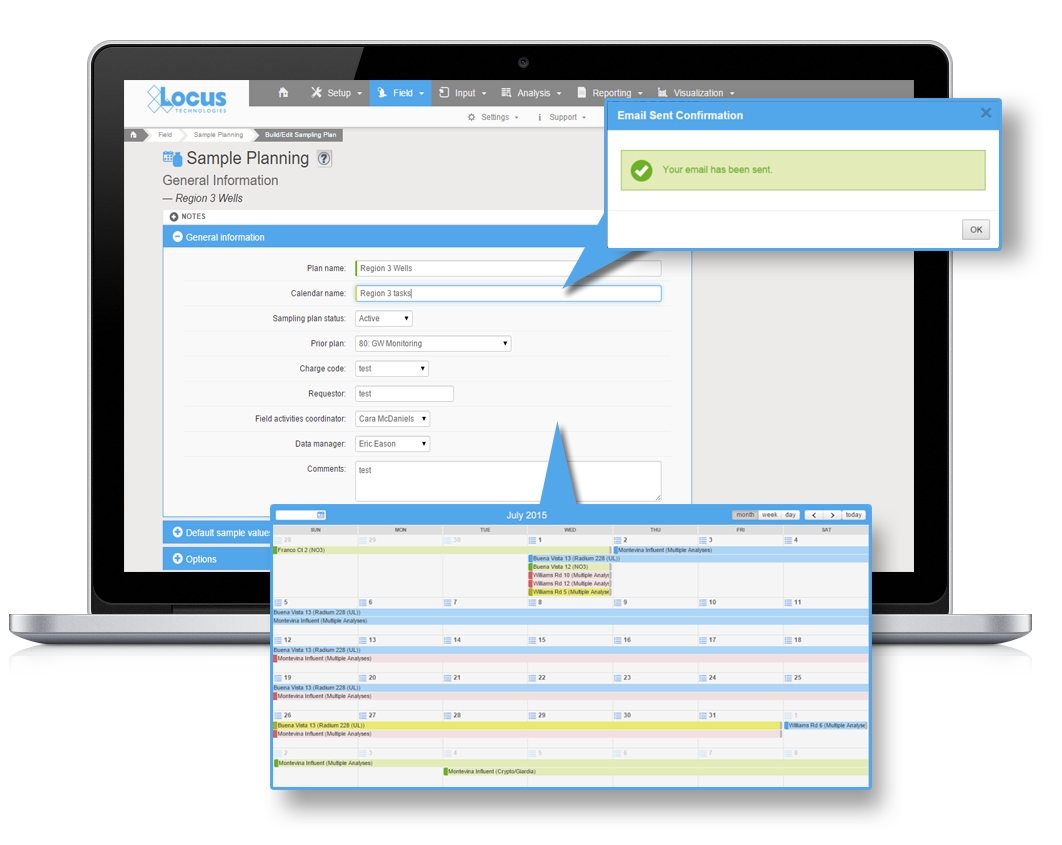
Sample planning can be a valuable and necessary tool for many in highly regulated fields, including water utilities, where adherence to regulatory defined sampling schedules is essential. Moreover, if you have reviewed the drinking water requirements, you know the regulations require complex and variable schedules ranging from monthly samples at routine locations for a set list of parameters to once every five, seven, or nine years at other locations for a completely different list of parameters. Missing a required sampling event can mean fines and public notice to customers.
Other industries face similar complex sampling needs and the financial and reputational impacts can be hefty for missing required samples. So if you are currently an EIM user, or considering an environmental information management system, don’t forget about sample planning components that will save you time and money.
Here are some benefits of Sample Planning that may make you a believer.
Streamline routine or repetitive sampling – set it up once and reuse or modify as needed
Sample Planning in EIM excels in streamlining repetitive sampling, such as required drinking water samples, or quarterly monitoring well samples. Any sampling events with a schedule from daily to once every 10 years can be planned in EIM’s module and reused again and again, even with tweaks to the schedule for the samples to be collected. Imagine the time savings and the simplicity of having your regulatory requirements all lined out for the year and not have to worry about missing required samples. For water utilities, this is especially valuable given the very strict schedules and the public health implications of missing sampling events.
Automatically generate COCs and bottle labels
When samples are planned in EIM, it is a few simple clicks of the mouse to generate COCs, work lists, and bottle labels for the field crew. This saves time for the field and office staff, and helps ensure they collect the needed samples and not miss a collection or a field or laboratory parameter. Moreover, higher levels of accuracy and fewer transcription errors are ensured as sample IDs and requested analyses are printed electronically rather than entered by hand.
Its fully integrated with Locus Mobile – you can send your Sample Plan to field staff to ensure they collect the samples needed
For customer’s considering using Locus Mobile to streamline their field data collection, Sample Planning is a natural fit. All the samples planned in the Sample Planning module can be delivered directly to Locus Mobile for one or more field staff. You can even have multiple different events sent to the field crew so they can plan ahead in the field. All the collected data is uploaded to EIM in real-time (if service is available) or later (if not) for review and final checks after the field event is concluded. Imagine giving your sampling teams the weekly plan and tracking the progress each day as they sync their data. A handy feature of Locus Mobile, it can remove all the previously collected samples from the plan each day to make your field sampler’s life much simpler.
Larger drinking water utilities will find the integration of Sample Planning and mobile quite appealing, especially with daily sampling by multiple sampling teams and a large number of required routine samples.
All your required field sample information is already in EIM for your sampling event.
When lab data comes back from the lab, you no longer need to enter in the field sample information, it will already be in EIM.
For drinking water utilities, where you may be sampling daily for chlorine at your sample locations, imagine seeing the results across your distribution system instantly, and ability to see it on a map in near real time. Even better, you can share the results with your operations team with a simple dashboard link.
Always know where you stand on your sampling activities
By using Sample Planning, you will know exactly what samples have and have not been collected. You will also know which ones were collected late, and which ones are yet to be collected. This type of information can help ensure you don’t’ miss required samples, and identify schedule impacts when collection is not going according to plan.
When missed samples are identified, its easy to add to the next day’s sampling and send that information to field teams using the integrated mobile app.
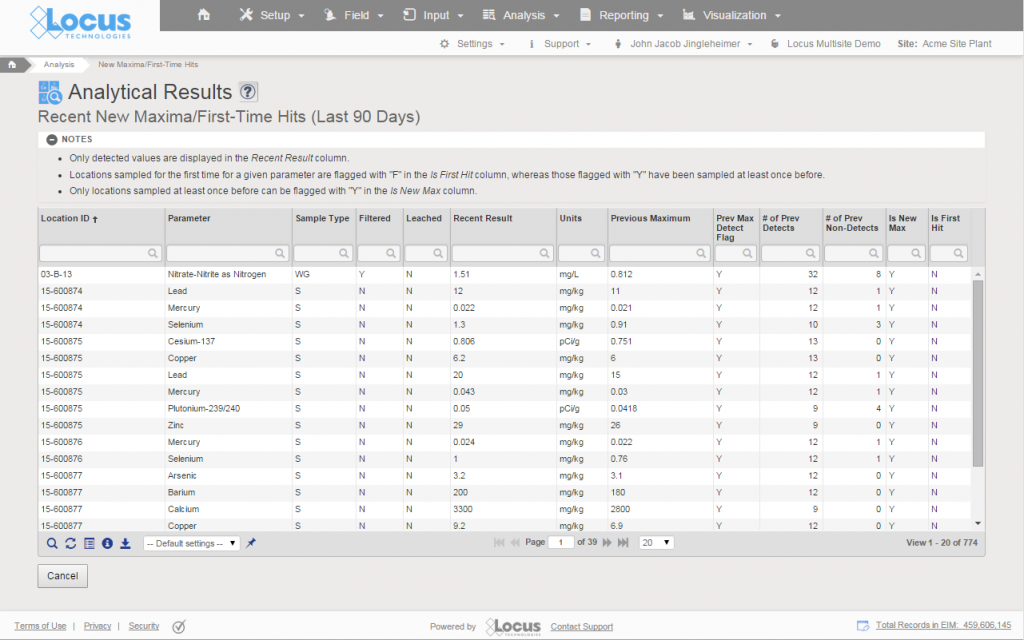
Gain ability to track receipt of laboratory results with fine precision
For customers that need to track laboratory results down to the method and analyte level, Sample Planning will make that tedious task easy. Therefore, if you ordered an EPA Method 6010C analysis and no result for lead is reported, you will know immediately when the results arrive back from the lab that the deliverable is incomplete. EIM will also tell you when the lab substituted one method for another. You can then decide whether this change is acceptable or not. Because most regulations include a long list of required analytes and acceptable methods, this type of detail is invaluable to help ensure that you remain in compliance.
Make review of laboratory invoice easy as pie
Trying to review laboratory invoices, especially for large sampling events or complex sampling programs, can be a chore. With EIM’s Sample Planning module, most of the hard work is already done for you. Once you have all your data back, EIM will tell you:
If the quantity invoiced is more than the order
If an invoiced line item has been invoiced previously
If an invoiced line item total cost and/or unit cost is incorrect
https://www.locustec.com/wp-content/uploads/2015/12/locus_screenshot_water-utility-dashboard-laptop-location-list-ipad_1062x845.png8451062Locus Product Teamhttps://www.locustec.com/wp-content/uploads/2023/12/locus_logo_2x.pngLocus Product Team2018-10-31 11:28:282025-03-17 12:39:10Cut your monitoring costs with EIM sample planning
You can turbocharge your water data management by including a geographical information system (GIS) in your toolkit! Your data analysis efficiency also gets a huge boost if your data management system includes a GIS system “out of the box” because you won’t have to manually transfer data to your GIS. All your data is seamlessly available in both systems.
Not all GIS packages are created equal, though. Here are some tips to consider when looking at mapping applications for your environmental data:
1) Confirm that integration is built-in and thorough
Mapping is easy when properly integrated with your environmental database. You should not need extra filters or add-on programs to visualize your data. Look for built-in availability of features, such as “click to map”, that take the guesswork and frustration out of mapping for meaningful results.
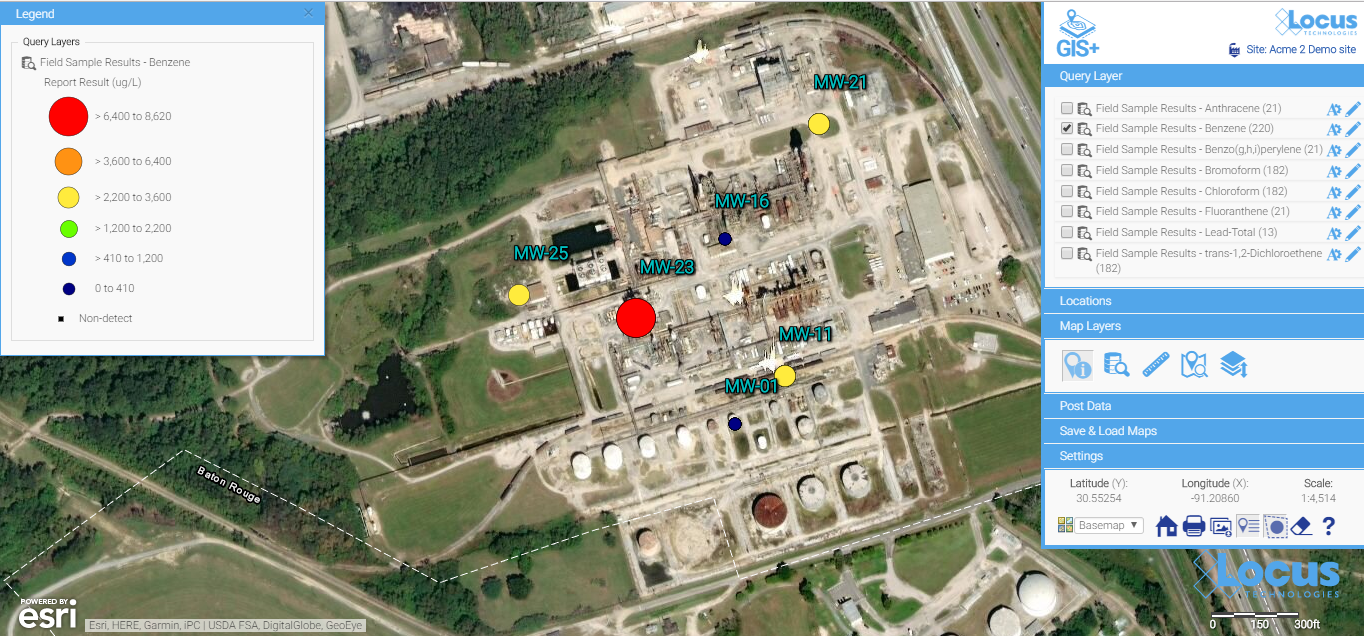
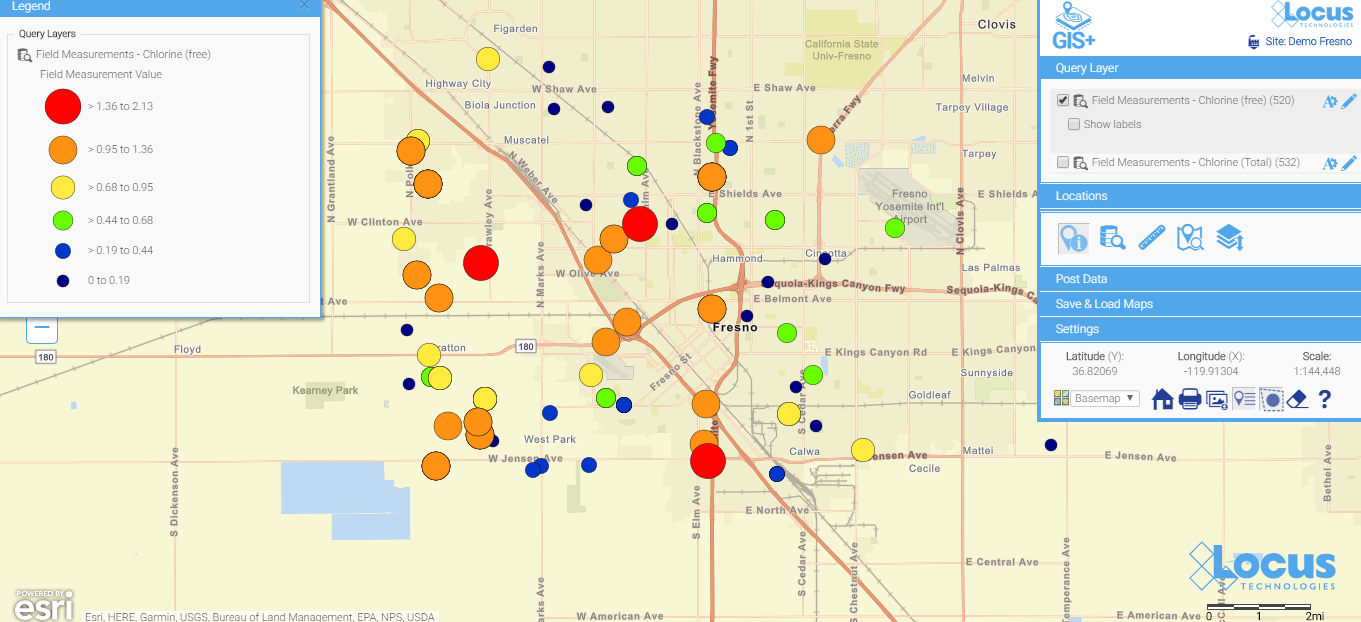
Good integration means mapping is as easy as clicking a “show on map” button. In Locus EIM, you can run a data query and click “Show results on map” icon, change the default settings if desired, and instantly launch a detailed map with a range of query layers to review all chemicals at the locations of interest.
All the query results are presented as query layers, so you can review the results in detail. This map was created with the easy “show results on map” functionality, which anyone can use with no training.
2) Check for formatting customization options
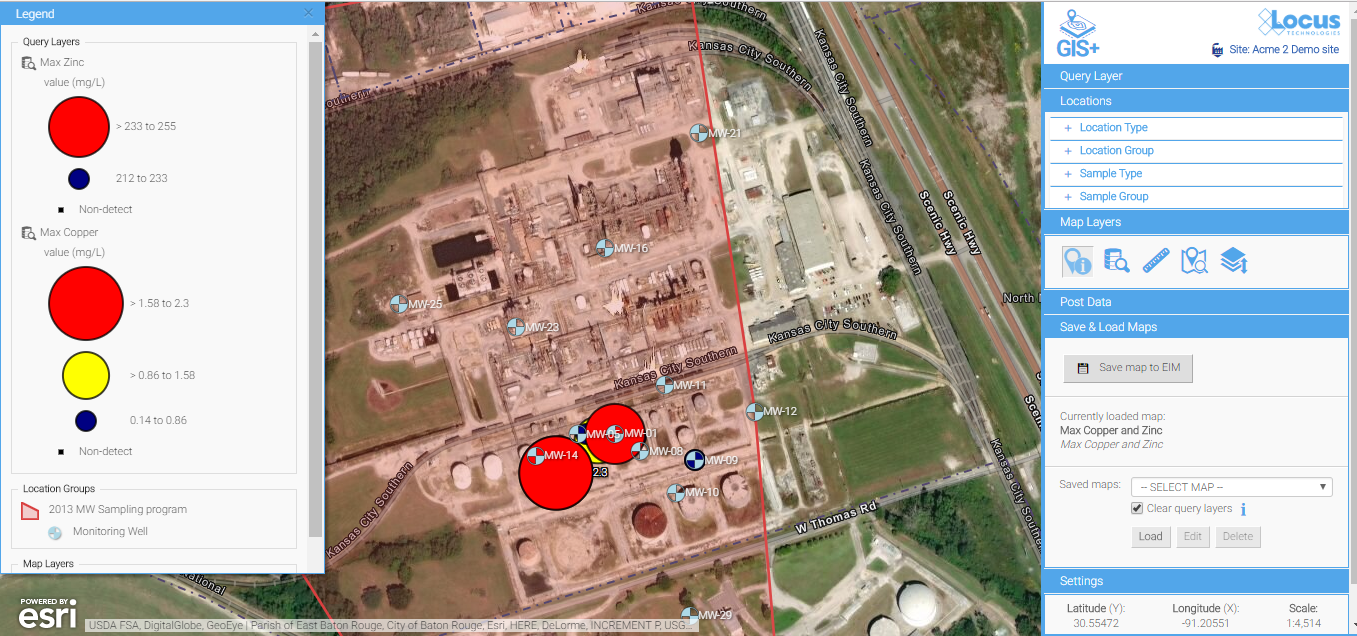
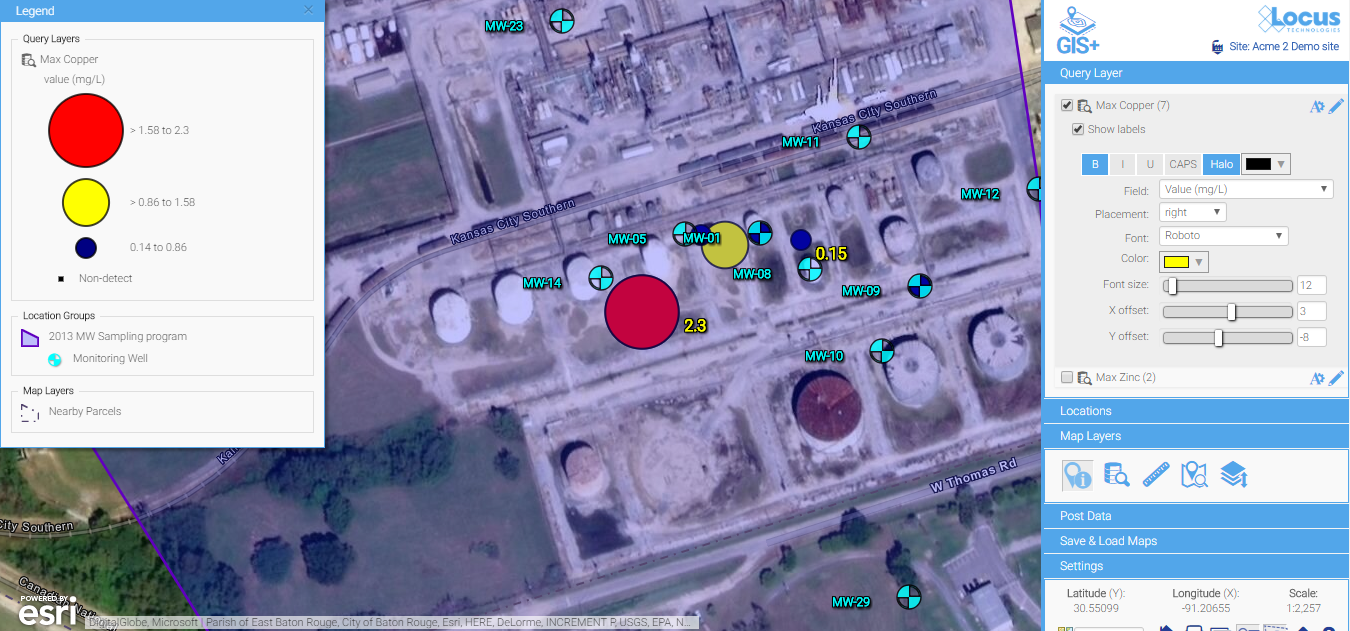
Look for easy editing tools to change the label colors, sizes, fonts, positioning, and symbols. Some map backgrounds make the default label styles hard to read and diminish the utility of the map, or if you’re displaying a large quantity of data, you’ll almost certainly need to tweak some display options to make these labels more readable.
Default label styles are legible on this background, but they are a bit hard to read.
A few simple updates to the font color, font sizes, label offset, and background color make for much easier reading. Changes are made via easy-to-use menus and are instantly updated on the map, so you have total control to make a perfectly labeled map.
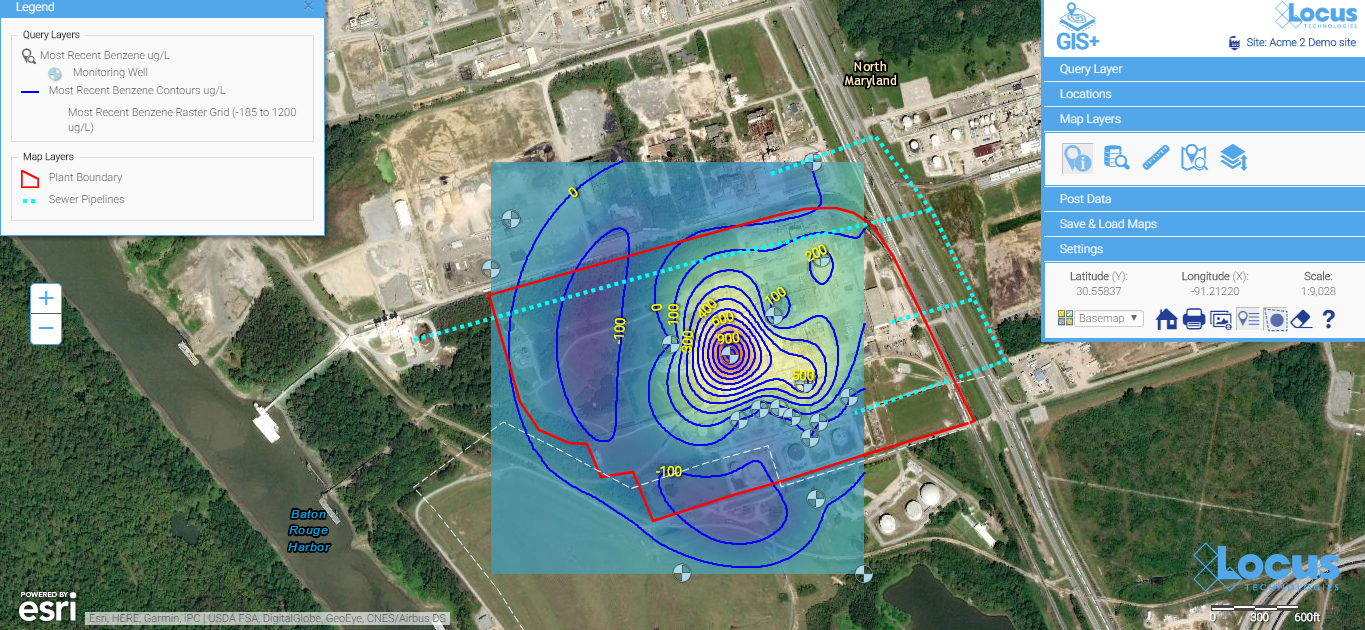
3) Look for built-in contouring for quick assessment of the extent of the spatial impact
Contours can be a great way to visually interpret the movement of contaminants in groundwater and is a powerful visualization tool. In the example below, you can clearly see the direction the plume is heading and the source of the problem. An integrated GIS with a contouring engine lets you go straight from a data query to a contour map—without export to external contouring or mapping packages. This is great for quick assessments for your project team.
Contour maps make it easy to visualize the source and extent of the plumes. They can be easily created with environmental database management systems that include basic contouring functionality.
4) Look for something easy to use that doesn’t require staff with specialized mapping knowledge
Many companies use sophisticated and expensive mapping software for their needs. But the people running those systems are highly trained and often don’t have easy access to your environmental data. For routine data review and analysis, simple is better. Save the expensive, stand-alone GIS for wall-sized maps and complex regulatory reports.
Here is a simple map (which is saved, so anyone can run it) showing today’s chlorine data in a water distribution system. You don’t have to wait for the GIS department to create a map when you use a GIS that’s integrated with your environmental database system. When data are updated daily from field readings, these maps can be incredibly helpful for operational personnel.
See your data in new ways with Locus GIS for environmental management.
Locus offers integrated GIS/environmental data management solutions for organizations in many industries. Find out more >
Taking the next steps
After viewing some of the many visualization possibilities in this blog, the next step is make some maps happen!
Make sure your environmental data system has integrated mapping options.
Make sure your sampling/evaluation/monitoring locations have a consistent set of coordinates. If you have a mixed bag of coordinate systems, you will need to standardize. Otherwise, your maps will not be meaningful. Here are some options to try, as well as some good resource sites:
https://www.locustec.com/wp-content/uploads/2016/08/gis_plus_stack-4.png9601000Locus Product Teamhttps://www.locustec.com/wp-content/uploads/2023/12/locus_logo_2x.pngLocus Product Team2018-08-01 13:06:552025-03-17 12:39:11Tips for choosing a GIS application for your environmental database
The city cut daily water use limits first to 87 liters and then 50 in a bid to avert shutting off supplies.
The city had set a 50-liter daily limit and had told citizens “Day Zero” was approaching when people would have to queue at standpipes.
But water-saving efforts in the South African city have seen the day pushed back from April to 27 August. Seasonal rains should mean that date is now averted, the city said. The shortages follow three years of low rainfall. The city had resorted to increasingly drastic measures to clamp down on water usage, including “naming and shaming” the 100 addresses using the most water and fining residents who failed to comply with the 50 liters (13 gallons) limit per person.
By comparison, the average California consumer uses some 322 liters (85 gallons) of water per day. Water use in California was highest in the summer months of June through September, where it averaged 412 liters per person per day. By comparison, during the cooler and wetter months of January through March of 2016, average per capita water use was only 242 liters per person per day.
Although the risk that piped water supplies will be shut off this year has receded, politicians and environmentalists warn that the water crisis is there to stay in Cape Town, as year-on-year rainfall levels dwindle.
https://www.locustec.com/wp-content/uploads/2018/04/Cape-Town-Locus-Technologies-Water-Crisis.jpg6401280Neno Duplanhttps://www.locustec.com/wp-content/uploads/2023/12/locus_logo_2x.pngNeno Duplan2018-04-02 17:37:092025-03-17 12:39:13Shape of Water: Cape Town running out of drinking water


 All your required field sample information is already in EIM for your sampling event.
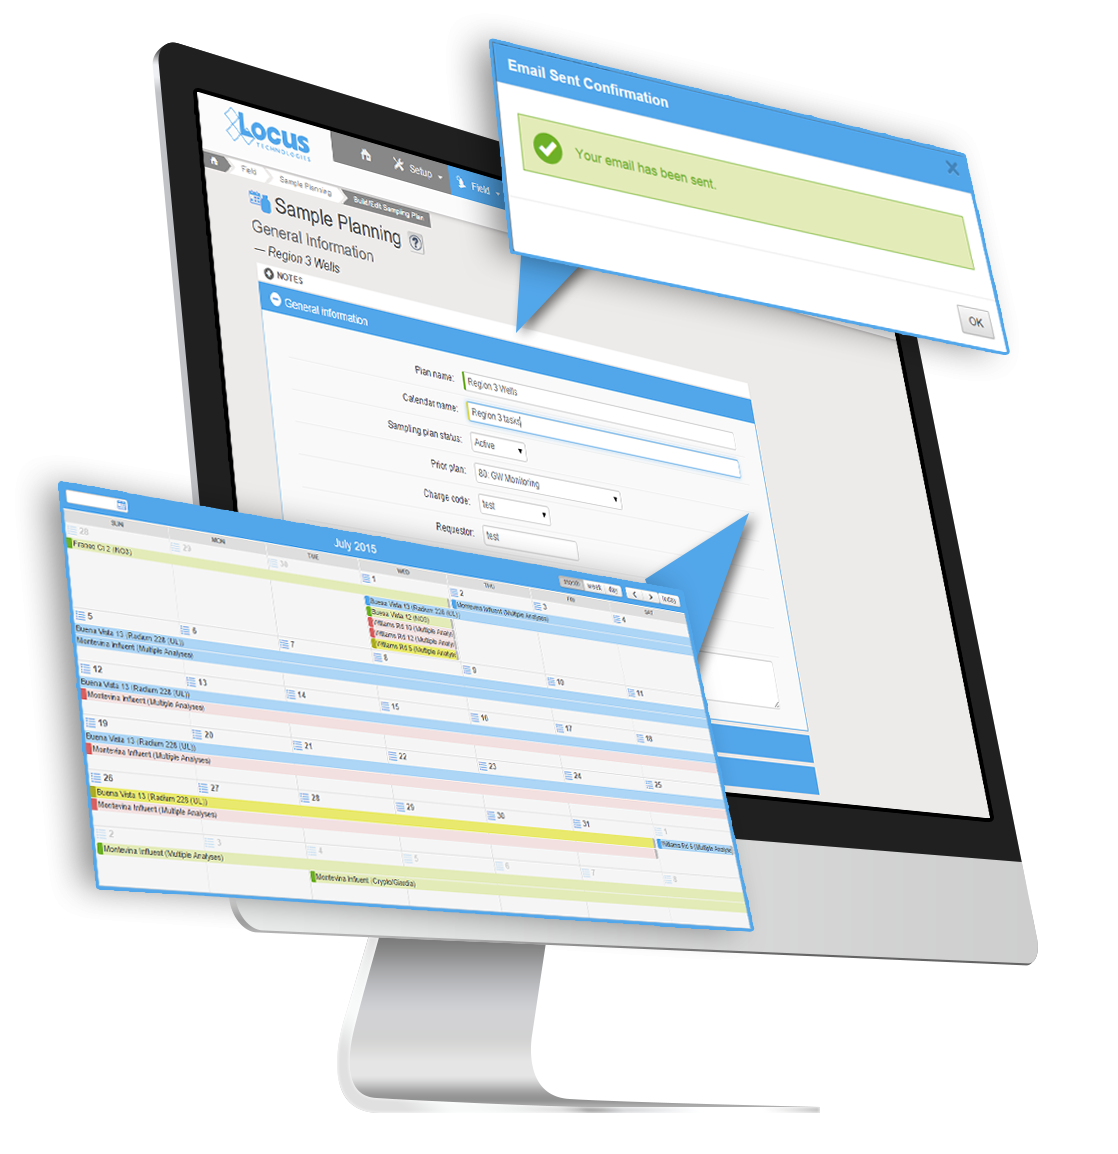
 Gain ability to track receipt of laboratory results with fine precision
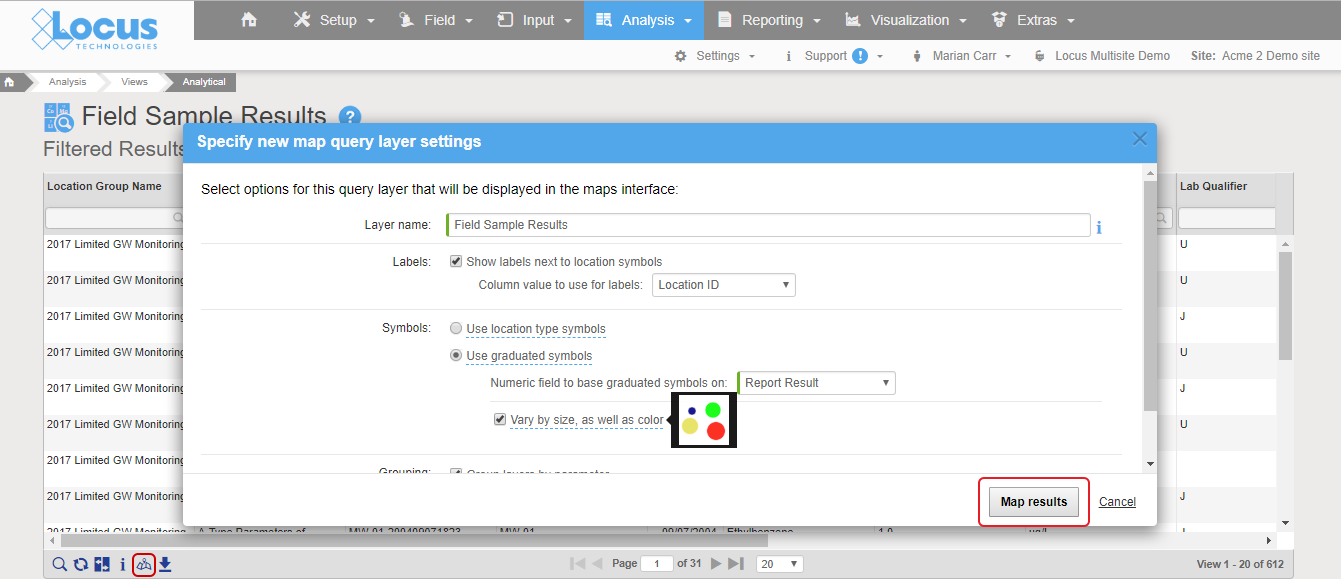
 See your data in new ways with Locus GIS for environmental management.