Compliance Minute – Waste Profiles
When looking for a GHG reporting program, there is one element that is typically overlooked. This short video gives us more insight.
When looking for a GHG reporting program, there is one element that is typically overlooked. This short video gives us more insight.
MOUNTAIN VIEW, Calif., May 2, 2023 — Locus Technologies, the leading EHS Compliance and ESG software provider, today announced that Foster Farms, a top US provider of fresh, frozen, and prepared poultry products and the leading brand of fresh chicken in the Western U.S., selected Locus’s award-winning enterprise Software as a Service (SaaS) to organize and manage their EHS compliance and ESG reporting.
Foster Farm subscribed to an integrated set of apps offered in the Locus Cloud Platform. Some apps include EHS Compliance Management, ESG and Sustainability, GHG Emission Factor and Calculation Management, Inspections, Configuration Workbench, Air Emissions Management, Storm Water, Wastewater, and well data management and reporting.
Locus Cloud is the first fully integrated multitenant platform created from the ground up to allow organizations to manage their environmental, energy, water, waste, carbon, air, health and safety, remediation, water quality, and compliance information in one place. The Locus Platform allows companies to configure their own management, tracking, visualization, and reporting through a graphically driven user interface. This feature enables organizations to configure the software to their needs without worrying about the expensive programming outlays usually associated with customization and single-tenant deployments.
When designing integrated EHS/ESG SaaS, Locus sought to make the complicated workflow and management of environmental data as simple as possible and to make it manageable from a single platform with shared components. The resulting platform offers immense flexibility and endless capabilities with minimal training thanks to the new, intuitive, user-friendly interface design.
“The accurate tracking and reporting of critical environmental resource usage is a necessary part of our compliance responsibilities, and a major component of our efforts to ensure that we are a sustainable producer. The Locus application software will make a significant contribution to our resource management capabilities,” said Don Hill, Foster Farms Director of Environmental Affairs.
“We are delighted that Foster Farms recognized the power of the Locus Cloud platform. Businesses do not want to shop for point solutions from different vendors only to be left with the nightmare of integration, security, synchronization, and vendor management. They want one-stop shops and to avoid having to deal with vendors that don’t integrate well with one another or have spotty service and limited support. Locus will provide Foster Farms single platform through which they can accomplish all their environmental and compliance management needs on a single, fully customer-configurable platform,” said Neno Duplan, President, and CEO of Locus. “Keeping the end user’s perspective in mind, we’ve packed the same 26-plus years of domain expertise that Locus has been offering all along into a highly configurable and scalable software platform built from the ground up on the latest web technologies,” remarked Duplan.
ABOUT FOSTER FARMS
Foster Farms is dedicated to providing families across America with great food. From ready to cook chicken and turkey, to chicken nuggets and corndogs, Foster Farms portfolio of fresh, frozen, and prepared foods, are always welcome whether it’s dinner time or snack time. Since its founding in 1939 Foster Farms has gone on to become one of the largest quality poultry producers in the United States. Headquartered in Livingston, Ca with facilities in California, Oregon, Washington, Colorado, Arkansas, Alabama and Louisiana, the company has nearly 12,000 Team Members, and is committed to building a “culture that nobody wants to walk aways from.”
Chris De Cree, an EHS Implementation Manager from Locus Technologies walks us through our container tracking tool.
Ready to use GIS software? Jump to the Locus GIS product page>
Today is GIS Day, a day started in 1999 to showcase the many uses of geographical information systems (GIS). Earlier Locus blog posts have explained how GIS and maps support visualization of objects in space and over time. This post covers a specific visualization method called data dashboards.
A data dashboard is a combination of charts, maps, text, and images that enables analysis of data and thereby promotes discovery of previously unknown relationships in the data. Companies and organizations use dashboards to develop insight into the overall status of a company or of a company division, process, or product line. Dashboards are also a common function in ‘business intelligence’ applications such as Microsoft Power BI and Tableau. A printed dashboard is static, but an online dashboard can be dynamic; in a dynamic dashboard, interacting with one item on the dashboard causes the other items to update. Taken together, the visualizations on a dynamic dashboard can help you find the story in your data.
One reason dashboards are so helpful is that they allow humans to partially ‘offload’ their thinking. Cognitive research has shown that human ‘working memory’ handles at most four items at a time. A good visualization, however, reduces the number of items to process in memory.
Consider a large table of carbon dioxide emissions by country for multiple years; it can be difficult to keep all the numbers in mind if you are trying to find trends.
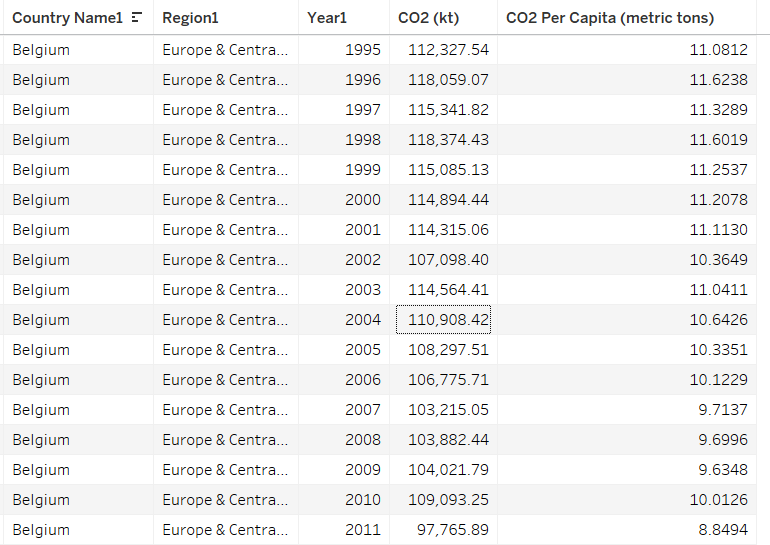
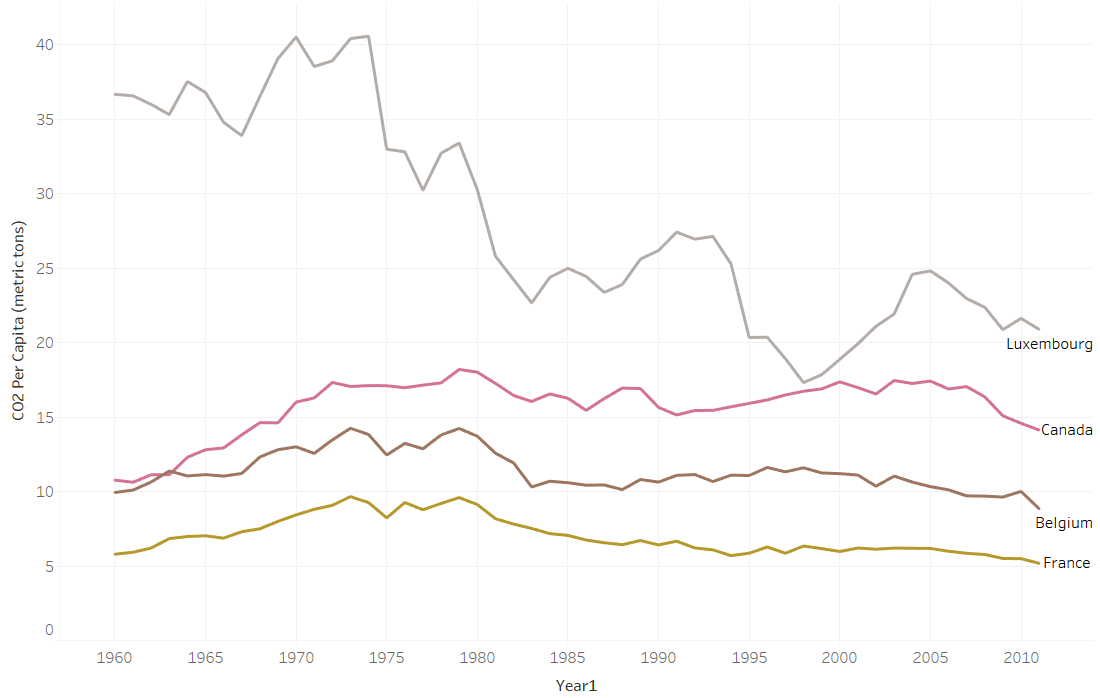
If you plot the data in a graph, however, each series of data in the chart becomes just one line on the graph. It is much easier to compare lines on the chart than to compare columns of numbers.
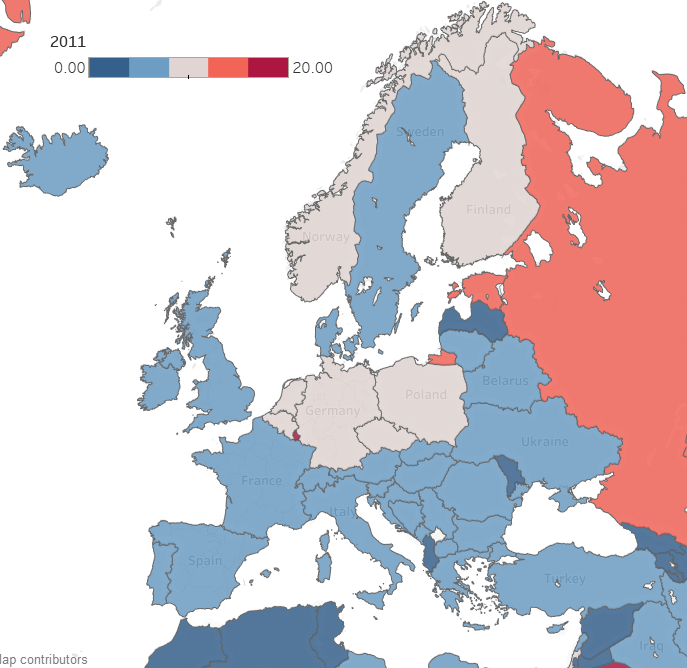
Now consider making a map with countries color coded by emissions. Again, for each country, the map reduces multiple numbers to a single color for that country on the map. You can compare country colors more easily than columns of numbers.
A dashboard that combines multiple visualizations further enhances data analysis. Imagine a dynamic dashboard showing you both the emissions chart and map described above. If you select a country on the map, the chart can highlight the line for that country, so you compare its emissions to other countries over time. Similarly, if you select a line on the chart for a specific country, the map can highlight the selected country to show how its emissions compare to nearby countries. This interactivity lets you drill into your data more effectively than using either the chart or the map by itself.
Here are three examples of effective dashboards that are available online:
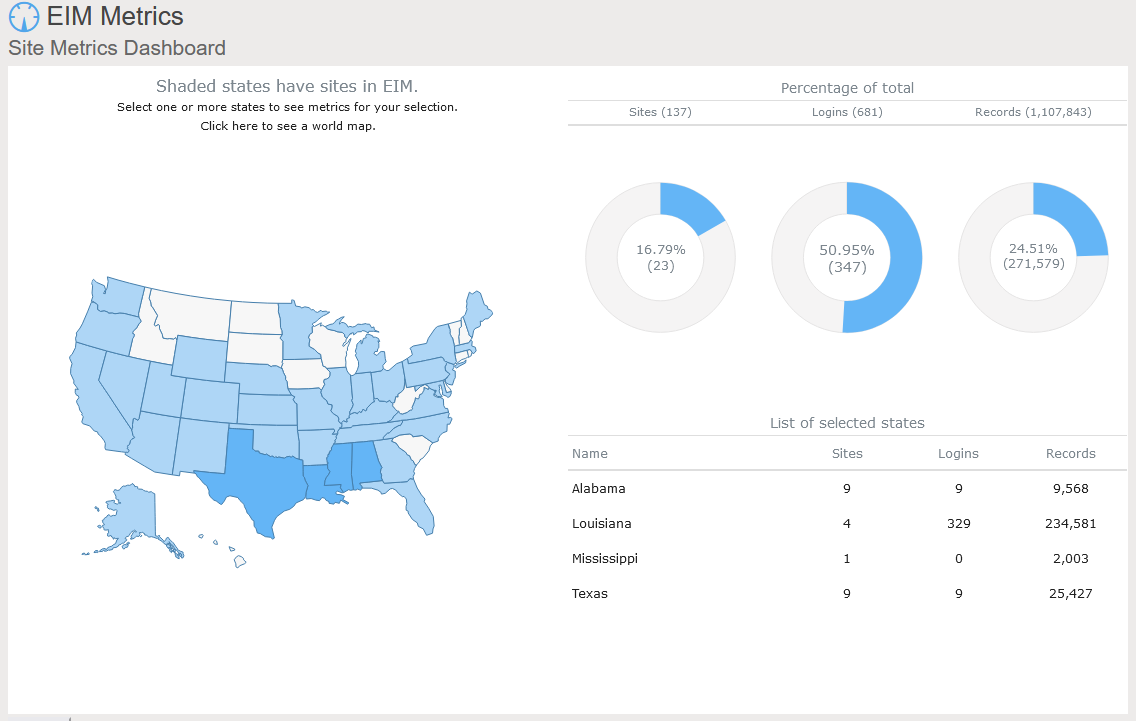
Locus includes data dashboards in our applications. One example is the Site Metrics dashboard in EIM, Locus’s cloud-based, software-as-a-service application for environmental data management. The Site Metrics dashboard lets you perform roll-up queries across your portfolio of sites. A map on the dashboard shows all states with active sites. If you select one or more states, the dashboard updates the charts and tables on the right to show total sites, user logins, and record counts. Other dashboards can support showing sample locations of certain chemicals or counts of regulatory limit exceedances.
A further example comes from the Locus Environmental Social and Governance (ESG) application. ESG metrics are becoming increasingly important measures for an organization’s performance. Data dashboards can help companies quickly visualize trends in their ESG metrics using intuitive mapping tools.
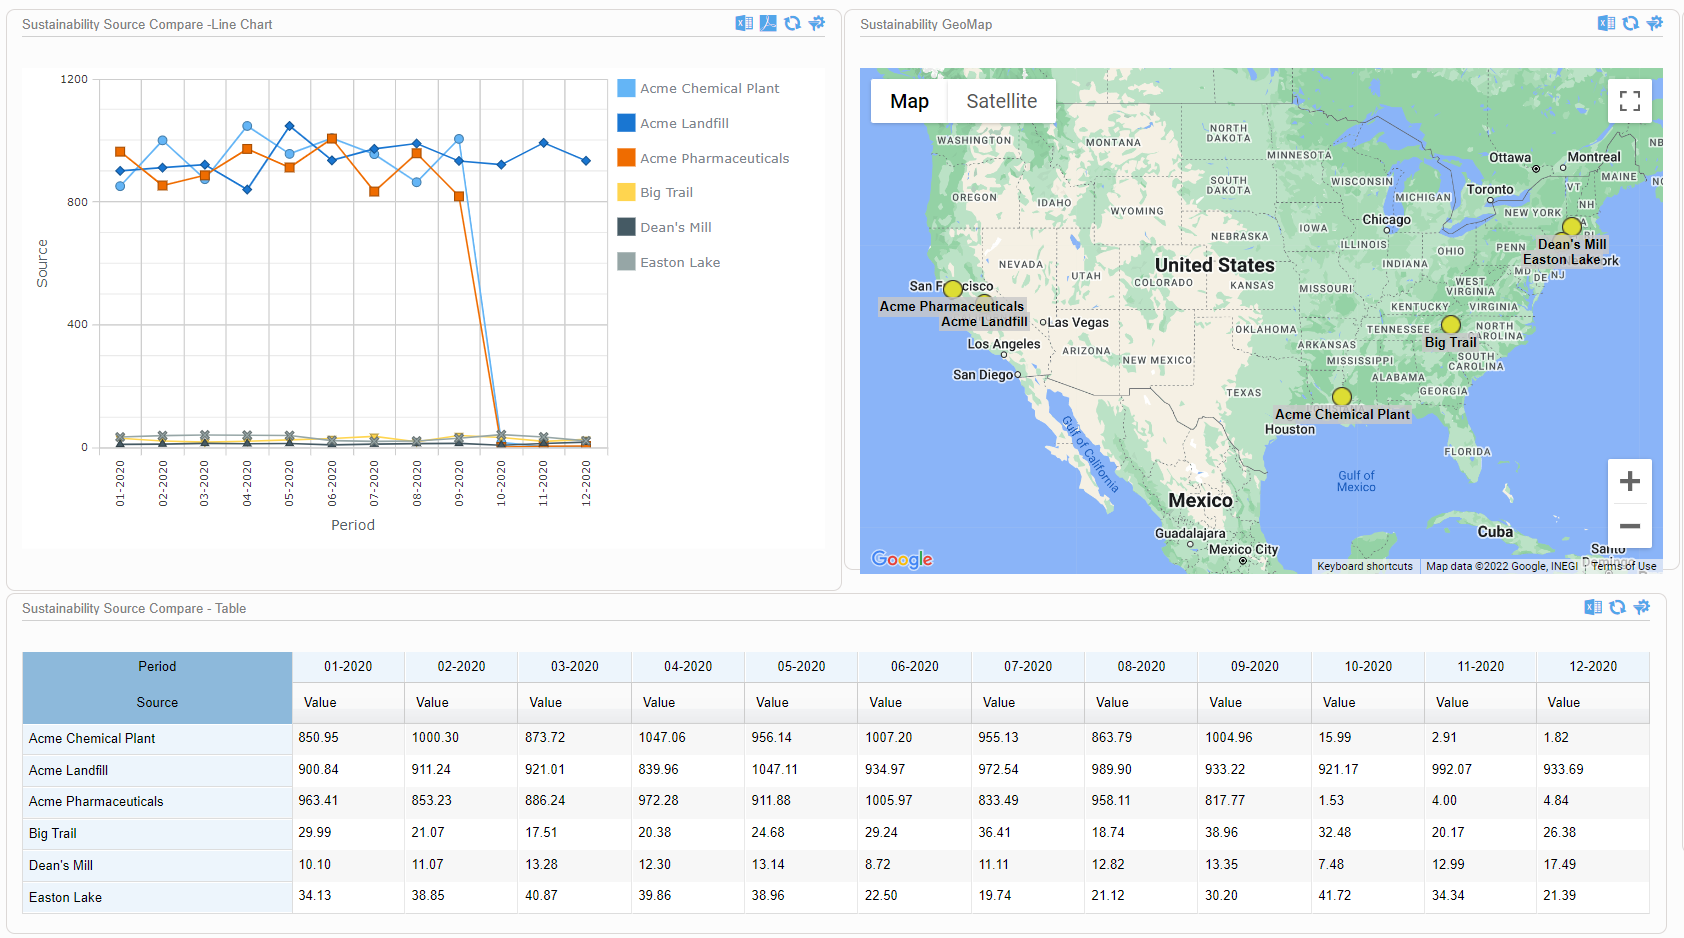
This dashboard illustrates both spatial and time trends and provides the raw data necessary for auditability and transparent decision making. Having these features on a single combined view provides users with instant access to the key inputs for ESG prioritization, planning, and project implementation.
As these examples from Locus show, data dashboards with integrated mapping are important tools for maximizing the value of your collected environmental and ESG data. For any dataset with a geographic component, it’s important to incorporate mapping elements in the outputs, to highlight trends and patterns that may not otherwise be visible in a chart or table. Modern software can combine these output formats in a way that tells the story shown by your data.
Locus GIS+ features all of the functionality you love in EIM’s classic Google Maps GIS for environmental management—integrated with the powerful cartography, interoperability, & smart-mapping features of Esri’s ArcGIS platform!
Learn more about Locus’ GIS solutions.
About the Author—Dr. Todd Pierce, Locus Technologies
Dr. Pierce manages a team of programmers tasked with development and implementation of Locus’ EIM application, which lets users manage their environmental data in the cloud using Software-as-a-Service technology. Dr. Pierce is also directly responsible for research and development of Locus’ GIS (geographic information systems) and visualization tools for mapping analytical and subsurface data. Dr. Pierce earned his GIS Professional (GISP) certification in 2010.
To celebrate a milestone 25 years of success in EHS and ESG software development, we sat down with Locus President, Wes Hawthorne for a brief discussion. In this post, we ask him a series of questions highlighting the past, present and future of EHS and ESG.
One of the persistent challenges we’ve seen for the past 25 years is that the responsibilities of environmental professionals are continually expanding. Previously, almost all environmental work was localized, with facility-level permits for air, water, waste, etc. That has expanded over the years to include new regulations and reporting requirements for sustainability, social metrics, and other new compliance areas, while the old facility-level programs still continue. This has led to more pressure on environmental managers to keep up with these programs, and increased reliance on tools to manage that information. That’s where Locus has always focused our effort, to make that ever-expanding workload more manageable with modern solutions.
The current flood of interest in ESG is certainly notable as far as bringing corporate attention to the environmental field, as well as having requirements originate from the SEC here in the US. We have become accustomed to managing oversight from multiple regulatory bodies at the local, state, and federal level, but SEC would be a newcomer in our line of work. Their involvement will be accompanied by a range of new requirements that are common for the financial world, but would be unfamiliar to environmental staff.
Across other EHS fields, we are seeing increased demand for transparency in EHS functions. Overall, this is a positive move, as it brings more attention to EHS issues and develops a better EHS culture within organizations. But this also drives the need for better tools to make EHS information readily available across all levels of the organization.
As far as technologies, the ones most likely to have significant impact in the environmental field are ones that don’t require a significant capital investment. Although there are definitely some practical advantages to installing smart monitoring devices and other new technologies, procuring the funding for those purchases is often difficult for environmental professionals. Fortunately, there are still many technologies that have already been implemented successfully in other fields, but only need to be adapted for environmental purposes. Even simple changes like using web-based software in place of spreadsheets can have a huge impact on efficiency. And we haven’t yet seen the full impact of the proliferation of mobile devices on EHS functions. We are still working on new ways to take advantage of mobile devices for data collection, analysis, and communication purposes.
We’ve seen a number of innovation milestones in the past 25 years, and while we didn’t invent SaaS, we’ve been largely responsible for adapting it and perfecting it for environmental purposes. One of the major innovations we’ve integrated into our products include online GIS tools where users can easily visualize their environmental data on maps without expensive desktop software. Another one was our fully configurable software platform with built-in form, workflow, and report builders tailored for environmental purposes, which allows anyone to build and deploy environmental software applications that exactly match their needs. There have been many other innovations we’ve incorporated into our software, but these two stand out as the most impactful.
More and more, we are seeing all types of reporting being converted into pure data exchanges. Reports that used to include regulatory forms and text interpretations are being replaced with text or XML file submittals. This transition is being driven largely by availability of technology for EHS professionals to generate and read these files, but it is also promoted by regulatory agencies and other stakeholders receiving these reports. Stakeholders have less time to read volumes of interpretive text, and are becoming more skeptical of potential bias in how facts are presented in text. These are driving the need for more pure data exchanges, with increasing emphasis on quantifiable metrics. These types of reports are also more readily compared against regulatory or industry standards. For reporters, lengthy corporate reports with volumes of text and graphics are becoming less common, and the success of an organization’s programs will be increasingly reliant on robust data sets, since ultimately only the data will be reported.
There are actually a few that immediately come to mind. One reason is the nature of our continually evolving products. By providing our solutions as SaaS, our software adapts with new environmental requirements, and with new technologies. If our software was still the same as it was 25 years ago, it simply wouldn’t be sufficient for today’s requirements. Since our software is updated multiple times each year, it is difficult to notice the incremental changes, but they can be readily seen if you compare today’s software with the original in 1997. And we’re committed to continuing the development of our products as environmental needs change.
The other primary reason for our success is our excellent staff and the environmental expertise we bring to our customers. We simply could not provide the same level of support without our team of environmental engineers, scientists, geologists, chemists, and an array of others. Having that real-world understanding of environmental topics is how we’ve maintained customer relationships for multiple decades. And our software only has value because it is maintained and operated by staff who appreciate the complexity and importance of environmental work.
 Mr. Hawthorne has been with Locus since 1999, working on development and implementation of services and solutions in the areas of environmental compliance, remediation, and sustainability. As President, he currently leads the overall product development and operations of the company. As a seasoned environmental and engineering executive, Hawthorne incorporates innovative analytical tools and methods to develop strategies for customers for portfolio analysis, project implementation, and management. His comprehensive knowledge of technical and environmental compliance best practices and laws enable him to create customized, cost-effective and customer-focused solutions for the specialized needs of each customer.
Mr. Hawthorne holds an M.S. in Environmental Engineering from Stanford University and B.S. degrees in Geology and Geological Engineering from Purdue University. He is registered both as a Professional Engineer and Professional Geologist, and is also accredited as Lead Verifier for the Greenhouse Gas Emissions and Low Carbon Fuel Standard programs by the California Air Resources Board.
Today is GIS Day, a day started in 1999 to showcase the many uses of geographical information systems (GIS). Earlier blog posts by Locus Technologies for GIS day have shown how GIS supports cutting-edge visualization of objects in space and over time. This year’s post explains how GIS supports augmented reality.
Augmented reality (AR) is a technology that enhances how we experience the real world by overlaying your surroundings with computer-generated objects. It differs from virtual reality (VR) because in VR, everything you see is computer generated, but in AR, the majority of what you see is real – your experience of reality is enhanced (augmented) but not totally replaced.
You are probably familiar with one AR application already if you watch American football. The ‘virtual’ first down line that appears on field before each play is projected there by computer and is not really painted on the field. If you follow soccer (or football to the rest of the world), AR is used by a Video Assistant Referee (VAR) to objectively determine tight offsides decisions. Digital lines are drawn across the field to show whether or not attackers are illegally past the last defender or not. Another AR example is the popular game Pokémon Go that shows cute virtual creatures in your living room or your front yard.
To experience AR, you need something to project the non-real objects onto your view of the world. Many AR applications use mobile phones or other devices. An AR application uses the camera view to show you the world around you and then overlays virtual objects onto the view. Other devices such as head mounted displays, ‘smart glasses’, or even ‘bionic contact lenses’ can use AR, but have not been as popular as phones or other mobile devices. In contrast to AR, VR cannot be fully supported with just a mobile device and usually requires headsets to immerse you in a virtual world. Because of this need, AR is much less intrusive than VR is.
Locus has been exploring environmental uses of AR and GIS by adding AR to Locus Mobile, which is the Locus app for collecting field data, completing EHS audits, tracking waste containers, and completing other tasks requiring users to gather data out of the office. Locus Mobile now features an AR mode to assist users when taking field samples. When the user activates AR mode, the app uses the camera to show the user’s immediate area. The app then puts multiple virtual markers on the display corresponding to sampling points located in that direction. As the user moves or rotates the phone to change the viewing area, the markers change to reflect the locations in the user’s line of sight. Clicking a marker provides more information including the location name and the distance from the user.
Here is a sample image from Locus Mobile showing three nearby sampling locations along with information about past events or measurements at the locations. The three blue banners are the augmented reality displayed on top of the view of the nearby surroundings.
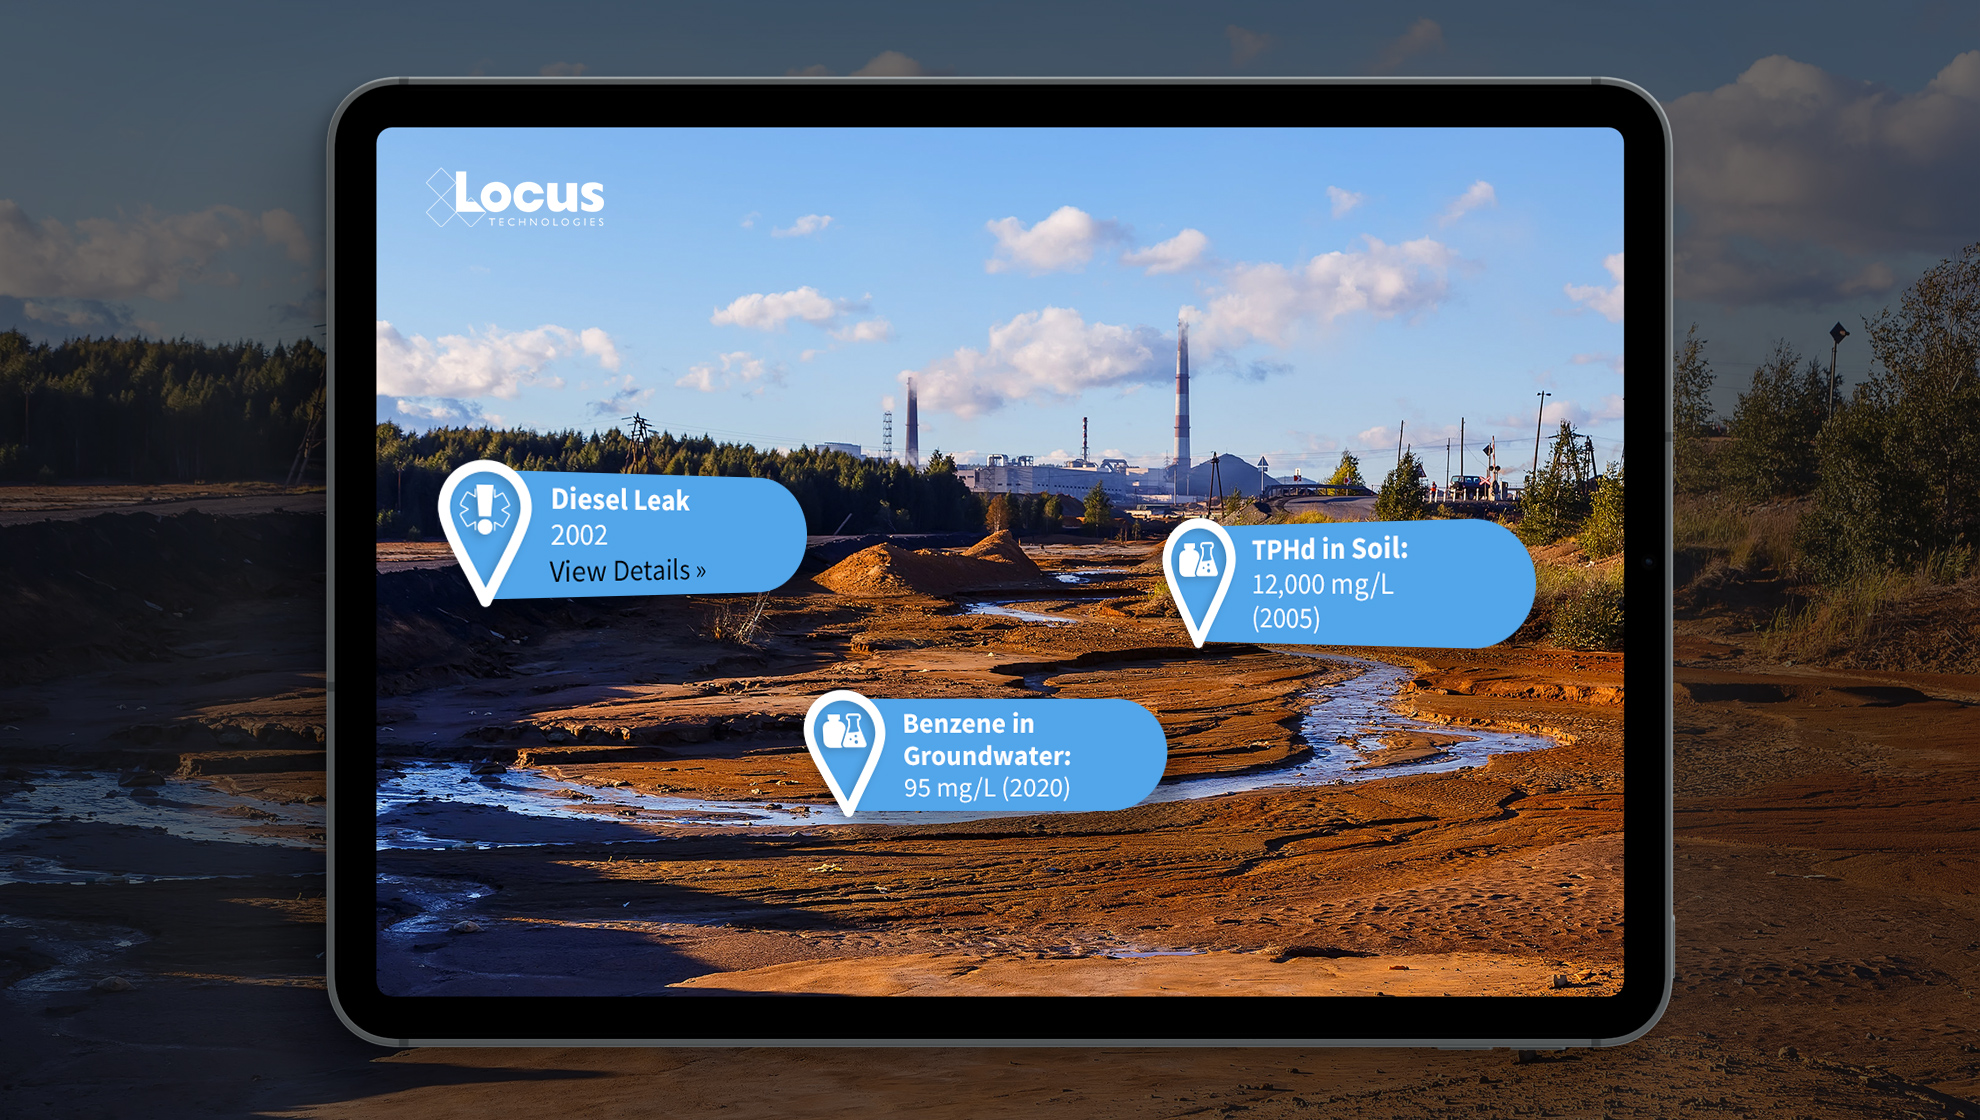
By using GIS and AR to assist users in finding sampling points, Locus Mobile makes field personnel more productive. Samplers can find field locations quickly and can easily pull up related information. Locus continues to explore using AR to expand the functionality of its environmental applications.
Locus GIS+ features all of the functionality you love in EIM’s classic Google Maps GIS for environmental management—integrated with the powerful cartography, interoperability, & smart-mapping features of Esri’s ArcGIS platform!
Learn more about Locus’ GIS solutions.
About the Author—Dr. Todd Pierce, Locus Technologies
Dr. Pierce manages a team of programmers tasked with development and implementation of Locus’ EIM application, which lets users manage their environmental data in the cloud using Software-as-a-Service technology. Dr. Pierce is also directly responsible for research and development of Locus’ GIS (geographic information systems) and visualization tools for mapping analytical and subsurface data. Dr. Pierce earned his GIS Professional (GISP) certification in 2010.
The Locus Waste Management application enables EHS professionals to manage wastes across their entire enterprise and prepare reports with just one click.
Let’s take a look back on the most exciting new features and changes made in Locus Platform during 2020!
Ahead of its time in 2002, Locus Platform (formerly ePortal) has seen a huge change over time from a simple portal at the beginning of the SaaS movement, to a fully configurable multi-tenant platform. Locus Platform (LP) houses any number of off-the-shelf and custom applications to meet EHS customer needs.
MOUNTAIN VIEW, Calif., 4 December 2018 — Locus Technologies, the leader in enterprise EHS compliance and sustainability software, today announced that Recology, an integrated resource recovery company headquartered in San Francisco, California had selected Locus Platform EHS software for its system of record for EHS compliance activities.
“With Locus’ out-of-the-box solution, we can configure the applications to align with our current workflow and tailor the functionality to our specific needs. The Locus Platform integration with the compliance content provider RegScan will help our Environmental Compliance team keep on top of all the regulations throughout California, Oregon, and Washington,” said Amy Dietz, Director of Environmental Compliance for Recology.
“By using Locus Platform Compliance application with integrated regulatory content services, Recology is combining the advantages of off-the-shelf software with Locus Platform’s powerful configuration tools. This means Recology will get exactly the software solution they need to fit their business processes in the shortest time,” said Wes Hawthorne, President of Locus.