Selecting ESG Software? Watch out for these 7 Red Flags

One of the biggest recent trends we have seen with novice ESG providers (both startups and major software providers new to the field) is a lack of substantial software tools presented. What is lacking is covered up by grandiose statements about the efficacy of their options. These statements are so vague that they could cover anything if you switched out references to ESG with any other nouns, since these providers don’t show their tools transparently.

Locus Technologies ESG Reporting

Here are seven red flags to be aware of when selecting ESG software:

  • These providers prominently share statements and statistics about the current ESG climate, without any offering of how their software fits into the picture. This is a major ‘tell’ that someone is jumping on the ESG bandwagon without adequate expertise or software tools.
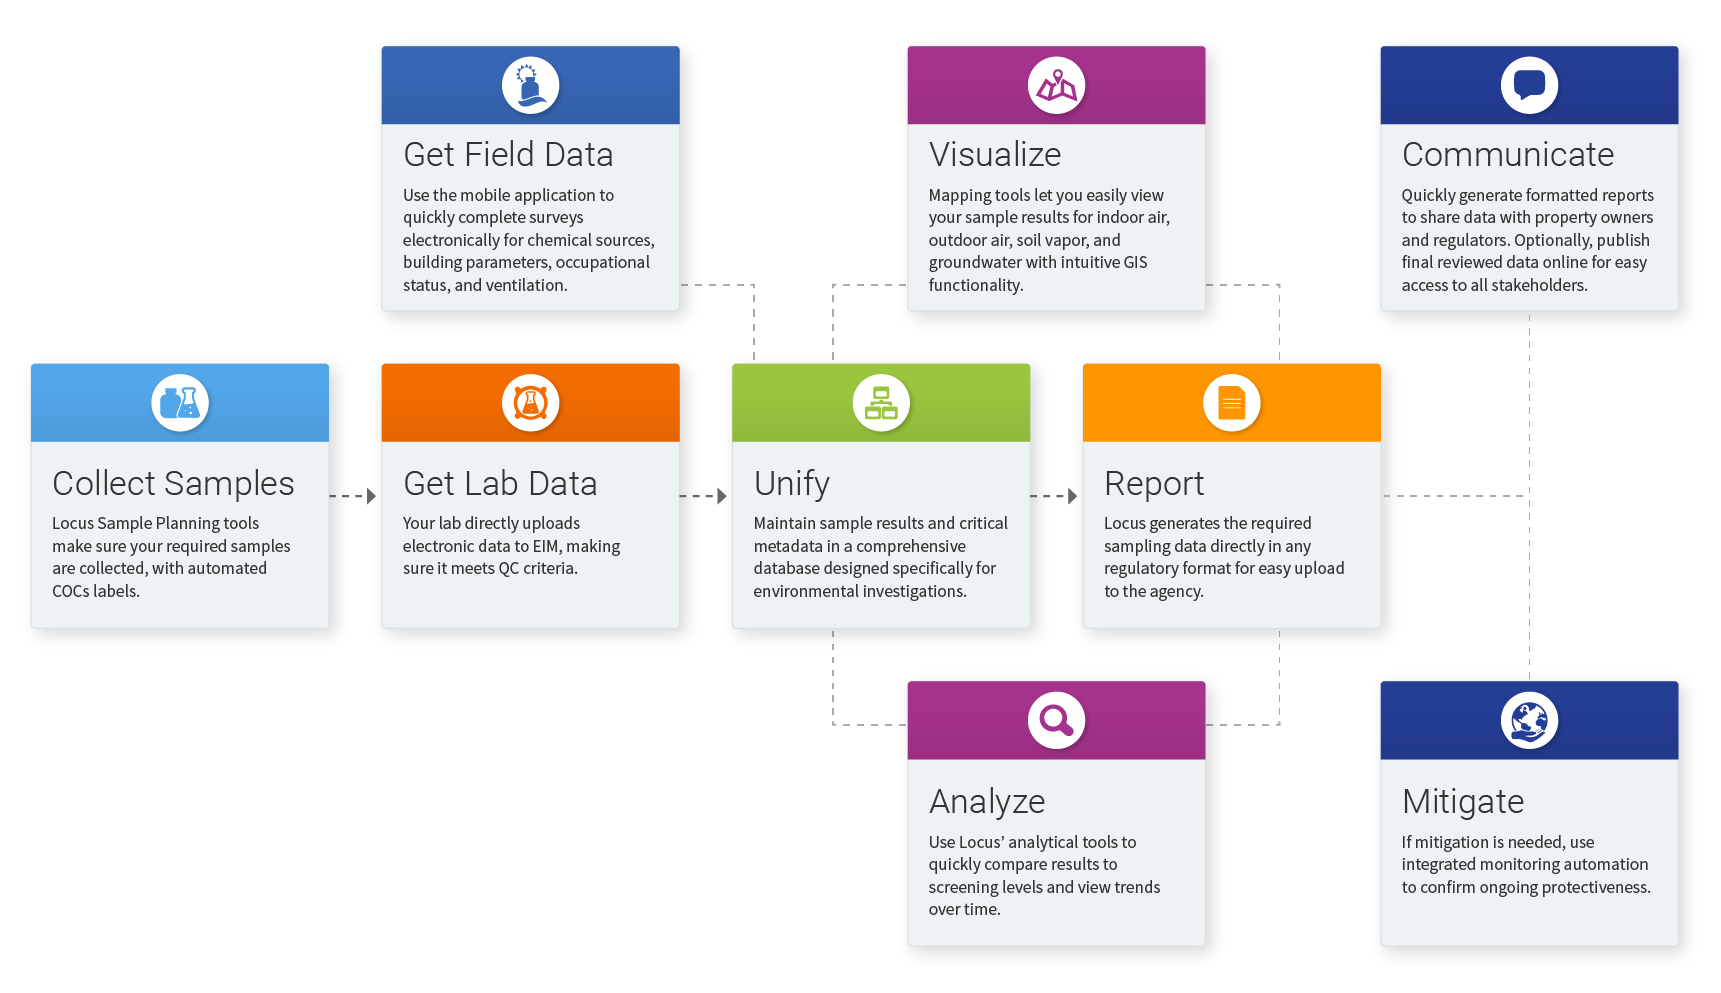
  • There is a lack of explanation about how their tools directly improve your ESG program. There is no mention of their dashboards or reporting options or other integrated tools. A seasoned software provider will happily share the specifics of what they offer.
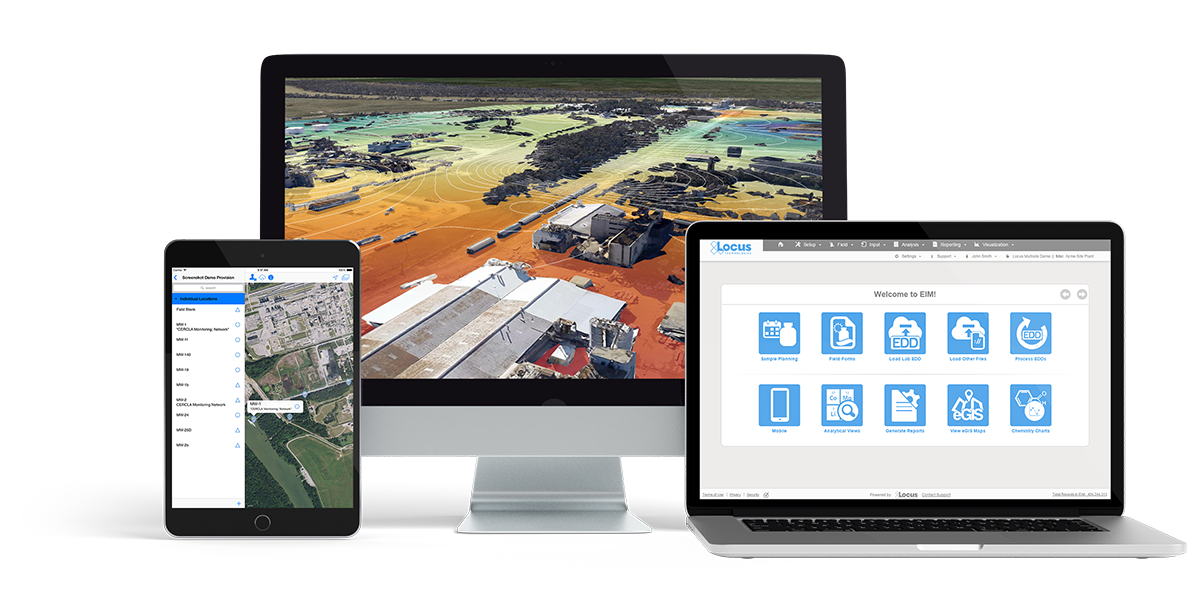
  • You’ll find over-the-top flashiness on their website, but there are no software previews to be found. If they’re not showing an example of their software, it may be because it lacks functionality, or is theoretical.
  • Their site is filled with buzzwords. They will talk about reaching net-zero, about how their software is expert-led and data-driven. They will offer no insight as to how they meet these goals.
  • They will shy away from offering demonstrations. Instead, they will seek to have conversations where they make lavish promises about what their software will be able to do in the future. They may be quick to offer a PowerPoint presentation, but you’ll find that many organizations are reluctant to show their software in action. You deserve to see the software you intend to purchase.
  • No case studies or current customers can be found. If there’s not an example of their software in use, then it may not be worth exploring, or it may not exist.
  • If an ESG software provider has grown by acquisition, there are likely issues with software integration and staffing knowledge/support for the product. And if they’re owned by investors, it’s inevitable that they’re being packaged to sell, and they’ve raised prices to meet the needs of the investor.

So, what should you look for in an ESG Software Solution instead?

When selecting an ESG software solution, don’t waste your time with something that either isn’t functional or doesn’t exist. More importantly, your software should have a long track record of usability and be backed by years of expertise. Locus ESG software is proven and is a vital part of the Port Authority of New York and New Jersey’s Clean Construction Program. It also helps Del Monte Foods meet their sustainability goals by improving analyzation and forecasting.


Embodied Carbon in the Construction and Building Operations Industry

When we look at all the new construction in the next 20 years, we see the critical role embodied carbon plays. The world urgently needs to address carbon emissions from buildings and construction, constituting almost 40% of global carbon emissions. Of those total emissions, building operations are responsible for 28% annually, while building materials and construction (typically referred to as embodied carbon) are responsible for an additional 12% annually.

The construction industry is the world’s largest single industry. Oxford Economics estimates the global construction market at $10.7 trillion in 2020. The market is expected to grow by $4.5 trillion between 2020 and 2030 to reach $15.2 trillion.

Embodied Carbon Software

Unlike operational carbon emissions, which can be reduced over time with building energy upgrades and the use of renewable and nuclear energy, embodied carbon emissions are locked in place upon completion of construction. The owners and construction industry must handle embodied carbon now if we hope to achieve climate change goals by target dates. Embodied carbon typically precedes Scope 1, 2, and 3 emissions and should be added to those for any new construction.

Achieving zero embodied emissions will require adopting the principles of reusing, reducing, and sequestering, including retrofitting existing buildings, using recycled materials, and designing for deconstruction. Reducing means material optimization and the specification of low to zero carbon materials. Sequester means including the design of carbon sequestering sites and the use of carbon sequestering materials.

Just three materials – concrete, steel, and aluminum – are responsible for 23% of total global emissions (most of the materials used in the built environment). Concrete is the second most-consumed substance on Earth after water. Overall, humanity produces more than 10 billion tons, about 4 billion cubic meters of concrete and cement per year, or about 1.3 tons for every person on the planet, more than any other material, including oil and coal. The consumption of concrete exceeds that of all other construction materials combined. Making modern cement and concrete has a heavy environmental penalty, being responsible for 5% or so of global carbon emissions. And yet, most of those emissions are not accounted for during regular carbon reporting protocols. Steel and aluminum are not much different.

All companies that want to be credible with their carbon reporting need software tools for embodied carbon tracking and management. For this reason, Locus has developed a SaaS application to manage and report embodied carbon data in real-time during construction projects. The Locus Embodied Carbon app, part of the ESG toolset, advances environmentally friendly infrastructure design and increases the ability to track and reduce emissions before being built in the new structure forever.

Locus’s Embodied Carbon management software automates carbon emissions management throughout the design and construction processes. It is one of the most ambitious real-time carbon management software programs in the US. Locus Embodied Carbon app helps site owners, construction companies, and the supply chain reduce embodied carbon from on-site construction activities and reduce air pollution from construction activities.

Embodied Carbon Software

Locus Embodied Carbon application combines the advantages of Locus Platform’s multitenant SaaS with its powerful configuration tools and APIs that, for example, stream carbon data from construction equipment to online software. The construction industry now has precisely the ESG software solution they need to fit their business processes for the low carbon construction program management to incorporate other EHS compliance and Sustainability data on the same unified platform in the future.

Locus to Provide GHG Verification Services in Oregon

Locus Technologies has received accreditation by Oregon DEQ for GHG and CFP verification services.

MOUNTAIN VIEW, Calif., 21 December 2021 — Locus Technologies (Locus), industry leader in environmental compliance and ESG software, has been accredited by the Oregon Department of Environmental Quality (DEQ) to provide verification services for mandatory greenhouse gas (GHG) reporting and the Clean Fuels Program (CFP). Locus is the first of a select few to receive approval for verification services. 

The accreditation allows Locus to provide verification services for GHG emissions reports, which are now mandatory for facilities in the State of Oregon. The verification team at Locus consists of experts in all reporting requirements. Locus’ in-house Lead Verifiers are certified in all reporting types, including air contamination stationary sources, electricity suppliers, fuel suppliers, natural gas suppliers, natural gas systems, and process emissions. Locus verifiers are also certified for all report types under the Oregon CFP. 

The Oregon Environmental Quality Commission (EQC) updated their rules in May 2020 to enhance the data collection of Oregon’s greenhouse gas emissions. The adopted rules incorporate existing reporting and emissions accounting protocols into rule and improve the specificity of how emissions data are calculated, reported, and verified. The regulation requires mandatory reporting and verification of greenhouse gas (GHG) emissions by third-party verifiers like Locus, starting in 2022. 

“Locus is proud to become an accredited GHG and CFP verification body for the state of Oregon, as we have been in California since the inception of that program. We are continually committed to staying informed on new and updated ESG reporting frameworks, which we accomplish first and foremost through domain expertise. Our field expertise and industry knowledge allow us to provide a vital service, while also further expanding on our ESG software to support these new reporting programs” said Wes Hawthorne, President of Locus. 

Building on over a decade of GHG verification experience, Locus remains the only software provider for collecting, managing, and reporting GHG emissions that is also an accredited verifier. Using this expertise, the software includes unparalleled tools for transparent and auditable calculations for GHG programs.  

The Convergence of Augmented Reality and GIS

Today is GIS Day, a day started in 1999 to showcase the many uses of geographical information systems (GIS). Earlier blog posts by Locus Technologies for GIS day have shown how GIS supports cutting-edge visualization of objects in space and over time. This year’s post explains how GIS supports augmented reality.

Augmented reality (AR) is a technology that enhances how we experience the real world by overlaying your surroundings with computer-generated objects. It differs from virtual reality (VR) because in VR, everything you see is computer generated, but in AR, the majority of what you see is real – your experience of reality is enhanced (augmented) but not totally replaced.

You are probably familiar with one AR application already if you watch American football. The ‘virtual’ first down line that appears on field before each play is projected there by computer and is not really painted on the field. If you follow soccer (or football to the rest of the world), AR is used by a Video Assistant Referee (VAR) to objectively determine tight offsides decisions. Digital lines are drawn across the field to show whether or not attackers are illegally past the last defender or not. Another AR example is the popular game Pokémon Go that shows cute virtual creatures in your living room or your front yard.

To experience AR, you need something to project the non-real objects onto your view of the world. Many AR applications use mobile phones or other devices. An AR application uses the camera view to show you the world around you and then overlays virtual objects onto the view. Other devices such as head mounted displays, ‘smart glasses’, or even ‘bionic contact lenses’ can use AR, but have not been as popular as phones or other mobile devices. In contrast to AR, VR cannot be fully supported with just a mobile device and usually requires headsets to immerse you in a virtual world. Because of this need, AR is much less intrusive than VR is.

Countless other examples of AR already exist in many fields. A few selected applications include:

  • Online shoppers at some e-commerce sites can use smart devices to project furniture into their home to see how the pieces look before making a purchase.
  • Some clothing stores can project clothing onto shoppers’ bodies to check appearance without having to change clothes. These applications require the user to be in a special dressing booth with full body scanning capabilities.
  • Urban planners use AR to display how planned buildings, cell towers, wind turbines, and other structures would look in the existing space. Planners can walk the streets and view how proposed projects would alter the existing cityscape.
  • AR is used in manufacturing to display operation and safety instructions in a worker’s field of vision using head mounted displays, which circumvents the need to refer to bulky paper manuals.
  • Utility managers can see underground pipelines, water lines, sewer pipes, electrical lines, and other infrastructure projected below their feet.

So how does GIS relate to AR? There are three main uses of GIS in AR:

  • Location: Any AR application must know where the user is and where to place virtual objects. In most cases, full GIS capabilities are not needed; instead, the application accesses a GPS (global positioning system) to find locations. Consider the Pokémon Go application mentioned before. The game knows where the various Pokémon need to appear. When a user plays the game, it uses GPS to find the user, and then shows any Pokémon that are near the user based on their locations.
  • Layers: An AR application may need to show features that are not visible to the user, such as underground electrical lines, earthquake fault lines, property lines, or planned buildings. All these features can be stored as GIS map layers in the cloud and then displayed in the AR application as virtual overlays projected on the real world. Furthermore, a user could select a displayed item and view related attribute information in the GIS layer. For example, a user could view the condition, age, and repair status of a selected water pipeline.
  • Navigation: An AR application may also need to help a user get from point A to point B, for example in a crowded airport or in a large warehouse. Such navigation could be facilitated by showing virtual route markers and arrows on the real world.

Locus has been exploring environmental uses of AR and GIS by adding AR to Locus Mobile, which is the Locus app for collecting field data, completing EHS audits, tracking waste containers, and completing other tasks requiring users to gather data out of the office. Locus Mobile now features an AR mode to assist users when taking field samples. When the user activates AR mode, the app uses the camera to show the user’s immediate area. The app then puts multiple virtual markers on the display corresponding to sampling points located in that direction. As the user moves or rotates the phone to change the viewing area, the markers change to reflect the locations in the user’s line of sight. Clicking a marker provides more information including the location name and the distance from the user.

Locus Mobile uses all three ways to combine GIS with AR:

  • By using GPS to find the user’s location and the locations of nearby sampling points.
  • By using GIS to display the layer of sampling points.
  • By using GIS to assist with navigation to sampling points by showing distance and direction.

Here is a sample image from Locus Mobile showing three nearby sampling locations along with information about past events or measurements at the locations. The three blue banners are the augmented reality displayed on top of the view of the nearby surroundings.

Locus Augmented Reality

By using GIS and AR to assist users in finding sampling points, Locus Mobile makes field personnel more productive. Samplers can find field locations quickly and can easily pull up related information. Locus continues to explore using AR to expand the functionality of its environmental applications.


Interested in Locus’ GIS solutions?

Locus GIS+ features all of the functionality you love in EIM’s classic Google Maps GIS for environmental management—integrated with the powerful cartography, interoperability, & smart-mapping features of Esri’s ArcGIS platform!

Learn more about Locus’ GIS solutions.


About the Author—Dr. Todd Pierce, Locus Technologies

Dr. Pierce manages a team of programmers tasked with development and implementation of Locus’ EIM application, which lets users manage their environmental data in the cloud using Software-as-a-Service technology. Dr. Pierce is also directly responsible for research and development of Locus’ GIS (geographic information systems) and visualization tools for mapping analytical and subsurface data. Dr. Pierce earned his GIS Professional (GISP) certification in 2010.

The Horrors of Excel for Data Management

Locus has been preaching on the pitfalls of Excel for a long time. It’s no surprise that one of the worst imaginable errors in Excel that could’ve happened, did. Almost 16,000 COVID-19 cases in England went unreported because Public Health England hit the maximum row count in their version of Excel.

This is not the only example of Excel being misused or being the wrong tool entirely for the job. Excel is not in any way a data management system for complex or vital data. When it comes to sustainability reporting and environmental data management, the evils of the grid are a force to be reckoned with. We have highlighted a few examples that will have you shivering.

Excel Horrors - Evils of Autofill

Case 1: The Evils of Autofill

Take a look at this harmless-looking chart. It shows monthly electricity consumption for a facility set to report:

Month  Monthly Electricity Consumption (MWh) 
January 2019  133,500 
February 2019  122,400 
March 2019  138,900 
April 2019  141,600 
May 2019  141,601 
June 2019  141,602 
July 2019  141,603 
August 2019  141,604 
September 2019  141,605 
October 2019  141,606 
November 2019  141,607 
December 2019  141,608 

During review, the auditor notices a distinct trend from April to December, indicating false data overwritten by a stray double-click. Eventually, the auditor required re-entering all invoice data for dozens of facilities to correct the issue. Where the original data went and how autofill went astray remains a mystery.


Excel Horrors - Phantom File Editor

Case 2: The Phantom File Editor

Imagine using a massive spreadsheet with lots of linked calculations for your annual sustainability report. One of the team engineers works on the file to input more data and get it ready for presentation. But in the final steps, they accidentally delete one of the formulas that sum up the indicators. The annual total looks great for the presentation since you’ve effectively removed a portion of your resource consumption, but afterwards you discover the conclusions were incorrectly calculated.  How did that error get introduced?  The spreadsheet has no auditing capabilities on the individual values, so you may never know.

Excel supports multiple users editing one document simultaneously, but not well.  Multiple records are saved, edits are lost, and vital data vanishes, or at best is very hard to recover. The Track Changes feature is not infallible, and over reliance on it will cause hardship.

Excel Horrors - Date of the Dead

Case 3: Date of the Dead

Excel has a frustrating insistence of changing CAS numbers into dates, even if they are something like “7440-09-7″ turning into September 7, 7400. If you’re not explicit in your cell formatting, Excel isn’t happy leaving values as they are.


Excel Horrors - Imposter Numbers

Case 4: Imposter Numerical Values

You meant to type 1.5, but you typed “1..5” or “.1.5”. Does Excel reject these imposter numbers or let you know of a potential error? No, it’s stored in Text format. This can throw off any averages or sums you may be tracking. This minor identity theft can cause a real headache.


Other Significant Cases:

Other data quality issues with using Excel include, but are not limited to:

  • Locations with multiple variations of the same ID/name (e.g., MW-1, MW-01, MW 1, MW1, etc.)
  • Use of multiple codes for the same entity (e.g., SW and SURFW for surface water samples)
  • Loss of significant figures for numeric data
  • Special characters (such as commas) that may cause cells to break unintentionally over rows when moving data into another application
  • Bogus dates like “November 31” in columns that do not have date formats applied to them
  • Loss of leading zeros associated with cost codes and projects numbers (e.g., “005241”) that have only numbers in them but must be stored as text fields
  • The inability to enforce uniqueness, leading to duplicate entries
  • Null values in key fields (because entries cannot be marked as required)
  • Hidden rows and/or columns that can cause data to be shifted unintentionally or modified erroneously
  • Inconsistent use of lab qualifiers— in some cases, these appear concatenated in the same Excel column (e.g., “10U, <5”) while in other cases they appear in separate columns

As you can see, the horrors of Excel are common, and terrifying. Without a proper system of record, auditing features, and the ability for data to vanish into the ephemera, Excel offers little in the way of data security and quality for organizations managing vital environmental and compliance data. Many are learning firsthand the superiority of database management systems over spreadsheets when it comes to managing data. Now is the time to examine the specific shortcomings of your current system and consider your options.


6 Ways To Get Data Into Your EHS System

Locus provides multiple methods to populate EHS, ESG, or any environmental data, including the following:

6 Ways to Input Data


Integrations

Locus provides a full suite of REST API’s, and SDK that can be used to populate data from external data sources. Typical uses include utility data, CEMS, meter data and IoT data.


Surveys

Locus Survey tool enables you to issue survey questionnaires to people outside your organization, and enables them to securely and seamlessly respond directly into the survey form. Typical uses include supplier surveys, audits and customer questionnaires.


Mobile

User input forms can be optimized for input on a phone or tablet, which allows quick uploads of photos and also geotags your data so you can ensure it was collected at the right location.


Excel and Text Files

Locus provides a full suite of Excel upload tools that allow you to import data directly from Excel or CSV files. This option also allows you to work offline and re-sync your data later. Typical uses include laboratory data, periodic monitoring data and data migrations.


Manual Data

Like any system, Locus provides tools for users to directly enter data into the system. These include Locus sophisticated data validation tools which employs machine learning techniques to identify data entries which may be invalid, with visual indications of the expect range or ranges.


Email

Locus can be configured to directly read email input (as text) and place it into the system. Typical uses include instances where external users initiate a conversation, which then may be responded to from within the system, such as an inquiry, issue, or an incident report.


Automate Your Vapor Intrusion Management

The Vapor Intrusion tools in Locus’ Environmental Information Management (EIM) software solve the problem of time-consuming monitoring, reporting, and mitigation by automating data assembly, calculations, and reporting.

Locus Vapor Intrusion Solutions

Quickly and easily generate validated reports in approved formats, with all of the calculations completed according to your specific regulatory requirements. Companies can set up EIM for its investigation sites and realize immediate cost and time savings during each reporting period.

Locus EIM Devices


PFAS Drinking Water Regulations by State

Are stricter PFAS standards coming your way?

PFAS chemicals were first invented in the 1930s and have since been used in several applications from non-stick coatings to waterproof fabrics to firefighting foams. In recent years, PFAS studies and research funding have increased remarkably, but as of right now the EPA has yet to implement regulations on the chemicals. Many states have leapfrogged the EPA by implementing regulations on PFAS use, safe PFAS levels in drinking water, and by suing manufacturers of PFAS chemicals. This creates a complex set of regulatory requirements, depending on where you operate.

Updated August 30, 2021

PFAS Lawsuits and Drinking Water Limits in US

Locus offers software solutions for PFAS management and tracking. Our EHS software features tools to manage multiple evolving regulatory standards, as well as sample planning, analysis, validation, and regulatory reporting—with mobile and GIS mapping functionality. Simplify tracking and management of PFAS chemicals while improving data quality and quality assurance. With future PFAS regulations being an inevitability, the time is right to adopt a software that can track and manage these and other chemicals.


Combat Green Skepticism with Accurate ESG Data

Greenwashing, or the presenting of misinformation to create a sustainable image, is common among organizations. While many consumers may not be aware with the term greenwashing, they are aware of how common it is. In fact, consumers are so aware of this trend that they’re overwhelmingly skeptical of all organizations presenting themselves as sustainable. Four out of every five consumers have expressed skepticism of organizations claiming to be sustainable. So, how does your company express your sincere desire to take steps that are sustainable for the environment? With accurate and transparent data.

Avoid Green Skepticism and Greenwashing with Locus

With 2/3 of consumers seeking out companies that emphasize sustainable practices, the temptation to greenwash is certainly enticing. Sometimes it comes in the form of making irrelevant claims, like saying a product is free of something that is banned (like CFCs). Other times it comes in the form of half-truths, like saying that a product is sustainably sourced, despite the manufacture of the product being unsustainable or harmful to the environment. Any way you look at it, the demand for sustainable products is so high, as is the temptation to greenwash. The truest, and least disputable way to combat greenwashing is by collecting and reporting your data accurately.

Sustainability is now a broad umbrella term that encompasses not only environmental practices, but social and corporate governance as well, better known as ESG. This broadness reflects a change in consumer attitudes from generation to generation, perceiving more than environmental practices as important while holding environmental practices to the microscope. In fact, over 75% of Gen X consumers say that they have to trust a brand before purchasing from them, and over 85% of Millennial and Gen Z consumers say they same. This trust encompasses everything from the use of organic ingredients to company wellness practices, and is reinforced with buying practices. To do environmental, social, and corporate governance right, organizations have taken a data-first approach.

Credible ESG Reporting with Locus

With Locus Technologies, you can take concrete steps towards achievable ESG goals. By taking a fully-digital approach, your organization can make the transformation by maintaining full visibility of raw sustainability data, calculations, and other factors, and also keeping data easily accessible and traceable. Reports are fully traceable back to the source, and are indisputable, allowing for increased trust from consumers or anyone else who has a stake in this information. Given that 7/10 consumers are willing to pay a premium to sustainable-minded companies who are fully transparent with their efforts, this move can provide a significant return on investment in the short term.

The benefits of data centralization also go beyond combatting greenwashing. A fully-digital and streamlined process will improve your ability to handle the data appropriately, and will ease any auditing and reporting responsibilities moving forward, making the entire process cheaper and faster.

Avoid Green Skepticism and Greenwashing with Locus

With brand loyalty and purchasing decisions being reliant on sustainable decisions, the move to accurate and transparent data management is key. By implementing Locus Technologies ESG software, your organization can employ cutting-edge solutions to combat greenwashing by promoting your sustainability goals and actions transparently and accurately.


No-Code Application Development

Locus delivers capabilities that enterprises need to achieve true digital transformation in a unified low-code or no-code automation platform. Locus provides out-of-the-box tools and services to automate business processes, integrate with external applications, and provide a rich user experience.

No-Code EHS Application Development

Locus offers low-code app building, rich multi-experience capabilities, business process orchestration, automated decision making, and easy integration with other databases. Locus makes it easy to modify existing seeded apps or build entirely new apps in a few clicks and provides easy ways to write business logic to solve challenging EHS or ESG problems. We let you blend “off the shelf” apps and unique requirements with exceptional ease.

Who is a User-Developer?

If you know how to layout slides, if you can draw a flow chart, build a spreadsheet using formulae, sorting, with tables and charts, then you are a User Developer. We empower domain experts to build applications within the Locus Platform using the platform’s drag and drop functionality.

What is No-Code Development Platform Software?

No-code development platforms provide drag-and-drop tools that enable end-users with proper access privileges to develop software quickly without coding. Locus Platform provides WYSIWYG editors and drag-and-drop components to rapidly assemble and design EHS, ESG, or any other application applications. Both developers and non-developers can use these tools to practice rapid application development with customized workflows and functionality. Locus Platform provides tools for enterprise-sized businesses that need to quickly design business processes and workflow applications at a large scale, such as ESG reporting or EHS compliance management. The software tools provide templates for workflow, element libraries, and interface customization to create fully functioning applications without any coding.

With Locus, your organization can:

  • Drag-and-drop entities to assemble applications.
  • Allow non-developers and non-technical users to build applications.
  • Build ESG, EHS, or any other apps fast using visual tools that empower IT and business lines alike.
  • Leverage no-code integration to connect and act upon data across databases, cloud services, and legacy systems without data migration or use APIs to tie in data.
  • Deliver enterprise-grade security, scalability, and reliability to support mission-critical business apps.
  • Easily build complex workflows to suit your organizations needs.

More on Custom Apps.