5 Powerful Features of Locus Environmental Software
Maybe you are a user of Locus’ Environmental Software (EIM) and are looking to get more out of our product. Or perhaps you are using another company’s software platform and looking to make a switch to Locus’ award-winning solution. Either way, there are some features that you may not know exist, as Locus software is always evolving by adding more functionality for a range of customer needs. Here are five features of our environmental software that you may not know about:
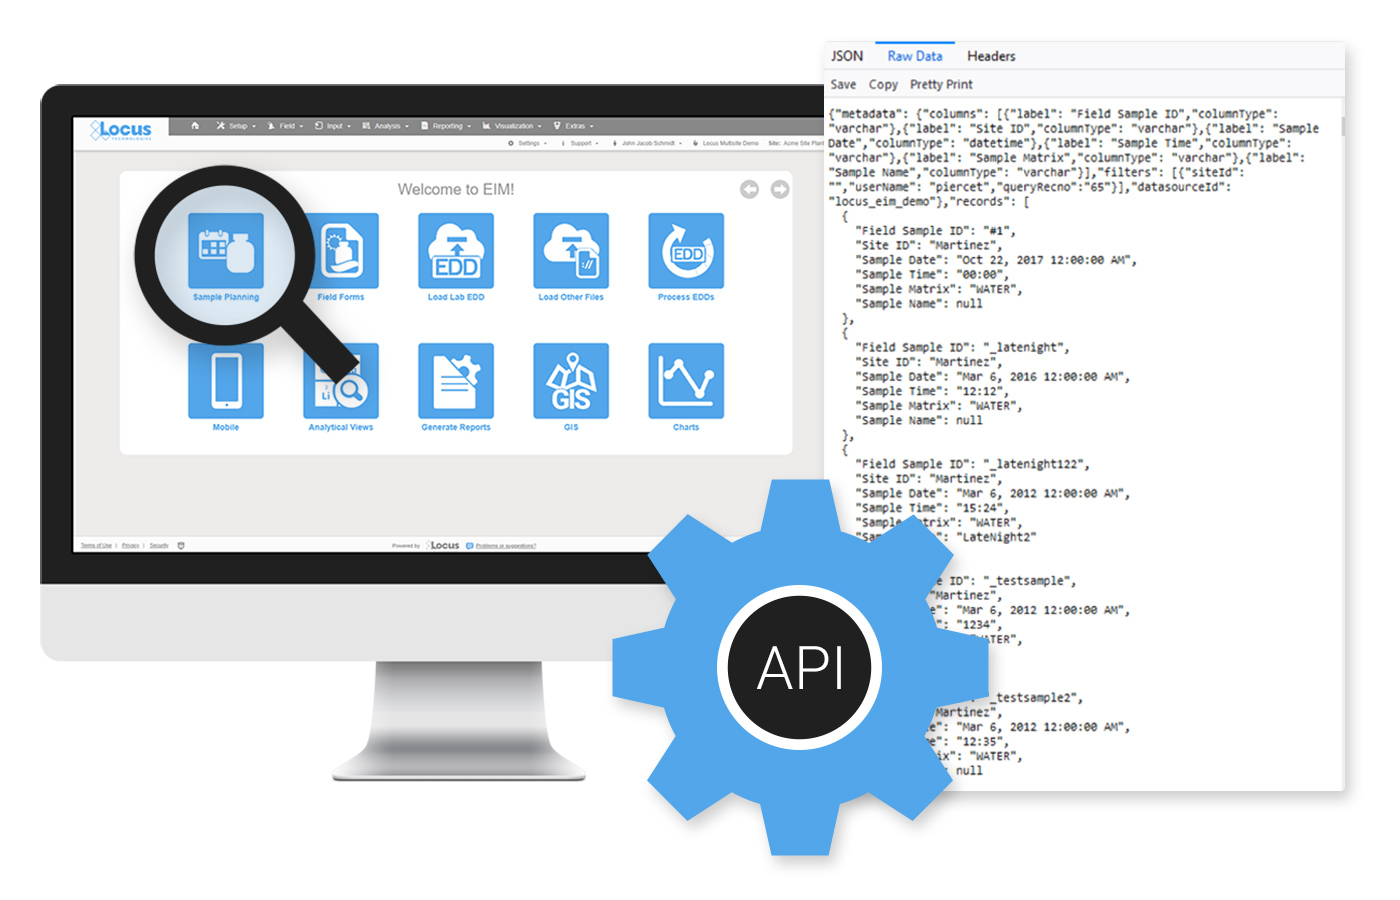
1. APIs for Queries
Locus expanded the EIM application programming interface (API) to support running any EIM Expert Query. Using a drag and drop interface, an EIM user can create an Expert Query to construct a custom SQL query that returns data from any EIM data table. The user can then call the Expert Query through the API from a web browser or any application that can consume a REST API. The API returns the results in JSON format for download or use in another program. EIM power users will find the expanded API extremely useful for generating custom data reports and for bringing EIM data into other applications.
2. Scheduled Queries for Expert Query Tool
The Expert Query Builder lets users schedule their custom queries to run at given times with output provided in an FTP folder or email attachment. Users can view generated files through the scheduler in a log grid, and configure notifications when queries are complete. Users can scheduled queries to run on a daily, weekly, monthly, or yearly basis, or to run after an electronic data deliverable (EDD) of a specified format is loaded to EIM. Best of all, these queries can be instantly ran and configured from the dashboard.
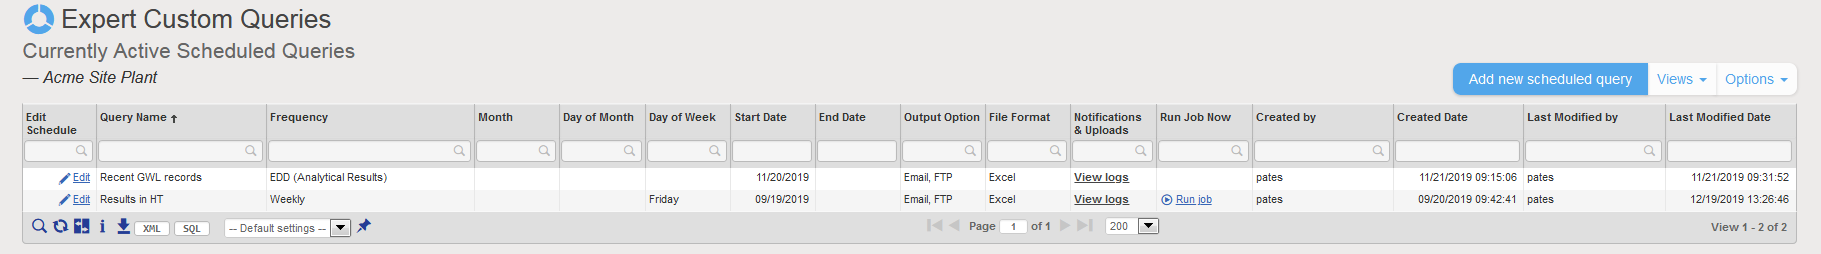
Scheduled Queries in Locus EIM
3. Chart Formatting
Multiple charts can be created in EIM at one time. Charts can then be formatted using the Format tab. Formatting can include the ability to add milestone lines and shaded date ranges for specific dates on the x axis. The user can also change font, legend location, line colors, marker sizes and types, date formats, legend text, axis labels, grid line intervals or background colors. In addition, users can choose to display lab qualifiers next to non-detects, show non-detects as white filled points, show results next to data points, add footnotes, change the y-axis to log scale, and more. All of the format options can be saved as a chart style set and applied to sets of charts when they are created.
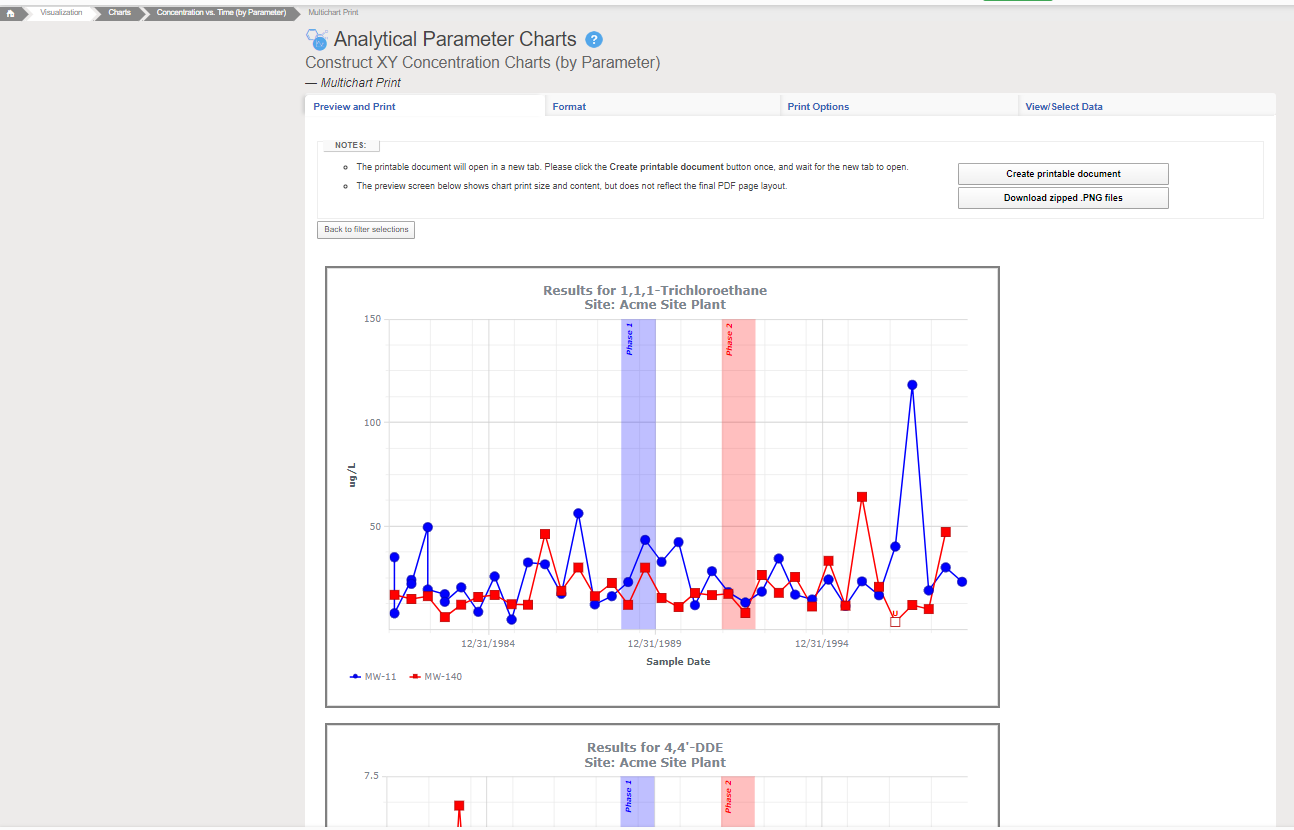
Chart Formatting in Locus EIM
4. Quick Search
To help customers find the correct EIM menu function, Locus added a search box at the top right of EIM. The search box returns any menu items that match the user’s entered search term.
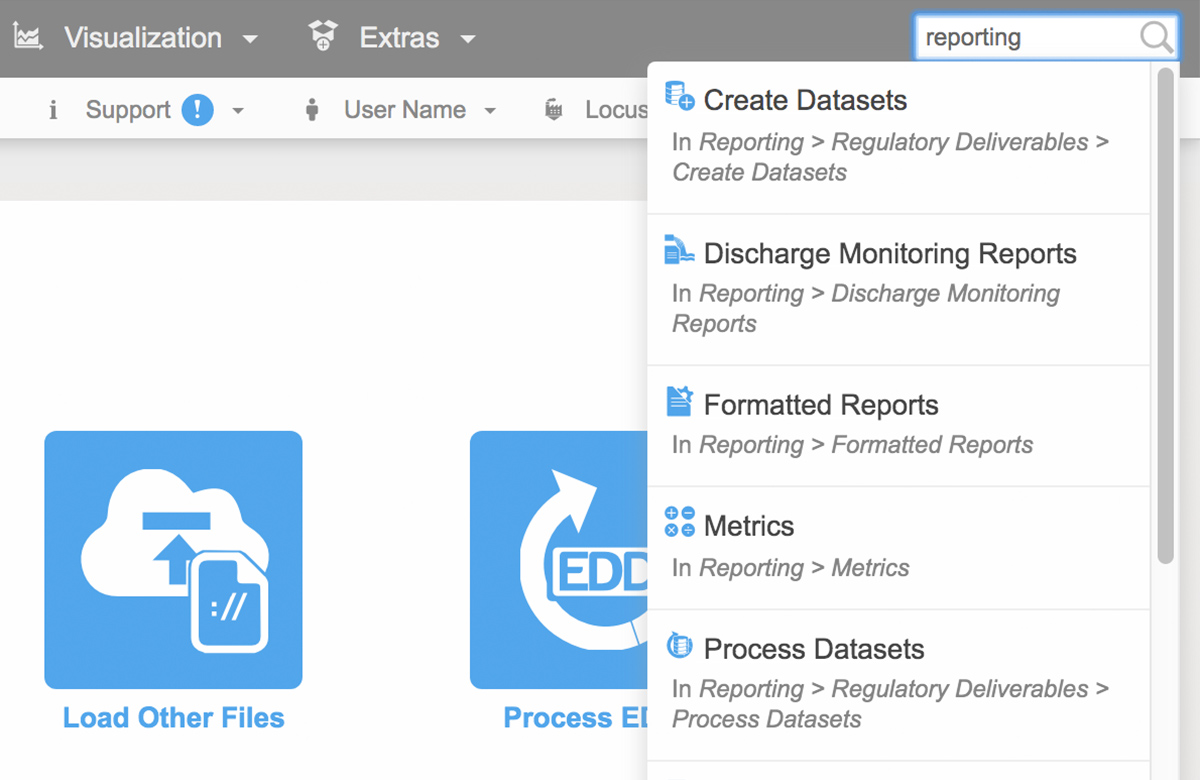
Locus EIM Quick Search
5. Data Callouts in Locus’ Premium GIS Software
When the user runs the template for a specific set of locations, EIM displays the callouts in Locus’ premium GIS software, GIS+, as a set of draggable boxes. The user can finalize the callouts in the GIS+ print view and then send the resulting map to a printer or export the map to a PDF file.
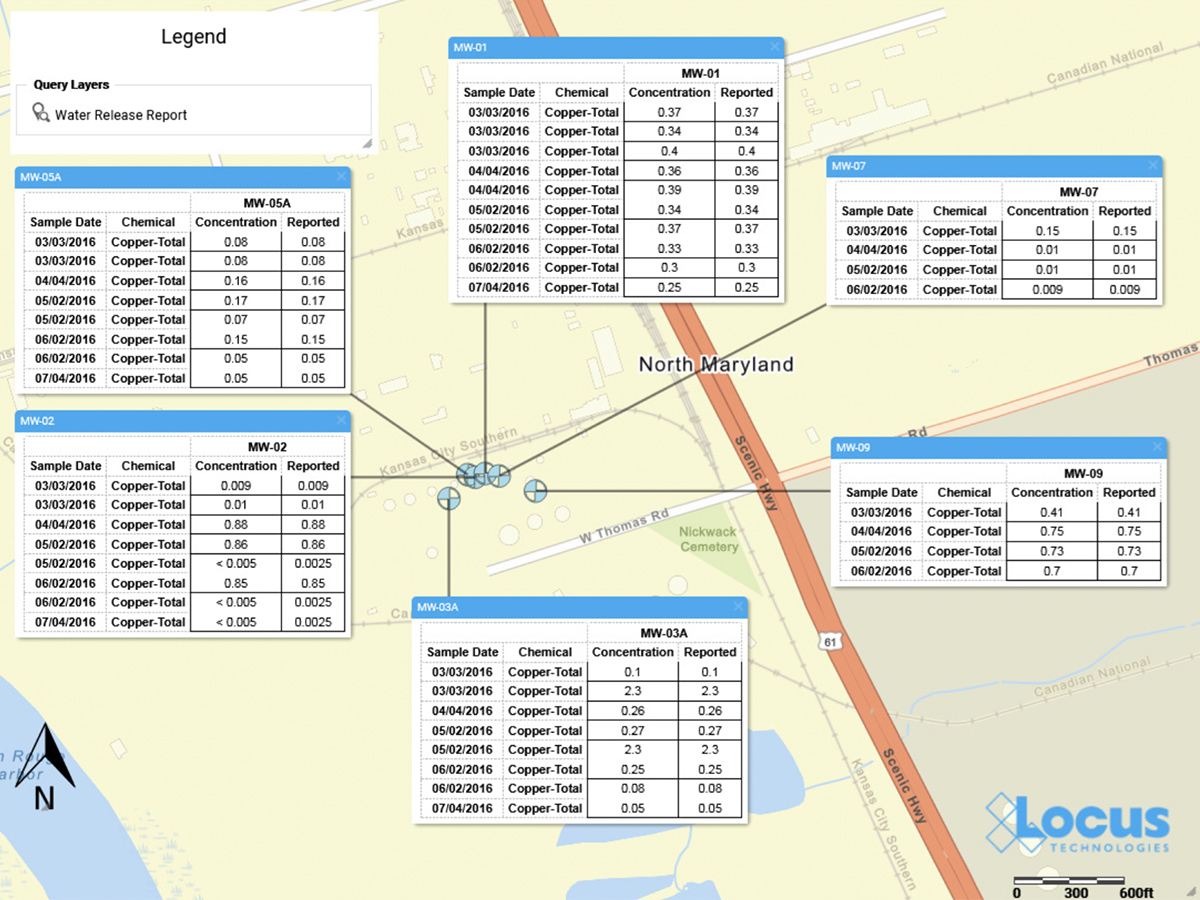
Locus GIS+ Data Callouts