12 ways commercial SaaS can save your complex environmental data (part 1/4)
Do you currently use a system of Excel spreadsheets to store your environmental data? If so, ask yourself the following questions:
- Do you find yourself having to make the same changes in multiple spreadsheets?
- Is your spreadsheet growing unwieldy and difficult to manage?
- Are you finding that you’re spending more and more time scrolling through your spreadsheet, looking for specific information?
- Do you have to jump through hoops to view specific subsets of data?
- Do multiple people sometimes need access to the data at the same time? Or, are your colleagues continually asking you to provide them with copies or subsets of the data in your spreadsheet?
- Are there redundancies in your data? Is the same information repeated on multiple rows of your spreadsheet?
- Do you ever encounter erroneous entries that have been typed in by hand?
- Are you concerned about the long-term security of your data?
- Do you often wonder exactly where your data are?
- Does someone else really own your data (perhaps your IT department)?
If you answer “yes” to any of these questions, you might be outgrowing your homegrown system of Excel spreadsheets. It may be time to consider a more mature tool to manage and store your environmental data.
The advantages of databases over spreadsheets for managing complex data
Before we look at other options, let’s examine the differences in how data are stored and managed in spreadsheets and databases.
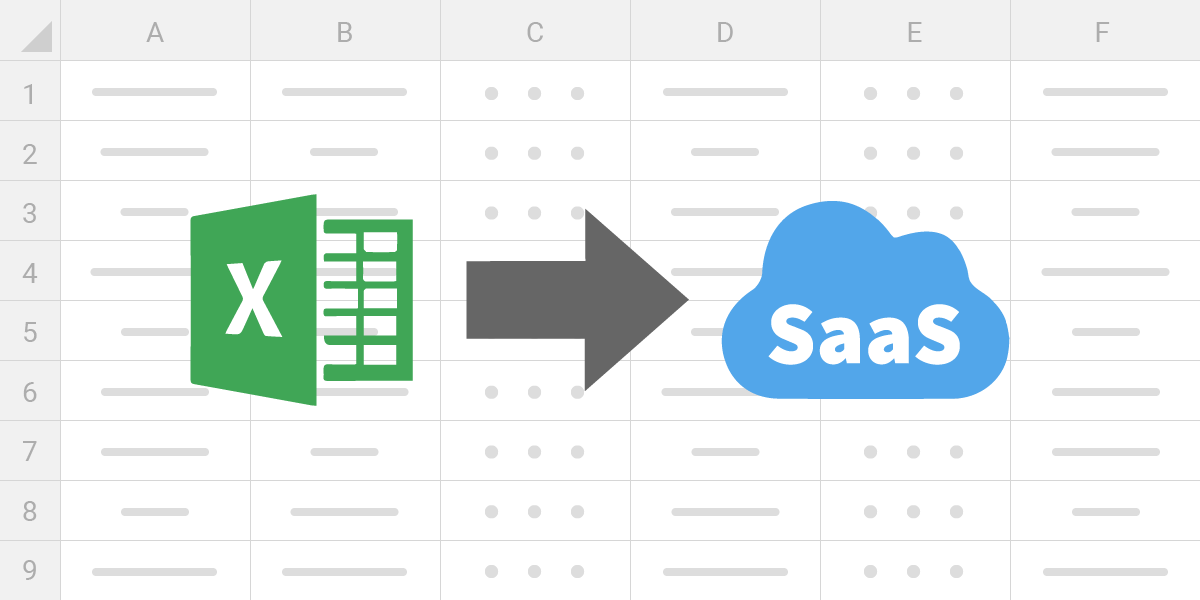
A spreadsheet consists of rows and columns. At the intersection of each are cells that store data values. Some cells can refer to other cells, and some cells can perform processing on other individual (or groups of) cell values.
In contrast, a database is made up of named tables that contain records. Each record has columns in which values are stored. Each table stores information on a particular type of entity. For environmental data, this could be field samples, sampling locations, analytical results, regulatory limits, or laboratory methods. Typically, one or more columns in each record store values that uniquely identify an instance of the entity. In the case of a field sample, this could be the “field sample ID”; for a location, the “location ID”.
As we move to analytical or field measurements, we have to use more columns to uniquely identify a record (e.g., date, time, field sample or location ID, parameter). The remaining columns in a table that are not part of the “primary key” identify other attributes of the entity. For samples, these attributes include sample date and time, sample matrix, sample purpose, sampling event, sampling program, etc.
If you think of a data table as a grid with rows and columns, it seems very similar to a spreadsheet—but there’s a fudamental difference. With a spreadsheet, how you view or report the data is dictated by how it appears in the spreadsheet—WYSIWYG. If you need to view the data differently, you must reformat the spreadsheet. In contrast, you can view information stored in a database (or serve it up in a report) in multiple ways that doesn’t necessarily depend on how the data is stored in the underlying tables.
Databases, which are often referred to by the acronym DBMS (Database Management Systems), offer many other advantages over spreadsheets when dealing with complex data.
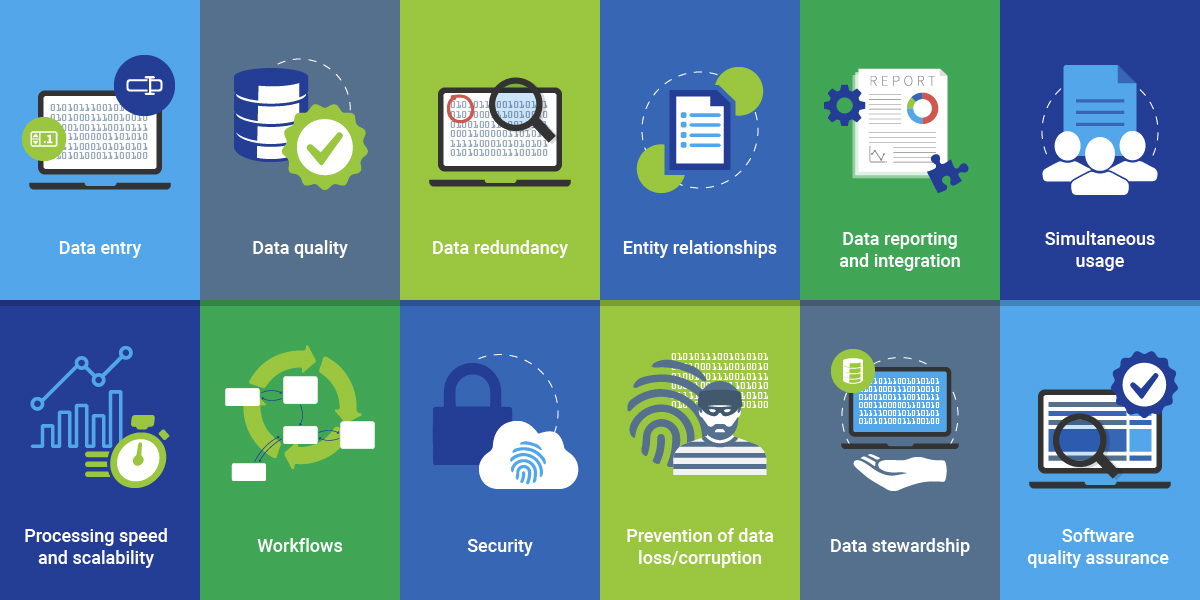
Here are 12 key areas where databases—especially cloud databases built for industry-specific needs—surpass their spreadsheet counterparts.
If, at the end of this guide, you’re still not convinced of the advantages of databases over spreadsheets for data storage, consider Microsoft’s recommendations as to when to use its low-end DBMS (Access) and when to use Excel.
Microsoft emphasizes that Excel can store large amounts of data in worksheets. However, it notes that Excel is not intended to serve as a database, but is optimized for data analysis and calculation.
According to Microsoft:
Use Access when you:
- Anticipate many people working in the database and you want robust options that safely handle updates to your data, such as record locking and conflict resolution.
- Anticipate the need to add more tables to a dataset that originated as a flat or nonrelational table.
- Want to run complex queries.
- Want to produce a variety of reports or mailing labels.
Use Excel when you:
- Require a flat or nonrelational view of your data instead of a relational database that uses multiple tables, and when your data is mostly numeric.
- Frequently run calculations and statistical comparisons on your data.
- Want to perform sophisticated “what-if” analysis operations on your data, such as statistical, engineering, and regression analysis.
- Want to keep track of items in a simple list, either for personal use or for limited collaboration purposes.
In this 4-part blog series, we’ll explore in detail each of the 12 key areas where cloud-based environmental databases excel over home-grown spreadsheets.
Let’s get started!
1) Data entry is better with databases
 If you use spreadsheets to manage your environmental information, how do you get data into it?
If you’re collecting the same information every week, month, quarter, or year, perhaps you have a template that you use. You might fill in only the data fields that change from one event to another, then append the rows in this template to an existing worksheet, or insert them into a new one. Alternatively, you might copy a set of rows in your spreadsheet, and then edit any fields with values that have changed.
In the case of analytical data, if you don’t have to type in the data manually, perhaps your lab provides data in a spreadsheet that mirrors the structure of your spreadsheet, allowing you to cut and paste it without edits.
Each of these methods of entering data has limitations and risks:
- Manual entry inevitably introduces errors, unless someone is independently checking every entry for accuracy.
- Copying and editing are notoriously prone to mistakes. It is too easy to overlook fields that should be updated in the copied records.
- Getting a lab to send you data in a spreadsheet whose structure mirrors yours can be problematic, even more so if you deal with different labs for different types of analyses. Even then, there is no check on the validity of the laboratories’ entries.
- Are all date and number fields actually the correct data types?
- Do all required fields have values in them?
Databases provide various means of data input. Two of the most commonly used methods are form entry (for when you need to enter a few records at a time) and EDDs (Electronic Data Deliverables), used for uploading text files containing tens, hundreds, or even thousands of data records in text or zipped files.
Flexible form configuration as a standard database feature
Databases provide unlimited flexibility in designing forms—with searchable lookup fields, advanced form controls, sophisticated styling, context-sensitive help, data validation, event handlers, and the ability to conditionally display individual or blocks of fields, based on the user’s selections.
Better, faster batch data loading with EDDs
The real strength of databases comes about from their ability to load and process EDDs. Each record in an EDD typically consists of 10-50 fields (e.g., in the case of laboratory analyses: Field Sample ID, Analytical Method, Analysis Date, Lab Result, Units, etc.). The data in these EDDs can be checked for incorrect data types, missing required values, entries that are restricted by lookup tables or LOVs (Lists of Values), and duplicates.
Make sure to read the entire series to find out about 12 reasons commercial SaaS databases excel at managing complex environmental data!
About the author—Gregory Buckle, PhD, Locus Technologies
 Dr. Buckle has more than 30 years of experience in the environmental field, most of which have been devoted to the design, development, and implementation of environmental database management systems. When he joined Locus in 1999, he was responsible for building and deploying Locus’ cloud-based EIM software. He was also instrumental in customizing EIM for the water utility industry and developing EIM’s powerful Sample Planning and Data Validation modules. The latest iteration of the Sample Planning module that Dr. Buckle built is currently being used by Los Alamos National Laboratory and San Jose Water Company to plan and schedule thousands of samples per year.
About the author—Marian Carr, Locus Technologies
 Ms. Carr is responsible for managing overall customer solution deployments and customer relationships with Locus’ government accounts. Her career at Locus includes heading the product development team of the award-winning cloud-based environmental ePortal solution as well as maintaining and growing key customer accounts with Locus’ Fortune 100 enterprise deployments. In addition, Ms. Carr was instrumental in driving the growth and adoption of the Locus EIM platform with key federal and water organizations.

