Reveal important patterns that are hiding in plain sight.
Locus visual analytics tools reveal critical trends and patterns in environmental data
Environmental data is vast. And complex. While these massive datasets are rich with information, it’s tough to derive actionable insights from countless rows and columns. Visual analytics are the answer.
Data visualization tools chunk data for display in visual formats like grids, charts, or maps. These visual representations of complex data effectively convey the meaning of the rows and columns, and they can be assembled within Locus dashboards for simple monitoring. But they don’t stop at helping analysts and non-technical users to interpret current impacts. Visual analytics help users quickly grasp trends and forecast implications, such as using GIS to predict the likely migration path for a contaminant.
Benefits
Locus manages over 1,250,000 worldwide locations and 500,000,000 analytical records in real time.
1,250,000
Worldwide Locations
500,000,000
Real-Time Analytical Records
Geospatial visualization
When you need more than just a Google Map, Locus also offers built-in GIS mapping (ArcGIS online compatible).
Grids and tables
Locus displays subsets of data within powerful grids for further analysis. Filtering and sorting options enable users to slice and dice the dataset and drilldown on any parameters. Click a button to display the selection criteria on a GIS map.
Charts and graphs
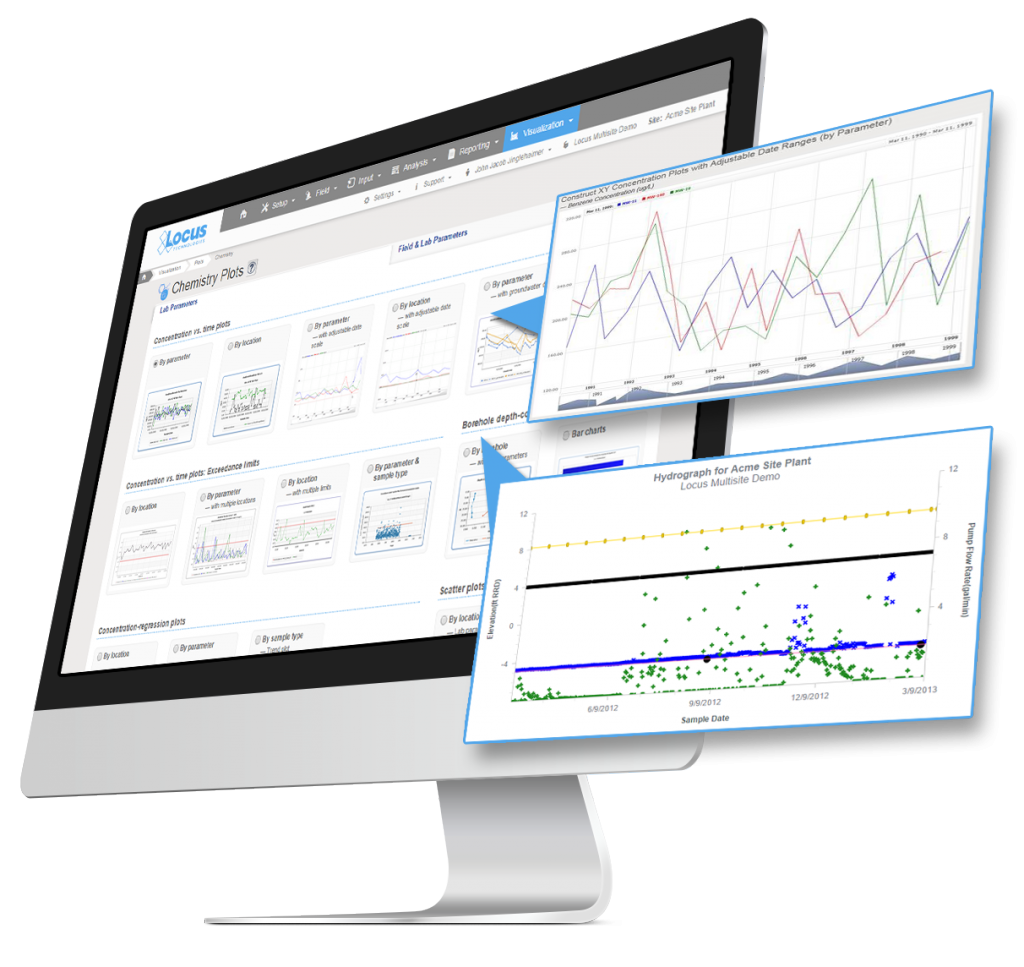
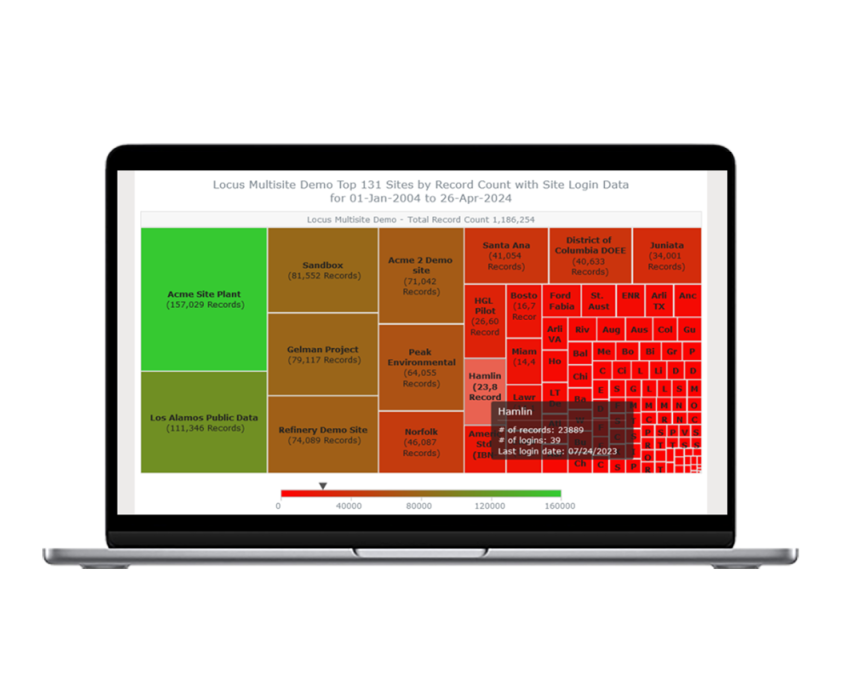
Locus software supports bar graphs, pie and funnel charts, sparkline and time series charts, scatter plots, tree maps, regression charts, and hydrographs, to name a few.
Boring logs
Create and display clickable boring logs of your sample data—using custom style formats and cross-sections. Show depth ranges, lithology patterns, aquifer information, and detailed descriptions for your samples.
Value-added integrations
API connectors enable environmental data to be shared between Locus software and third-party visualization tools like Microsoft Power BI® and Tableau®. The API connections remain live, so the latest Locus data is always displayed in the visualizations.
Did you know?
Locus is the only EHS software company that supports the complete spectrum of EHS data alongside scientist-grade formulas, analysis, mapping, compliance, and reporting tools within a configurable framework.


