Tag Archive for: Cloud Computing

Regardless of the size of your organization or the industry you’re in, chances are that right now artificial intelligence can benefit your EHS&S initiatives in one way or another. And whether you are ready for it or not, the age of artificial intelligence is coming. Forward-thinking and adaptive businesses are already using artificial intelligence in EHS&S as a competitive advantage in the marketplace to great success.

Locus Artificial Intelligence (AI) for EHS

With modern EHS&S software, immense amounts of computing power, and seemingly endless cloud storage, you now have the tools to achieve fully-realized AI for your EHS&S program. And while you may not be ready to take the plunge into AI just yet, there are some steps you can take to implement artificial intelligence into your EHS&S program in the future.

Perhaps the best aspect of preparing for AI implementation is that all of the steps you take to properly bring about an AI system will benefit your program even before the deployment phase. Accurate sources, validated data, and one system of record are all important factors for any EHS&S team.

Accurate Sources

Used alongside big data, AI can quickly draw inferences and conclusions about many aspects of life more efficiently than with human analysis, but only if your sources pull accurate data. Accurate sources data will help your organization regardless of your current AI usage level. That’s why the first step to implementing artificial intelligence is auditing your data sources.

Sources pulling accurate data can be achieved with some common best practices. First, separate your data repository from the process that analyzes the data. This allows you to repeat the same analysis on different sets of data without the fear of not being able to replicate the process of analysis. AI requires taking a step away from an Excel-based or in-house software, and moving to a modern EHS&S software, like Locus Platform that will audit your data as it is entered. This means that anything from SCADA to historical outputs, samples, and calculations can be entered and vetted. Further, consider checking your data against other sources and doing exploratory analysis to greater legitimize your data.

Validated Data

AI requires data, and a lot of it—aggregated from multiple sources. But no amount of predictive analysis or machine learning is going to be worth anything without proper data validation processes.

Collected data must be relevant to the problem you are trying to solve. Therefore, you need validated data, which is a truly difficult ask with Excel, in-house platforms, and other EHS&S software. Appropriate inputs, appropriate ranges, data consistency, range checks (to name a few)—are all aspects of data that is validated in a modern EHS&S software like Locus Platform. Without these checks inherent to a platform, you cannot be sure that your data, or your analyses are producing useful or accurate results.

Possibly the best reason to get started with AI is the waterfall effect. As your data uncovers hidden insights and starts to learn on its own, the more accurate your new data will be and the better your predictions will become.

One System of Record

A unified system of record and a central repository for all data means that you see an immediate increase in data quality. Starting with AI means the end of disconnected EHS&S systems. No more transferring data from one platform to another or from pen and paper, just fully-digitized and mobile-enabled data in one platform backed up in the cloud. You also gain the added benefit of being able to access your data in real-time, incorporate compliance/reporting on the fly, and save time and resources using a scalable solution instead of a web of spreadsheets and ad-hoc databases.

Whether you are ready for AI or not, investing in these otherwise useful steps are necessary for any program looking to harness the power of artificial intelligence. When you are ready to take that next step, you will be well on the path to AI implementation, with a solid data infrastructure in place for your efforts.

Contact us to get prepared for AI

    Name

    Company Email

    Phone

    Tell us about your company's needs

    Locus is committed to preserving your privacy.

    To learn more about artificial intelligence, view this NAEM-hosted webinar led by Locus experts, or read our study on predicting water quality using machine learning.

    GIS Day was established in 1999 to showcase the power and flexibility of geographical information systems (GIS).  In celebration of the 55th birthday of GIS, we’ve compiled a brief history of the evolution of this powerful technology, with a special focus on how it can be used in EHS applications to make environmental management easier.

    Not only is GIS more powerful than ever before—it is also vastly more accessible.  Anyone with Internet access can create custom maps based on publicly available data, from real-time traffic conditions to environmental risk factors, to local shark sightings. Software developers, even those at small companies or startups, now have access to APIs for integrating advanced GIS tools and functionality into their programs.

    Origins of GIS

    Before you can understand where GIS is today, it helps to know how it started out. This year is the 55th anniversary of the work done by Roger Tomlinson in 1962 with the Canada Land Inventory. We consider this the birth of GIS, and Mr. Tomlinson has been called the “father of GIS”.

    The original GIS used computers and digitalization to “unlock” the data in paper maps, making it possible to combine data from multiple maps and perform spatial analyses. For example, in the image shown here from the Canada Land Inventory GIS, farms in Ontario are classified by revenue to map farm performance.
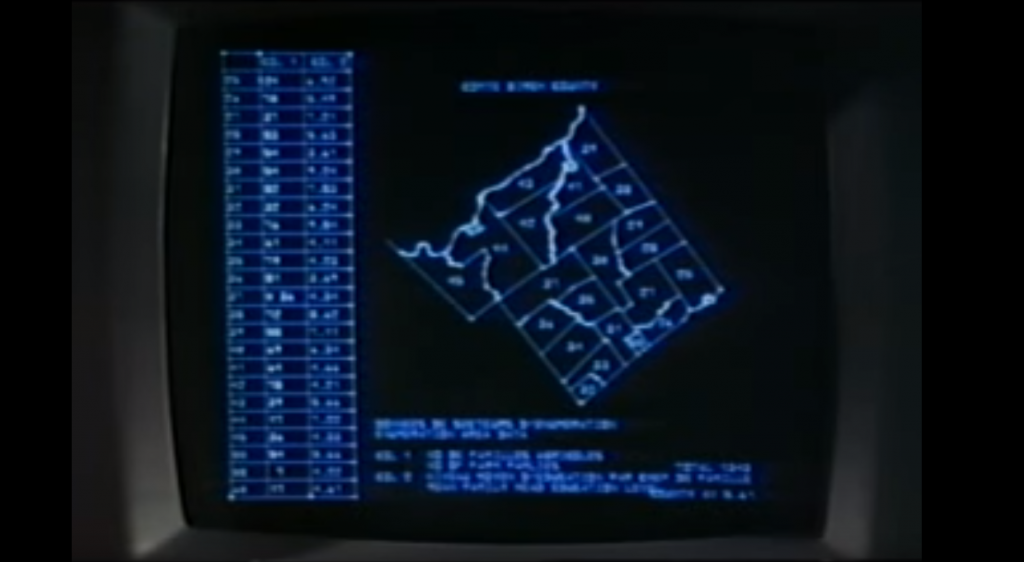
    An early GIS system from the Canada Land Inventory, in Data for Decisions, 1967

    An early GIS system from the Canada Land Inventory, in Data for Decisions, 1967
    Photo: Mbfleming. “Data for Decisions (1967).” YouTube, 12 Aug. 2007, https://youtu.be/ryWcq7Dv4jE.
      Part 1, Part 2, Part 3

    In 1969, Jack Dangermond founded Esri, which became the maker of, arguably, the world’s most popular commercial GIS software. Esri’s first commercial GIS, ARC/INFO, was released in 1982, and the simpler ArcView program followed in 1991. Many of today’s most skilled GIS software developers can trace their roots back to this original GIS software.

    Back then, GIS work required expensive software packages installed on personal computers or large mainframe systems. There was no Google Maps; all map data had to be manually loaded into your software. Getting useful data into a GIS usually required extensive file manipulation and expertise in coordinate systems, projections, and geodesy.

    While the government, utility, and resource management sectors used GIS heavily, there was not much consumer or personal use of GIS. Early GIS professionals spent much of their time digitizing paper maps by hand or trying to figure out why the map data loaded into a GIS was not lining up properly with an aerial photo. This may sound familiar to those who have been in the environmental industry for awhile.

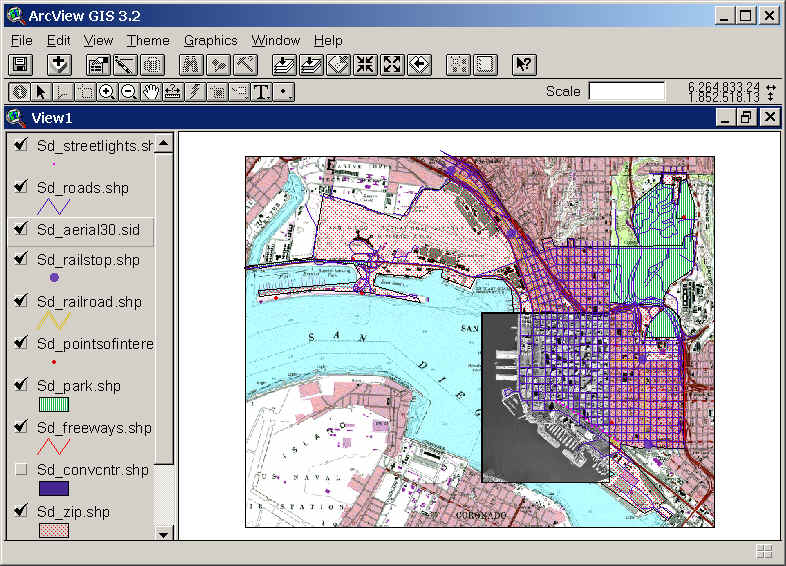
    Esri’s ArcView 3.2 for desktop computers (from the 1990s)

    Esri’s ArcView 3.2 for desktop computers (from the 1990s)
    https://map.sdsu.edu/geog583/lecture/Unit-3.htm

    The Google Revolution

    How much has changed since those early days! After the release of OpenStreetMap in 2004, Google Maps and Google Earth in 2005, and Google Street View in 2007, GIS has been on an unstoppable journey—from only being used by dedicated GIS professionals on large computers in specific workplaces, to be accessible to anyone with an internet browser or a smartphone. High-quality map data and images—often the most expensive item in a GIS project in the 1990’s — are now practically free.

    Just think how revolutionary it is that anyone can have instant access to detailed satellite images and road maps of almost anywhere on Earth! Not only can you perform such mundane tasks as finding the fastest route between two cities or locating your favorite coffee shop while on vacation—you can also see live traffic conditions for cities across the globe; view aerial images of countries you have never visited; track waste drums around your facility; and get street level views of exotic places. Back in 1991, such widespread access to free map data would have seemed like something straight out of science fiction.
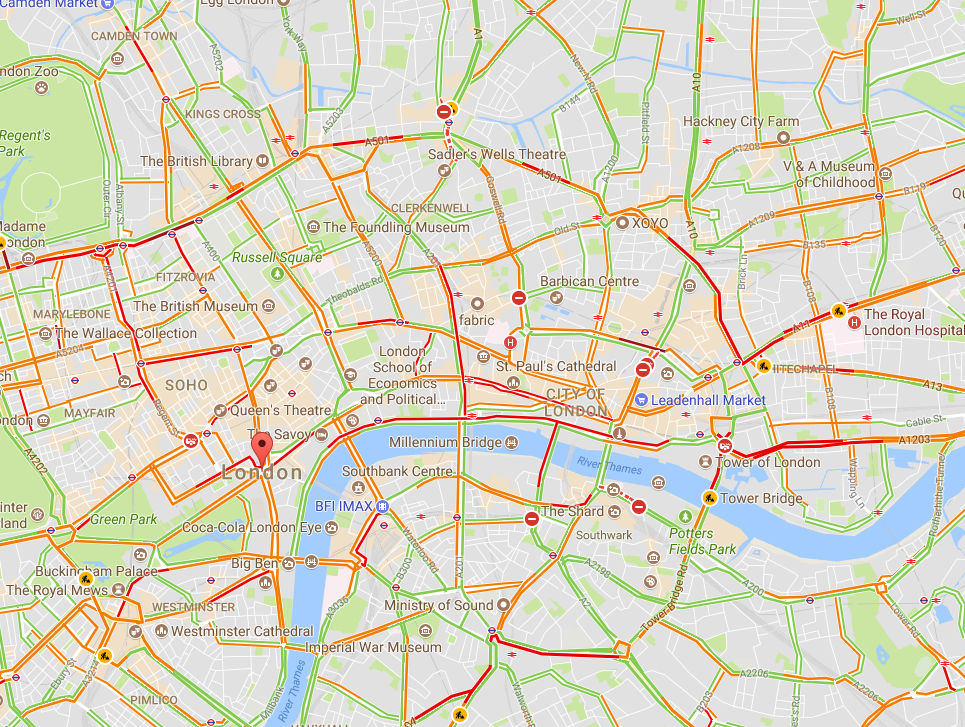
    Traffic conditions in London, 3:30 pm 10/16/2017, from Google Maps

    Traffic conditions in London, 3:30 pm 10/16/2017, from Google Maps

    South Base Camp, Mount Everest, Google StreetView

    South Base Camp, Mount Everest, Google StreetView

    Mashups in the cloud

    Obviously, the amount of spatial data needed to provide detailed coverage of the entire globe is far too large to be stored on one laptop or phone. Instead, the data is distributed across many servers “in the cloud.” Back in the 1990s, everything for one GIS system (data, processing engine, user interface) needed to be in the same physical place—usually one hard drive or server. Now, thanks to the internet and cloud computing, the data can be separate from the software, creating “distributed” GIS.

    The combination of freely available data with distributed GIS and the power of smart phones has led us to the age of “neogeography”—in which anyone (with some technical knowledge) can contribute to online maps, or host their maps with data relevant to their personal or professional needs. GIS no longer requires expensive software or cartographical expertise; now, even casual users can create maps linking multiple data sources, all in the cloud.

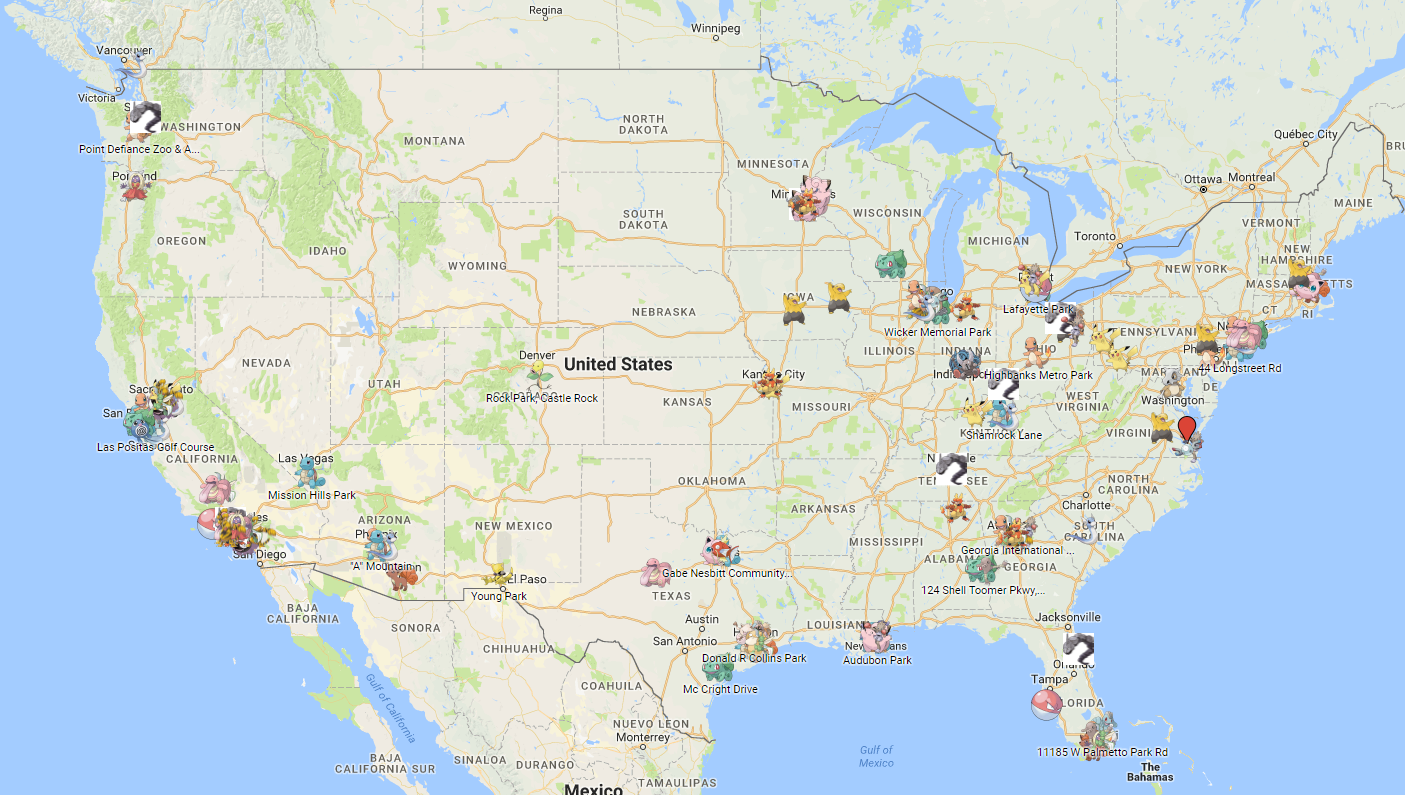
    Google’s MyMaps is an example of a tool for easily making your maps. Maps can range from the playful, such as locations of “Pokemon nests,” to the serious, such as wildfire conditions.

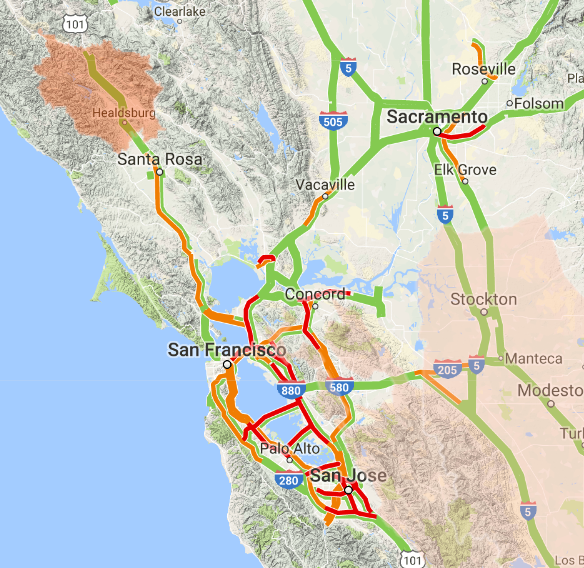
    These online maps can be updated in real time (unlike paper maps) and therefore kept current with actual conditions. Such immediate response is instrumental in emergency management, where conditions can change rapidly, and both first responders and the public need access to the latest data.

    Map showing wildfire and traffic conditions in northern California, 10/16/2017

    Map showing wildfire and traffic conditions in northern California, 10/16/2017
    https://google.org/crisismap/us-wildfires

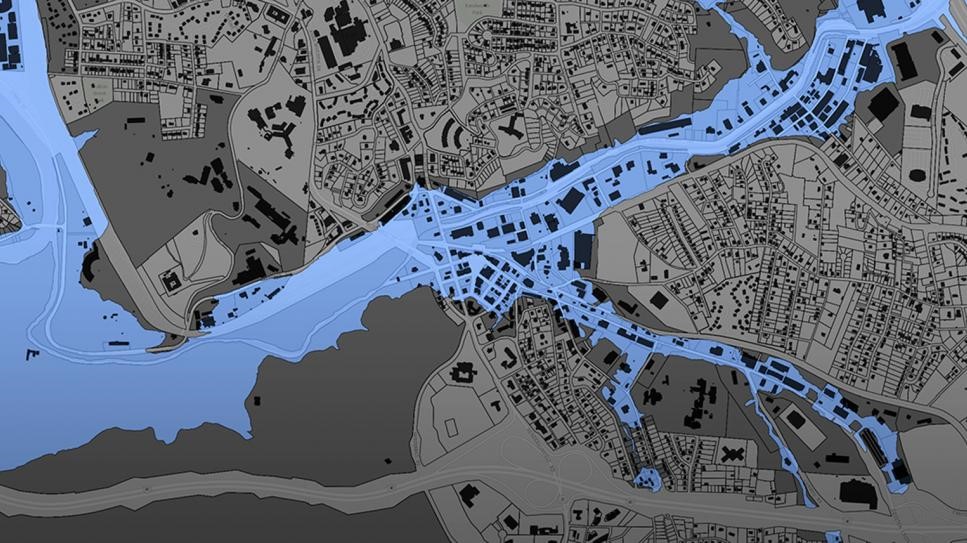
    Furthermore, software programmers have created online GIS tools that let non-coders create their maps. These tools push the boundaries of distributed GIS even further by putting the processing engine in the cloud with the data. Only the user interface runs locally for a given user. During this period of GIS history, it became easy to create “mashups” for viewing different types of disparate data at once, such as natural hazard risks near offices, pizza stores near one’s neighborhood, EPA Superfund sites near one’s home, property lines, flood plains, landslide vulnerability, and wildfire risk.

    Floodplain data for Buncombe County, NC

    Floodplain data for Buncombe County, NC
    https://buncombe-risk-tool.nemac.org

    Programming GIS with APIs

    Another significant advance in GIS technology is the ability to integrate or include advanced GIS tools and features in other computer programs. Companies such as Google and Esri have provided toolkits (called APIs, or application programming interfaces) that let coders access GIS data and functions inside their programs. While neogeography shows the power of personal maps created by the untrained public, computer programmers can use APIs to create some very sophisticated online GIS tools aimed at specific professionals or the public.

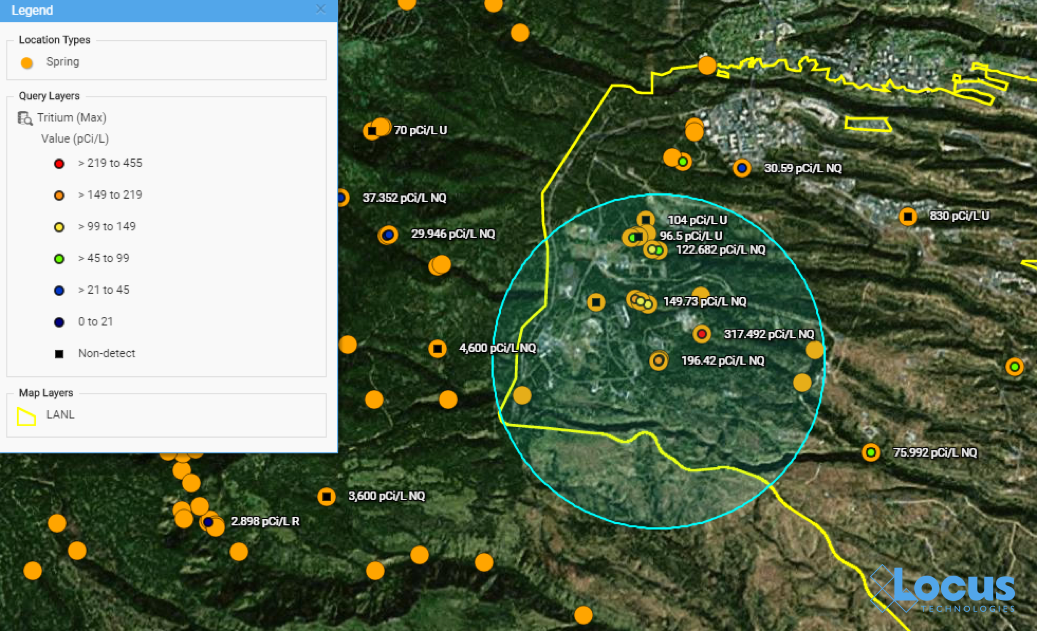
    One example is the publicly-available Intellus application that Locus Technologies developed and hosts for the US Department of Energy’s Los Alamos National Laboratory. It uses an Esri API and distributed GIS to provide access to aerial images and many decades of environmental monitoring data for the Los Alamos, NM area. Users can make maps showing chemical concentrations near their home or workplace, and they can perform powerful spatial searches (e.g., “find all samples taken within one mile of my house in the last year”). The results can be color-coded based on concentration values to identify “hot spots”.

    Map from Intellus showing Tritium concentrations near a specified location

    Map from Intellus showing Tritium concentrations near a specified location
    https://www.intellusnmdata.com

    Another example of more sophisticated forms of analysis is integration of GIS with environmental databases. Many government facilities and private vendors incorporate GIS with online data systems to let public users evaluate all types of information they find relevant.

    For example, contour lines can be generated on a map showing constant values of groundwater elevation, which is useful for determining water flow below ground. With such powerful spatial tools in the cloud, any facility manager or scientist can easily create and share maps that provide insight into data trends and patterns at their site.
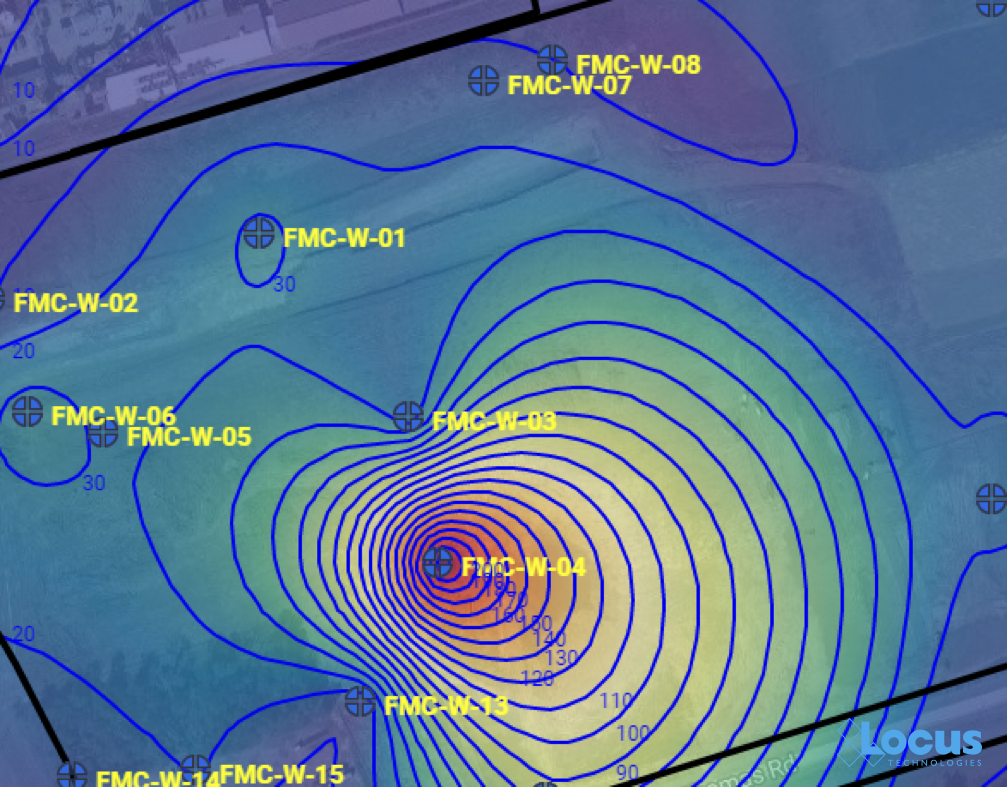
    Groundwater contour map

    Groundwater contour map where each line is a 10 ft. interval, from the Locus EIM system

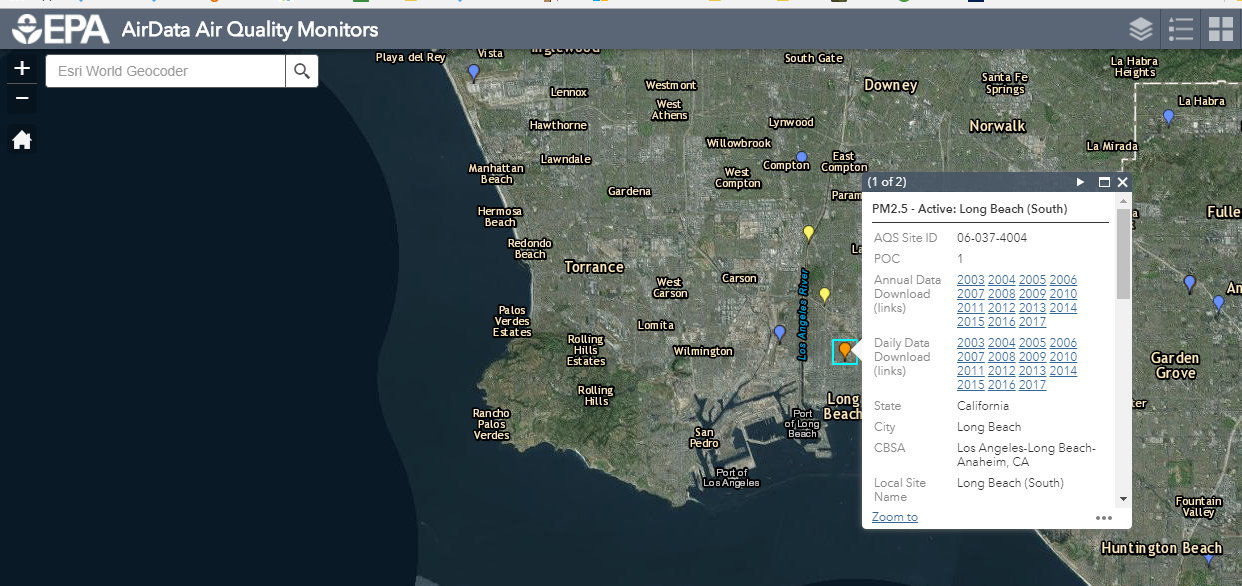
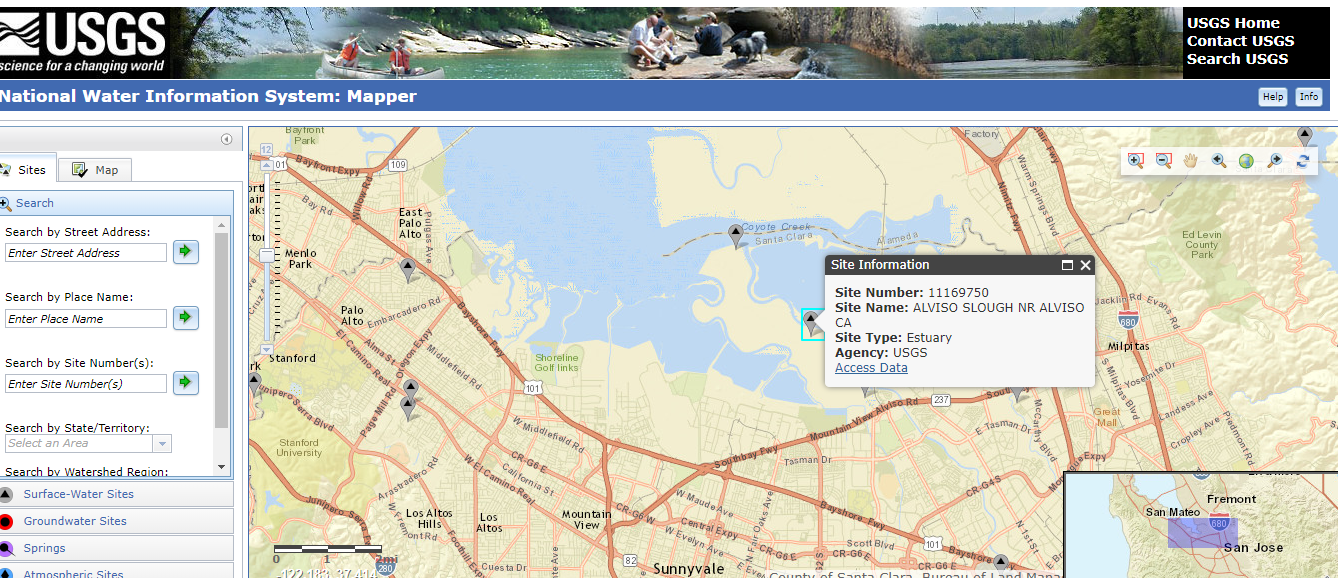
    Other examples include monitoring air emissions at monitoring sites (like US EPA’s AirData Air Quality Monitors, shown below) and actual stream conditions from the USGS (also shown below).

    Screen capture of air quality data from US EPA AirData GIS app

    Screenshot from US EPA AirData Air Quality Monitors interactive GIS mapping platform, showing Long Beach, California


    Screen capture of USGS National Water Information System interactive GIS map tool

    Screen capture of USGS National Water Information System interactive GIS map tool, showing a site in Mountain View, California

    There’s a (map) app for that

    One particularly exciting aspect of GIS today is the ability to use GIS on a smartphone or tablet. The GIS APIs mentioned above usually have versions for mobile devices, as well as for browsers. Programmers have taken advantage of these mobile APIs, along with freely available map data from the cloud, to create apps that seamlessly embed maps into the user experience. By using a smartphone’s ability to pinpoint your current latitude and longitude, these apps can create personalized maps based on your actual location.

    A search in the Apple AppStore for “map” returns thousands of apps with map components. Some of these apps put maps front-and-center for traditional navigation, whether by car (Waze, MapQuest, Google), public transit (New York Subway MTA Map, London Tube Map), or on foot (Runkeeper, Map My Run, AllTrails). Other apps use maps in a supporting role to allow users to find nearby places; for example, banking apps usually have a map to show branches near your current location.

    What’s really exciting are the apps that allow users to enter data themselves via a map interface. For example, HealthMap’s Outbreaks Near Me not only shows reports of disease outbreaks near your location, but it also lets you enter unreported incidents. The GasBuddy app shows the latest gasoline prices and lets you enter in current prices. This “crowdsourcing” feature keeps an app up-to-date by letting its users update the map with the latest conditions as they are happening.
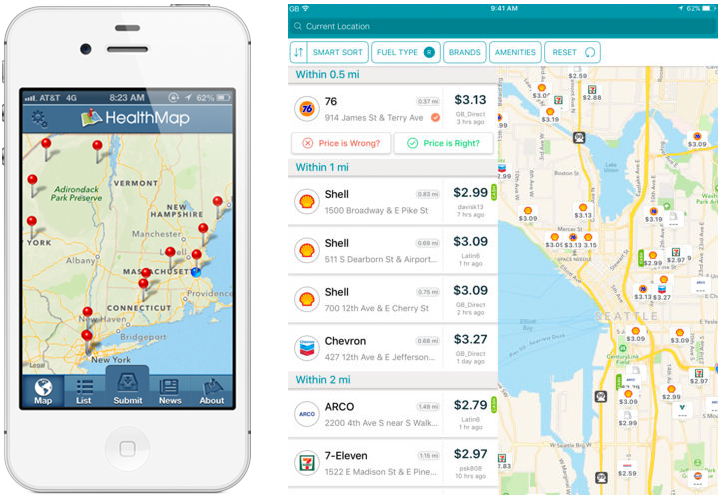
    The Outbreaks Near Me app for phones (left) and the GasBuddy app for tablets (right)

    The Outbreaks Near Me app for phones (left) and the GasBuddy app for tablets (right)

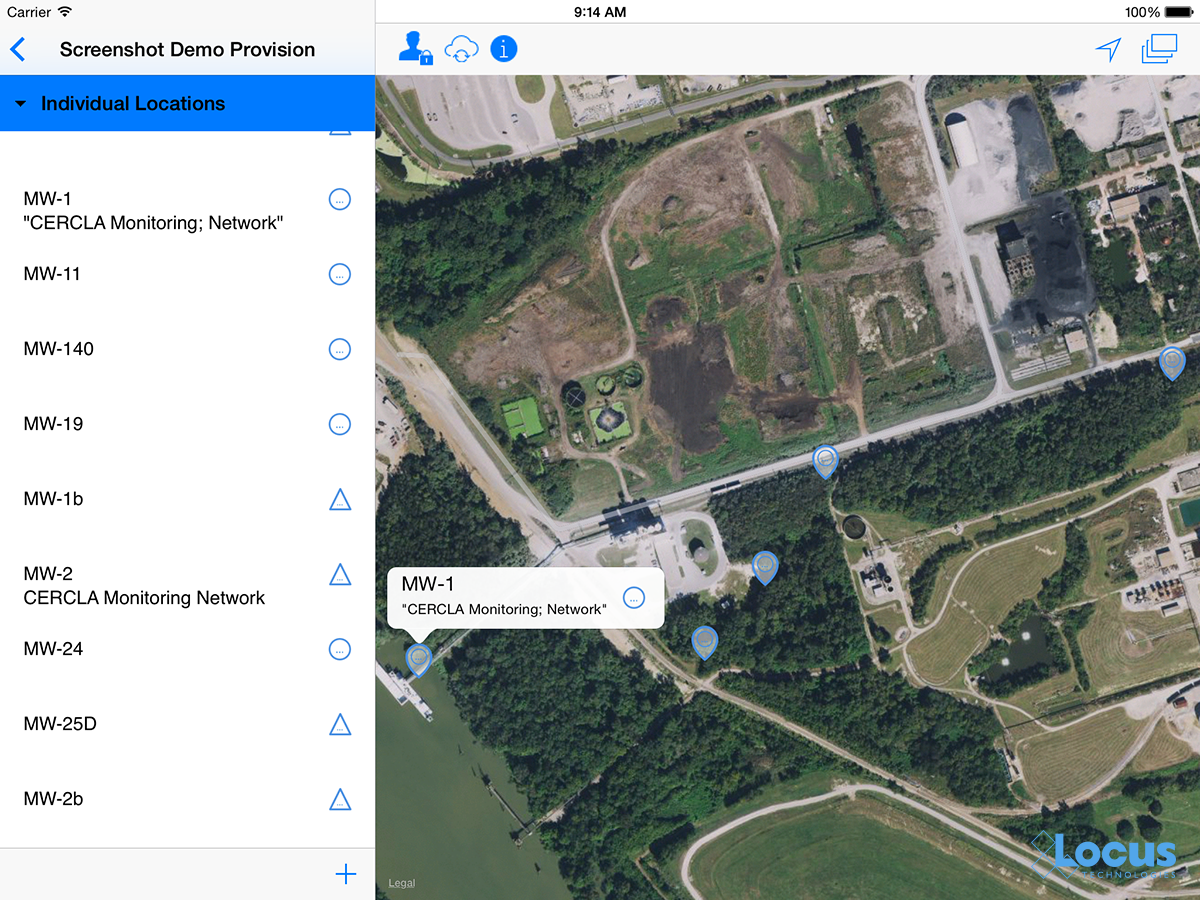
    EHS professionals can further harness the power of GIS using mobile applications.  For example, in the Locus Mobile app for field data collection, users can enter environmental data—such as temperature or pH measurements—from a sampling location, then upload the data back to cloud-based environmental management software for immediate review and analysis. Mobile apps can also support facility compliance audits, track current locations of hazardous waste drums, collect on-scene incident data (complete with photos), and record exact locations for mapping by colleagues back in the office.

    GIS-enabled mobile apps also typically include a map interface for navigating to data collection points and tracking visited locations. Other key features to look for include ad hoc location creation for capturing unplanned data—this lets users create new data collection points “on the fly” simply by clicking on the map.
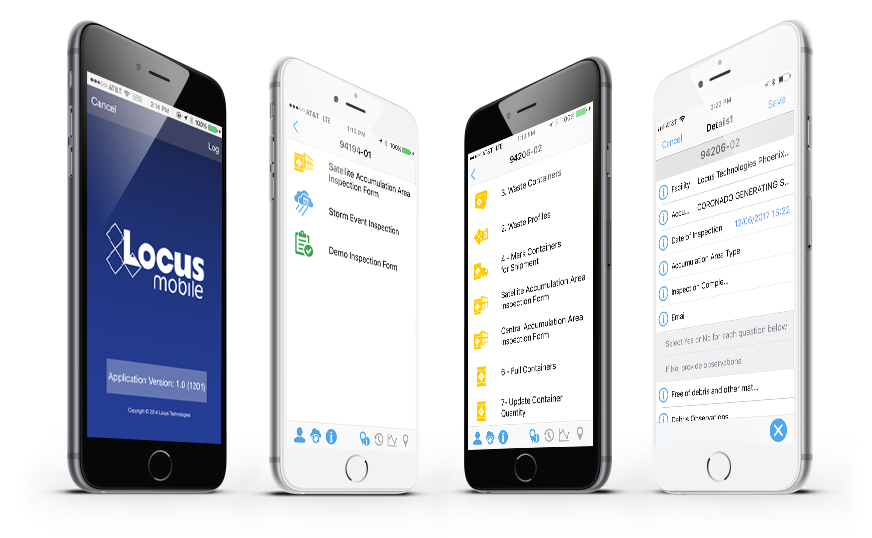
    Locus Mobile App

    Views of many different mobile app use cases from tracking drums to collecting field data

    A bright future for GIS applications within EHS software

    Where will GIS as a whole go from here? It’s possible that augmented reality, virtual reality, and 3D visualization will continue to expand and become as ubiquitous as the current “2D” maps on browsers and phones. Also, the “internet of things” will surely have a GIS component because every physical “thing” can be tied to a geographical location. Similarly, GIS can play an important role in “big data” by providing the spatial framework for analysis.

    GIS is one of the most effective ways to convey information to a wide range of users, from corporate managers looking at the company’s key metrics to operational personnel looking for incidents across facilities and trying to find trends. It is a highly intuitive data query interface that empowers users to explore the data hidden deep in enterprise EHS databases. The examples presented above are just the tip of the iceberg for the range of possibilities to simplify communication of information and look more broadly across enterprises to identify where real or potential issues lie.

    An EHS software system should have many ways to extract data and information to form insights beyond a few “canned” reports and charts. A spatially-accurate picture can often provide more actionable insight than tables and text. Imagine being able to see spill locations, incident locations, environmental monitoring stations for air quality, wastewater outfalls, central and satellite waste accumulation area locations, and PCB and asbestos equipment and/or storage locations—all visually represented on an actual map of your facility and its surroundings. All these types of maps are invaluable in an enterprise EHS software system and should be a critical item on your checklist when selecting software for your EHS needs.

    Thanks to the GIS Timeline for providing some of the history for this article.


    Locus employee Todd PierceAbout guest blogger— Dr. Todd Pierce, Locus Technologies

    Dr. Pierce manages a team of programmers tasked with development and implementation of Locus’ EIM application, which lets users manage their environmental data in the cloud using Software-as-a-Service technology. Dr. Pierce is also directly responsible for research and development of Locus’ GIS (geographic information systems) and visualization tools for mapping analytical and subsurface data. Dr. Pierce earned his GIS Professional (GISP) certification in 2010.


    [jwplayer mediaid=”16590″]

    Interested in Locus’ GIS solutions?

    Introducing Locus GIS+. All the functionality you love in EIM’s classic Google Maps GIS for environmental management— now integrated with the powerful cartography, interoperability, & smart-mapping features of Esri’s ArcGIS platform!

    Learn more about GIS+

     

    Today, November 15, is GIS Day—an annual celebration established in 1999 to showcase the power and flexibility of geographical information systems (GIS).

    Not only is GIS more powerful than ever before—it is also vastly more accessible.  Anyone with Internet access can create custom maps based on publicly available data, from real-time traffic conditions to environmental risk factors, to local shark sightings. Software developers, even those at small companies or startups, now have access to APIs for integrating advanced GIS tools and functionality into their programs.

    As the Director of EIM and GIS Development at Locus, I lead efforts to integrate GIS with our software applications to deliver our customers’ spatial data using the latest GIS technology. Let us take a look at how far GIS has come since I started working with it and at some of the new and exciting possibilities on the horizon.

    Origins of GIS

    Before you can understand where GIS is today, it helps to know how it started out. This year is the 55th anniversary of the work done by Roger Tomlinson in 1962 with the Canada Land Inventory. We consider this the birth of GIS, and Mr. Tomlinson has been called the “father of GIS”.

    The original GIS used computers and digitalization to “unlock” the data in paper maps, making it possible to combine data from multiple maps and perform spatial analyses. For example, in the image shown here from the Canada Land Inventory GIS, farms in Ontario are classified by revenue to map farm performance.

    An early GIS system from the Canada Land Inventory, in Data for Decisions, 1967

    An early GIS system from the Canada Land Inventory, in Data for Decisions, 1967
    Photo: Mbfleming. “Data for Decisions (1967).” YouTube, 12 Aug. 2007, https://youtu.be/ryWcq7Dv4jE.
      Part 1, Part 2, Part 3

    In 1969, Jack Dangermond founded Esri, which became the maker of, arguably, the world’s most popular commercial GIS software. Esri’s first commercial GIS, ARC/INFO, was released in 1982, and the simpler ArcView program followed in 1991. That year, 1991, is also the year I started working with GIS, although I used the TransCAD system from Caliper before starting with Esri software a few years later.

    Back then, GIS work required expensive software packages installed on personal computers or large mainframe systems. There was no Google Maps; all map data had to be manually loaded into your software. Getting useful data into a GIS usually required extensive file manipulation and expertise in coordinate systems, projections, and geodesy.

    While the government, utility, and resource management sectors used GIS heavily, there was not much consumer or personal use of GIS. As for me, I spent a lot of time in my first job digitizing paper maps by hand or trying to figure out why the map data I had loaded into a GIS was not lining up properly with an aerial photo.

    Esri’s ArcView 3.2 for desktop computers (from the 1990s)

    Esri’s ArcView 3.2 for desktop computers (from the 1990s)
    https://map.sdsu.edu/geog583/lecture/Unit-3.htm

    The Google Revolution

    How much has changed since those early days! After the release of OpenStreetMap in 2004, Google Maps and Google Earth in 2005, and Google Street View in 2007, GIS has been on an unstoppable journey—from only being used by dedicated GIS professionals on large computers in specific workplaces, to be accessible to anyone with an internet browser or a smartphone. High-quality map data and images—often the most expensive item in a GIS project in the 1990’s — are now practically free.

    Just think how revolutionary it is that anyone can have instant access to detailed satellite images and road maps of almost anywhere on Earth! Not only can you perform such mundane tasks as finding the fastest route between two cities or locating your favorite coffee shop while on vacation—you can also see live traffic conditions for cities across the globe; view aerial images of countries you have never visited, and get street level views of exotic places. Back in 1991, such widespread access to free map data would have seemed like something straight out of science fiction.

    Traffic conditions in London, 3:30 pm 10/16/2017, from Google Maps

    Traffic conditions in London, 3:30 pm 10/16/2017, from Google Maps

    South Base Camp, Mount Everest, Google StreetView

    South Base Camp, Mount Everest, Google StreetView

    Mashups in the cloud

    Obviously, the amount of spatial data needed to provide detailed coverage of the entire globe is far too large to be stored on one laptop or phone. Instead, the data is distributed across many servers “in the cloud.” Back in the 1990s, everything for one GIS system (data, processing engine, user interface) needed to be in the same physical place—usually one hard drive or server. Now, thanks to the internet and cloud computing, the data can be separate from the software, creating “distributed” GIS.

    The combination of freely available data with distributed GIS and the power of smart phones has led us to the age of “neogeography”—in which anyone (with some technical knowledge) can contribute to online maps, or host their maps with data relevant to their personal or professional needs. GIS no longer requires expensive software or cartographical expertise; now, even casual users can create maps linking multiple data sources, all in the cloud.

    Google’s MyMaps is an example of a tool for easily making your maps. Maps can range from the playful, such as locations of “Pokemon nests,” to the serious, such as wildfire conditions.

    These online maps can be updated in real time (unlike paper maps) and therefore kept current with actual conditions. Such immediate response is instrumental in emergency management, where conditions can change rapidly, and both first responders and the public need access to the latest data.

    Map showing wildfire and traffic conditions in northern California, 10/16/2017

    Map showing wildfire and traffic conditions in northern California, 10/16/2017
    https://google.org/crisismap/us-wildfires

    Furthermore, software programmers have created online GIS tools that let non-coders create their maps. These tools push the boundaries of distributed GIS even further by putting the processing engine in the cloud with the data. Only the user interface runs locally for a given user. During this period of GIS history, I created several mashups, including one for viewing natural hazard risks for my hometown. For this application, I combined several data types, including property lines, flood plains, landslide vulnerability, and wildfire risk.

    Floodplain data for Buncombe County, NC

    Floodplain data for Buncombe County, NC
    https://buncombe-risk-tool.nemac.org

    Programming GIS with APIs

    Another significant advance in GIS technology is the ability to integrate or include advanced GIS tools and features in other computer programs. Companies such as Google and Esri have provided toolkits (called APIs, or application programming interfaces) that let coders access GIS data and functions inside their programs. While neogeography shows the power of personal maps created by the untrained public, computer programmers can use APIs to create some very sophisticated online GIS tools aimed at specific professionals or the public.

    During my 10 years at Locus, I have helped create several such advanced GIS tools for environmental monitoring and data management. One example is the publicly-available Intellus application that Locus Technologies developed and hosts for the US Department of Energy’s Los Alamos National Laboratory. It uses an Esri API and distributed GIS to provide access to aerial images and many decades of environmental monitoring data for the Los Alamos, NM area. Users can make maps showing chemical concentrations near their home or workplace, and they can perform powerful spatial searches (e.g., “find all samples taken within one mile of my house in the last year”). The results can be color-coded based on concentration values to identify “hot spots”.

    Map from Intellus showing Tritium concentrations near a specified location

    Map from Intellus showing Tritium concentrations near a specified location
    https://www.intellusnmdata.com

    Locus Technologies also provides more sophisticated forms of analysis in its EIM cloud-based environmental management system. For example, contour lines can be generated on a map showing constant values of groundwater elevation, which is useful for determining water flow below ground. With such powerful spatial tools in the cloud, anyone at the organization, from facility managers to scientists, can easily create and share maps that provide insight into data trends and patterns at their site.

    Groundwater contour map

    Groundwater contour map where each line is a 10 ft. interval, from the Locus EIM system

    There’s a (map) app for that

    One particularly exciting aspect of GIS today is the ability to use GIS on a smartphone or tablet. The GIS APIs mentioned above usually have versions for mobile devices, as well as for browsers. Programmers have taken advantage of these mobile APIs, along with freely available map data from the cloud, to create apps that seamlessly embed maps into the user experience. By using a smartphone’s ability to pinpoint your current latitude and longitude, these apps can create personalized maps based on your actual location.

    A search in the Apple AppStore for “map” returns thousands of apps with map components. Some of these apps put maps front-and-center for traditional navigation, whether by car (Waze, MapQuest, Google), public transit (New York Subway MTA Map, London Tube Map), or on foot (Runkeeper, Map My Run, AllTrails). Other apps use maps in a supporting role to allow users to find nearby places; for example, banking apps usually have a map to show branches near your current location.

    What’s really exciting are the apps that allow users to enter data themselves via a map interface. For example, HealthMap’s Outbreaks Near Me not only shows reports of disease outbreaks near your location, but it also lets you enter unreported incidents. The GasBuddy app shows the latest gasoline prices and lets you enter in current prices. This “crowdsourcing” feature keeps an app up-to-date by letting its users update the map with the latest conditions as they are happening.

    The Outbreaks Near Me app for phones (left) and the GasBuddy app for tablets (right)

    The Outbreaks Near Me app for phones (left) and the GasBuddy app for tablets (right)

    Here at Locus Technologies, we use the power of GIS in our Locus Mobile app for field data collection. Users can enter environmental data, such as temperature or pH measurements from a monitoring well, and upload the data back to the EIM cloud for later review and analysis. The Locus Mobile app includes a map interface for navigating to data collection points and tracking visited locations. The app also lets users create new data collection points “on the fly” simply by clicking on the map.

    Locus Mobile map interface

    The map interface in the Locus Mobile app; blue dotted circles indicate locations that are not yet started.

    Looking to the future

    Where will GIS go from here? It’s possible that augmented reality, virtual reality, and 3D visualization will continue to expand and become as ubiquitous as the current “2D” maps on browsers and phones. Also, the “internet of things” will surely have a GIS component because every physical “thing” can be tied to a geographical location. Similarly, GIS can play an important role in “big data” by providing the spatial framework for analysis. It will be interesting to see where GIS is when we celebrate the 20th GIS Day in 2019!

    Thanks to the GIS Timeline for providing some of the history for this article.


    Locus employee Todd PierceAbout guest blogger— Dr. Todd Pierce, Locus Technologies

    Dr. Pierce manages a team of programmers tasked with development and implementation of Locus’ EIM application, which lets users manage their environmental data in the cloud using Software-as-a-Service technology. Dr. Pierce is also directly responsible for research and development of Locus’ GIS (geographic information systems) and visualization tools for mapping analytical and subsurface data. Dr. Pierce earned his GIS Professional (GISP) certification in 2010.


    [jwplayer mediaid=”16590″]

    Interested in Locus’ GIS solutions?

    Introducing Locus GIS+. All the functionality you love in EIM’s classic Google Maps GIS for environmental management— now integrated with the powerful cartography, interoperability, & smart-mapping features of Esri’s ArcGIS platform!

    Learn more about GIS+


    There is a considerable degree of (intended) confusion in the EHS software space when it comes to multi-tenancy.  Companies that are considering Software-as-a-Service (SaaS) hear all sorts of things from EHS software vendors hoping to tap into the momentum of cloud computing.  Among the most common is that multi-tenancy is a “techie” thing that doesn’t need to be part of the conversation.  Many go as far as saying “sure, we can do multi-tenant, single-tenant, whatever you need!”— anything to win the job.

    Unfortunately, those vendors simply do not understand what they are talking about.  Multi-tenancy is a major shift in computing and requires all new approach to software architecture and delivery model.  It is transformational, and customers who intend to buy the next generation of EHS software should spend the time to understand differences.

    Multi-tenancy is the core foundation of modern SaaS and shouldn’t be taken lightly, generalized, or massaged into something that suits a vendor’s self-serving interpretation of SaaS.  Having experienced first-hand the true benefits of multi-tenant SaaS, I can’t conceptualize how SaaS would have delivered those benefits if it wasn’t multi-tenant.  Can anyone imagine companies like Salesforce, NetSuite, Google, or Amazon offering a “single-tenant” solution side by side to their multi-tenant clouds?  I will go as far as say that any company offering a single-tenant solution cannot be a serious contender in offering multi-tenant SaaS.

    I would also add that single-tenant (hybrid) cloud applications are worse than on-premise installment.  Why?  Because they are fake clouds.  In these instances, a customer is, in fact, outsourcing maintenance of their application to a vendor that is not equipped for that maintenance.  No single vendor in the EHS software industry is large enough to undertake maintenance of the single-tenant infrastructure on behalf of their customers, regardless how inexpensive hardware may be.

    There are many ways to take the functions of on-premise installed software model of the 1980s and package them as services.  Some of these service delivery modes– such as ASP, single-tenant hosting, and hybrid clouds– merely relocate and reassign long-standing problems and potentially make them worse.  In a single-tenant model, user customizations may infiltrate throughout the stack, in a way that makes it difficult to upgrade the performance of the stack.  The true SaaS models confront and mitigate– or even eliminate– some of the most vexing elements of software installation and maintenance: configurability on the fly, software maintenance, and upgrades.  It is “a tyranny of software upgrades” that kills the single-tenant model.

    Let me offer a simple analogy to drive home the point as to why multi-tenancy matters: Tesla vs. Edison– War of Currents.

    The War of Currents was a series of events surrounding the introduction of competing electric power transmission systems in the late 1880s and early 1890s that pitted companies against one another and involved a debate over cost and convenience of electricity generation and distribution systems, electrical safety, and a media/propaganda campaign, with the main players being the direct current (DC) based on the Thomas Edison Electric Light Company and the supporters of alternating current (AC) based on Nikola Tesla’s inventions backed by Westinghouse.

    With electricity supplies in their infancy, much depended on choosing the right technology to power homes and businesses across the country.  The Edison-led group argued for DC current that required a power generating station every few city blocks (single-tenant model), whereas the AC group advocated for a centralized generation with transmission lines that could move electricity great distances with minimal loss (multi-tenant model).

    The lower cost of AC power distribution and fewer generating stations eventually prevailed.  Multi-tenancy is equivalent of AC when it comes to cost, convenience, and network effect.  You can read more about how this analogy relates to SaaS in the book by Nicholas Carr, “Big Switch,” a Wall Street Journal bestseller. It’s “the best read so far about the significance of the shift to cloud computing,” said Financial Times.  The EHS software industry has been a laggard in adopting multi-tenancy.

    Given these fundamental differences between different modes of delivering software as a service, it is clear that the future lies with the multi-tenant model.

    Whether all customer data is put onto one database or onto multiple databases is of no consequence to the customer.  For those arguing against it, it is like an assertion that companies “do not want to put all their money into the same bank account as their competitors,” when what those companies are doing is putting their money into different accounts at the same bank.

    When customers of a financial institution share what does not need to be partitioned—for example, the transactional logic and the database maintenance tools, security, and physical infrastructure and insurance offered by a major financial institution—then they enjoy advantages of security, capacity, consistency, and reliability that would not be affordably deliverable in isolated parallel systems.

    In enterprise cloud applications and cloud application platforms, multi-tenancy yields a compelling the combination of efficiency and capability without sacrificing flexibility or governance.

    When a software provider seeks to blur the distinctions between one technology and another, there’s usually just one reason: because they are unable to offer the superior technology to their customers, and hope to persuade their customers that real differences are not relevant to their needs.  Multi-tenant platforms for enterprise on-demand applications represent genuine opportunities for customer advantage.  The reality of multi-tenant differentiation is acknowledged by authoritative industry analysts such as Gartner, whose March 2007 announcement1 of its Outsourcing Summit that month included this definition of Software as a Service:

    “Hosted software based on a single set of common code and data definitions that are consumed in a one-to-many model.”

    In other words, hosting models that do not offer the leverage of multi-tenancy don’t belong in the same discussion as the value proposition implied by the term, “SaaS”.  Multi-tenancy is a difference that makes a difference.

    References

    1Gartner Inc., “SaaS will have significant impact on IT services and outsourcing providers,” Tekrati, 7 March 2007

    A recently published survey by a research analyst firm indicates that 90 percent of EHS software applications installed today are single-tenant on customer premises or single-tenant, vendor hosted.  Only 10 percent are multitenant, vendor-hosted. In other words, most of the vendors in the EH&S space do not run a single version of their software maintained at one location. Instead, they run multiple copies at a single or multiple locations, with the high likelihood that these multiple copies are not alike, but instead represent multiple versions or contain specific customizations for individual customers. This model is crushing their growth and scalability potential.

    Locus delivers EHS+S SaaS solutions as highly scalable, Software as a Service (SaaS) application and platform services on a multitenant technology architecture. Multitenancy is an architectural approach that allows Locus to operate a single application instance for multiple organizations, treating all customers as separate tenants who run in virtual isolation from each other. Customers can use and customize an application as though they each have a separate instance, yet their data and customizations remain secure and insulated from the activities of all other tenants. Locus multitenant services run on a single stack of hardware and software, which is comprised of commercially available hardware and a  combination of proprietary and commercially available software. As a result, Locus can spread the cost of delivering EHS SaaS services across user base, which lowers the cost for each customer. Also, because Locus does not have to manage thousands of distinct applications with their business logic and database schemas, we believe that we can scale our business faster than traditional software vendors. Moreover, we can focus our resources on building new functionality to deliver to customer base as a whole rather than on maintaining an infrastructure to support each of their distinct applications.

    Multitenancy also allows for faster bug and security fixes, automatic software updates and the ability to deploy major releases and frequent, incremental improvements to Locus’ services, benefiting the entire user community. Our services are optimized to run on specific databases and operating systems using the tools and platforms best suited to serve customers rather than on-premise software that must be written to the different hardware, operating systems and database platforms existing within a customer’s unique systems environment. Locus developers build and support solutions and features on a single code base on our chosen technology platform. Locus efforts are focused on improving and enhancing the features, functionality, performance, availability and security of existing service offerings as well as developing new features, functionality, and services.

    Locus customers and third-party developers can create apps rapidly because of the ease of use of Locus Platform and the benefits of a multitenant platform. Locus provides the capability for business users to configure applications easily to suit their specific needs.

    Also, Locus multitenant cloud platform makes it possible to use a remarkably small number of servers as efficiently as possible. When organizations move business applications to Locus, they can significantly reduce their energy use and carbon footprints compared to traditional on-premises or single-tenant or ASP solutions

    Locus built and maintains a multitenant application architecture that has been designed to enable service to scale securely, reliably and cost effectively. Locus’ multitenant application architecture maintains the integrity and separation of customer data while still permitting all customers to use the same application functionality simultaneously.

    Both Locus and its data centers providers hold independent  AICPA SOC1 (SSAE16)  and SOC2 certification.

    As an environmental software and services company, we work closely with companies that need to follow Federal, State and Local compliance mandates to ensure the status quo of the environment.  One market segment that always amazes me is drinking water. Every single day, public water systems test your tap water.

    Everyday single day, water is collected, tested, analyzed and reported to internal public water teams, and less frequently, external agencies.   Today we announced that San Jose Water Company, that serves more than one million people in the Silicon Valley region, has selected Locus for our environmental software and mobile app solution, EIM and Locus Mobile.  The deployed systems consolidates and manages San Jose Water’s field data collection; water compliance and water quality data; and all its environmental compliance and environmental data.  SJWC will also use the Locus EIM to manage its environmental permits for all its sites and facilities.

    Want to learn more about water?  Check out these resources:

    ​View the 6-minute TedTalk “It’s time to put water first” by Heather Himmelberger from the University of New Mexico, Director of the Southwest Environmental Finance Center at the University of New Mexico.

    For more information, please visit www.drinktap.org.


    Through the Locus EIM platform public facing website, Intellus, the general public can now access remediation and environmental data records associated with the Office of Environmental Management’s (EM’s) legacy nuclear cleanup program.

    Containing more than 14 million records, Locus’ Intellus has consolidated Los Alamos National Laboratory’s (LANL’s) information that was previously handled in multiple independent databases. The centralized, cloud-based solution directly attributed to an estimated $15 million in cost savings for LANL through 2015.

    The public facing site also ensures users have real-time access to the most recent data. The same data that scientists and analysts use to base important environmental stewardship decisions off of. Through tools and capabilities such as automated electronic data validation, interactive maps, and the ability to include data from other third-party providers and environmental programs, Intellus provides the ultimate platform to view LANL’s environmental data without compromising the core EIM system that LANL scientists use on a daily basis.

    Locus has always advocated for the power of data transparency via the cloud. When you apply the most extensive security protocols to a cloud-based system, it can be a winning combination for data management and public trust.

    There is considerable debate in the marketplace about whether organizations should know or even care about multi-tenancy. The truth is that multi-tenancy is the only proven SaaS delivery architecture that eliminates many of the problems created by the traditional software licensing and upgrade model, so it is extremely valuable to know whether a provider uses a multi-tenant architecture. A provider should be able to answer this question with a simple “yes” or “no,” and prove its answer.

    Multi-tenancy ensures that every customer is on the same version of the software. As a result, no customer is left behind when the software is updated to include new features and innovations. A single software version also creates an unprecedented sense of community where customers and partners share knowledge, resources, and learning. Smart managers work with their peers and learn from them and what they are doing. Multi-tenancy offers distinct cost benefits over traditional, single-tenant software hosting. A multi-tenant SaaS provider’s resources are focused on maintaining a single, current version of the application, rather than spread out in an attempt to support multiple software versions for customers. If a provider isn’t using multi-tenancy, it may be hosting thousands of single-tenant customer implementations. Trying to maintain that is too costly for the vendor, and those costs, sooner or later, become the customers’ costs.

    Multi-tenancy requires a new architectural approach. You have to develop applications from the ground up for multi-tenancy; otherwise, extensive work is required of the vendor to alter the on-premises application and underlying database for multi-tenancy, resulting in an even more complex, and potentially high-maintenance, application.

    Tag Archive for: Cloud Computing

    Locus looks back on the last 25 years of pioneering EHS, ESG, and water quality software.

    MOUNTAIN VIEW, Calif., 11 April 2022Locus Technologies, the leading EHS Compliance and ESG software provider, today celebrates the 25th anniversary of its founding, and with it, a quarter-century of customer success. Locus looks back on its founding as a Silicon Valley leader in EHS & ESG software with pride in its leadership through expertise, stability, and innovation. 

    Locus was founded in 1997 with a revolutionary vision that set the framework for what is now widely known as environmental, social, and corporate governance (ESG) and environmental, health, and safety (EHS). Locus envisioned a simplified and data-driven approach, offering software in the cloud, on mobile devices, and as a service. The company pioneered SaaS (Software as a Service) model in EHS, ESG, and water quality management spaces in 1999 and never installed its software on customers’ premises. 

    Over 25 years, Locus has pioneered cloud environmental solutions, online and mobile GIS (Geographic Information System) services, has revolutionized environmental information management, and AI and IoT technologies for organizations ranging from Fortune 500 companies to forward-facing municipalities and the US Government. 

    Locus recently broke new ground by releasing the first Visual Calculation Engine for ESG Reporting. Locus’s visual calculation engine helps companies quickly set up and view their entire ESG data collection and reporting program, enabling full transparency and financial-grade auditability throughout the entire process. 

    As the industry continues to evolve, competitors merge and disappear. New markets emerge and grow. Locus remains a constant in the environmental space, an innovative and independent pioneer. 

    “For 25 years now, Locus has brought together industry-leading experts in EHS, sustainability, and technology. Although regulations and requirements have changed over the years, that combination remains at the core of what Locus does, as demonstrated by our stability and long-term customer partners. We look forward to continuing our path of growth using those same values for the next 25 years.” said Wes Hawthorne, Locus President.  

    Locus Founder and CEO, Neno Duplan is proud to look back on the growth of Locus over the last 25 years. He said, “Locus did not start in the clouds, but back in 1997, we had a rather good view. Locus’s vision for better global environmental stewardship has not changed since its inception. We focus on empowering organizations to track better and mitigate the environmental impact of their activities. That vision has come to fruition through the Locus software services used by some of the world’s largest companies and government organizations. Locus’ SaaS has been ahead of the curve in helping private and public organizations in not only managing their water quality, EHS compliance or ESG reporting but also turning their environmental information into a competitive advantage in their operating models.”