WM Symposia 2018 provided an excellent showcase for Locus GIS+ in LANL’s Intellus website
At the annual WM Symposia, representatives from many different DOE sites and contractors gather once a year and discuss cross-cutting technologies and approaches for managing the legacy waste from the DOE complex. This year, Locus’ customer Los Alamos National Laboratory (LANL) was the featured laboratory. During their presentation, they discussed Locus GIS+, which powers Intellus, their public-facing environmental monitoring database website.
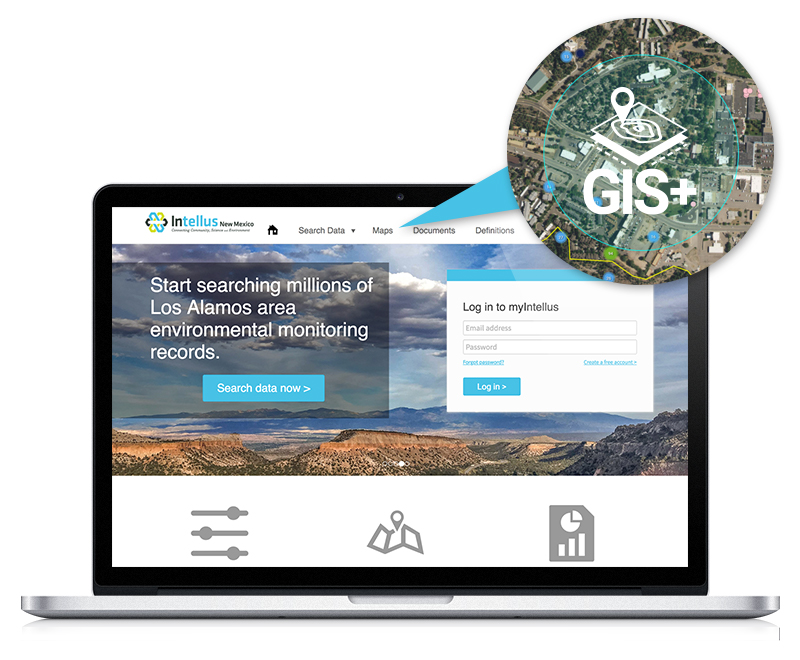
If you haven’t been to LANL’s Intellus website recently, you are in for a surprise! It was recently updated to better support casual users, and it features some of the best new tools Locus has to offer. Locus reimagined the basic query engine and created a new “Quick search” to streamline data retrieval for casual users. The guided “Quick search” simplifies data queries by stepping you through the filter selections for data sources, locations, dates, and parameters, providing context support at each step along the way.
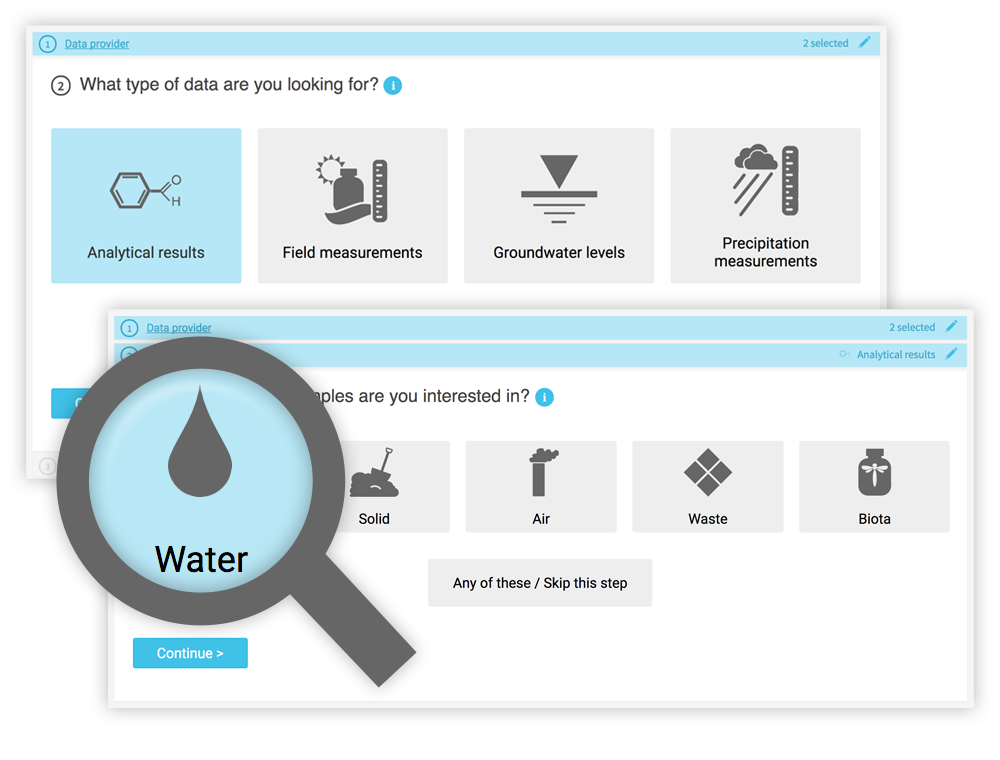 While a knowledgeable environmental scientist may be able to easily navigate a highly technical system, that same operation is bound to be far more difficult for a layperson interested in what chemicals are in their water. Constructing the right query is not as simple as looking for a chemical in water—it really matters what type of water you want to look within. On the Intellus website (showing the environmental data from the LANL site), there are 16 different types of water (not including “water levels”). Using the latest web technologies and our domain expertise, Locus created a much easier way to get to the data of interest.
Just querying data is not necessarily the most intuitive activity to gain insights. Locus integrated our new GIS+ visualization engine to allow users to instantly see all the data they just queried in detailed, context-rich maps.
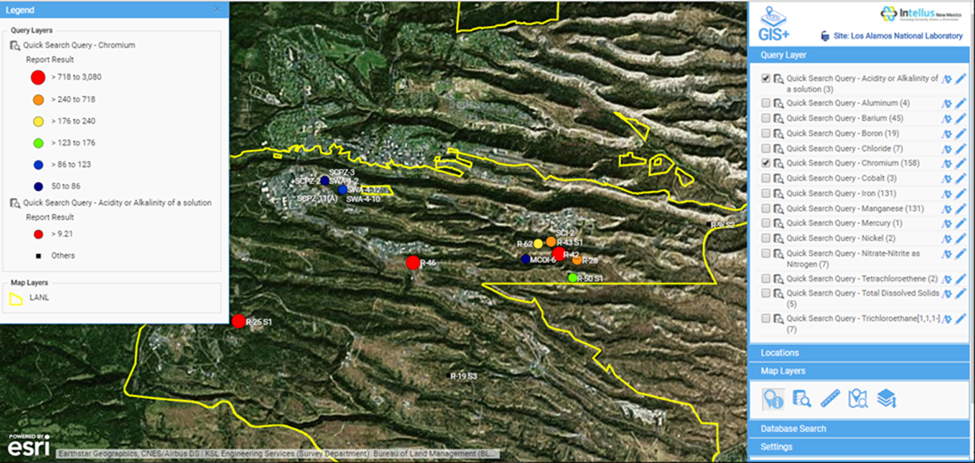
Intellus GIS+ map showing “Quick search” query results for chromium levels in the LANL area
Instead of a dense data grid, GIS+ gives users an instant visual representation of the issue, enabling them to quickly spot the source of the chemicals and review the data in the context of the environmental locations and site activities. Most importantly for Intellus users, this type of detailed map requires no GIS expertise and is automatically created based on your query. This directly supports Intellus’ mission to provide transparency into LANL’s environmental monitoring and sampling activities.
GIS+ also allows users (albeit with a bit more experience in GIS mapping) to integrate maps from a wide range of online sources to provide even more insight to the available data. In the example below, we overlaid the publicly-available US Fish and Wildlife critical habitat maps with data from the LANL site to show the relationship of the site to critical habitats. This type of sophisticated analysis is the future of online GIS. Locus takes full advantage of these opportunities to visualize and integrate data from varying sources with our GIS+ tools, made simple for users and integrated with ArcGIS Online by Esri.
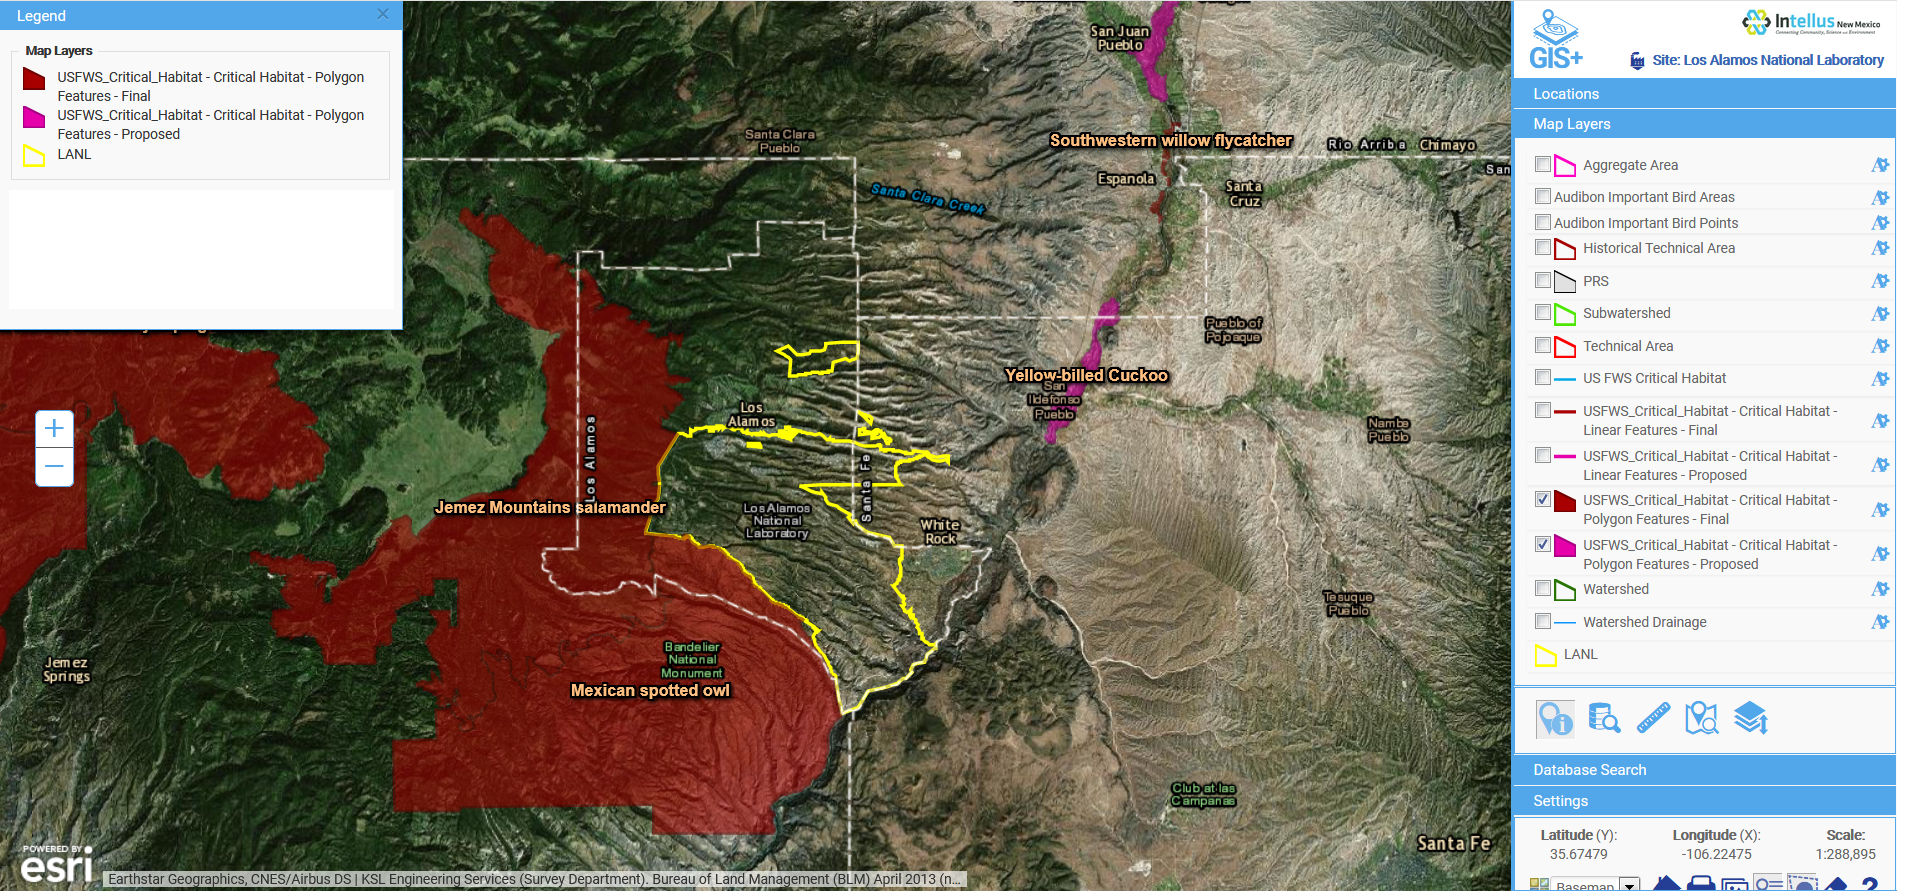
Intellus GIS+ map showing imported layers of US Fish and Wildlife critical habitats in relation to LANL environmental sampling data

Overall, Locus is very proud of our cross-cutting environmental information management tools. We were one of many WM18 attendees enjoying LANL’s presentation and getting even more ideas from the audience on the next steps for better environmental visualization.
[sc_button link=”https://www.locustec.com/wp-content/uploads/2018/03/WM-18-PPT.pdf” text=”View a copy of the presentation” link_target=”_blank” color=”ffffff” background_color=”52a6ea”]


Leave a Reply
Want to join the discussion?Feel free to contribute!