Taking your environmental data to the next level with advanced integrated GIS features
In our last GIS blog, we covered some tips for choosing an integrated GIS/environmental data management system. Now let’s look at some more advanced features that may be appealing to a wide range of data managers and facility owners.
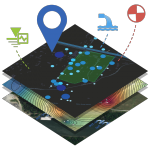
1) Look for ways to integrate GIS base maps from other sources—so you can easily add piping diagrams, facility building layouts, or watersheds and drainage.
A map is much more meaningful with your facility information. Google maps are great, but they won’t show your current building layout and your pipe and sewer diagrams. So look for the capability to display maps created by other internal departments, like facilities or operations, so you can gain more insights from your data and have information readily available to share with other parts of the company who may disturb the area with digging or construction activity.
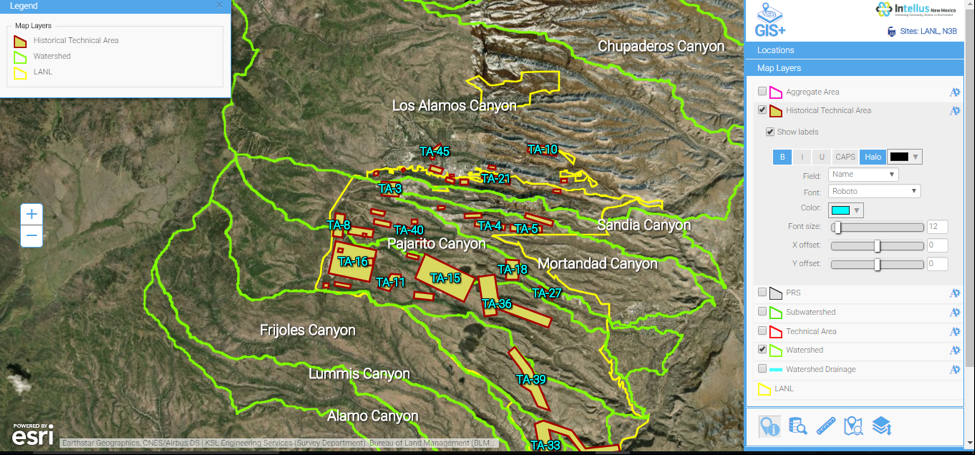
In this example from the Intellus website, environmental data can be visualized in relation to historical buildings and watersheds, both elements created by internal mapping departments. Internal base maps can also replace default maps from Esri or Google.
2) Load in other data from the Esri cloud to leverage a wide range of available data for your facility and use it with your GIS+ layers.
With the right GIS solution, it’s easy to bring in data from any public source, including government agencies, such as EPA. Combining your map with the world of online data can bring fresh insights to your environmental compliance challenges.
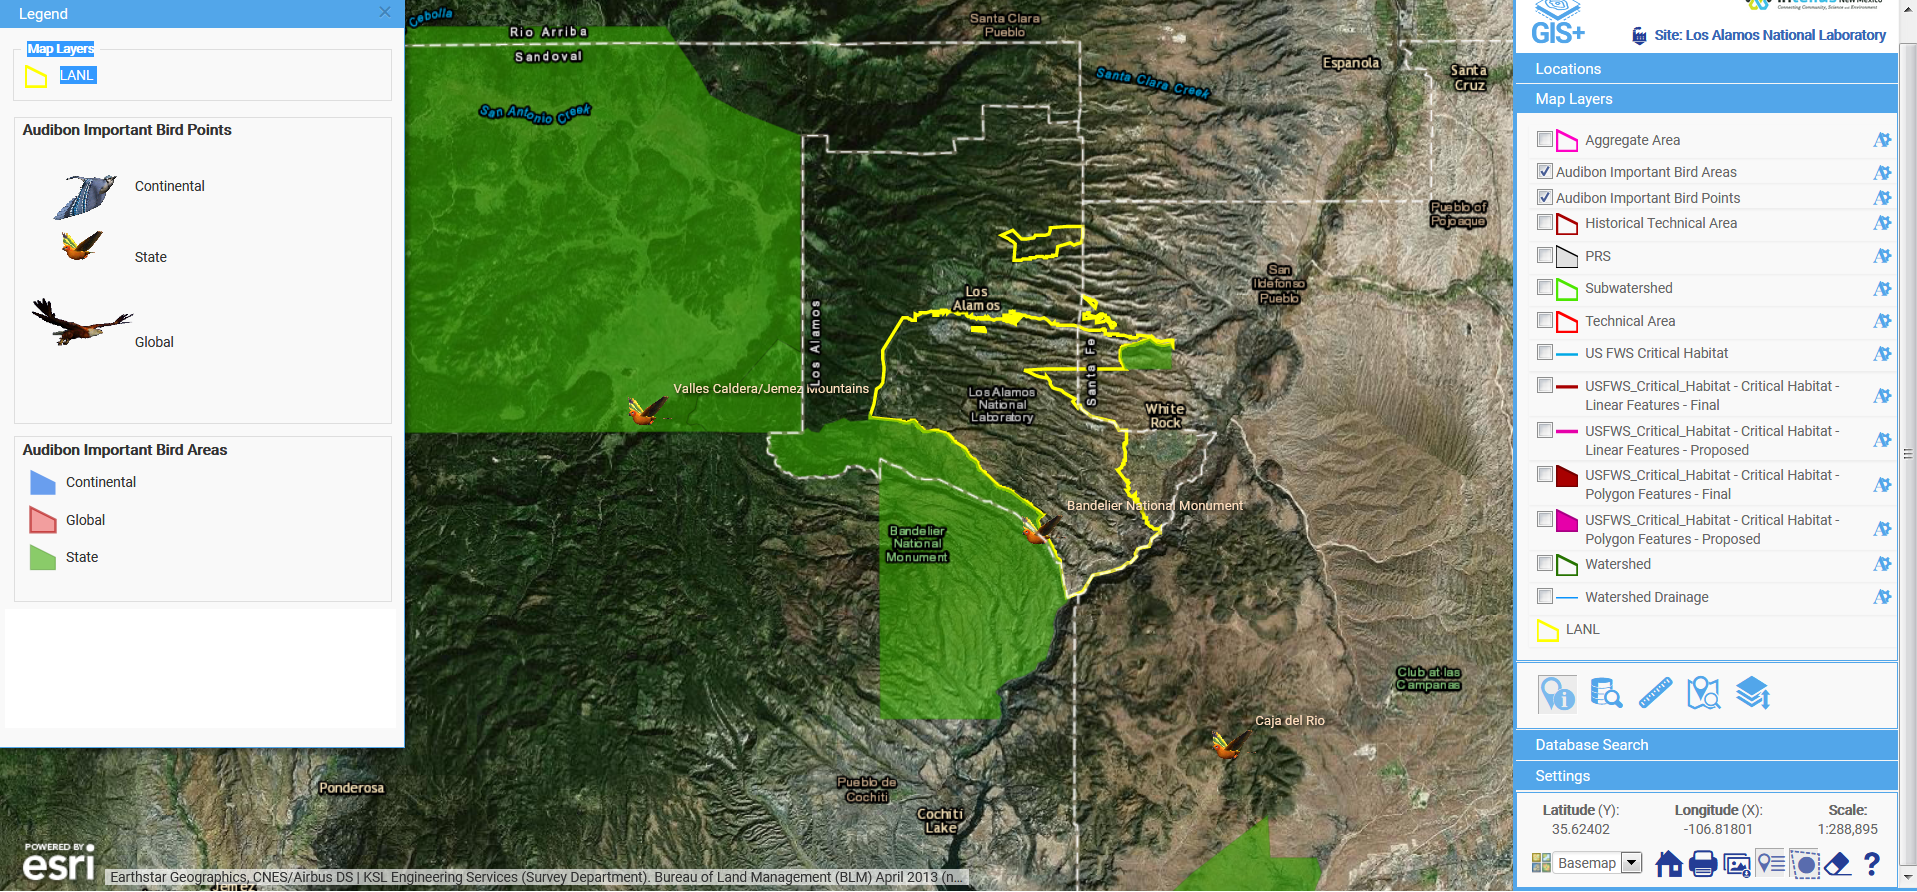
In this example, GIS is used to merge Audubon bird points with Los Alamos National Laboratory (using the Intellus website).
3) Add reference information, such as photos and reports, to locations, and access them from the map.
Using a freeform polygon search (another must-have in a GIS tool), users can highlight an area and—with a single click—see all the data, field photos, and reports associated with that area. This is especially useful for active facilities where activities are planned in areas with legacy contamination (“know before you dig!”). This type of functionality makes it simple for less savvy map users to easily get the information they need.
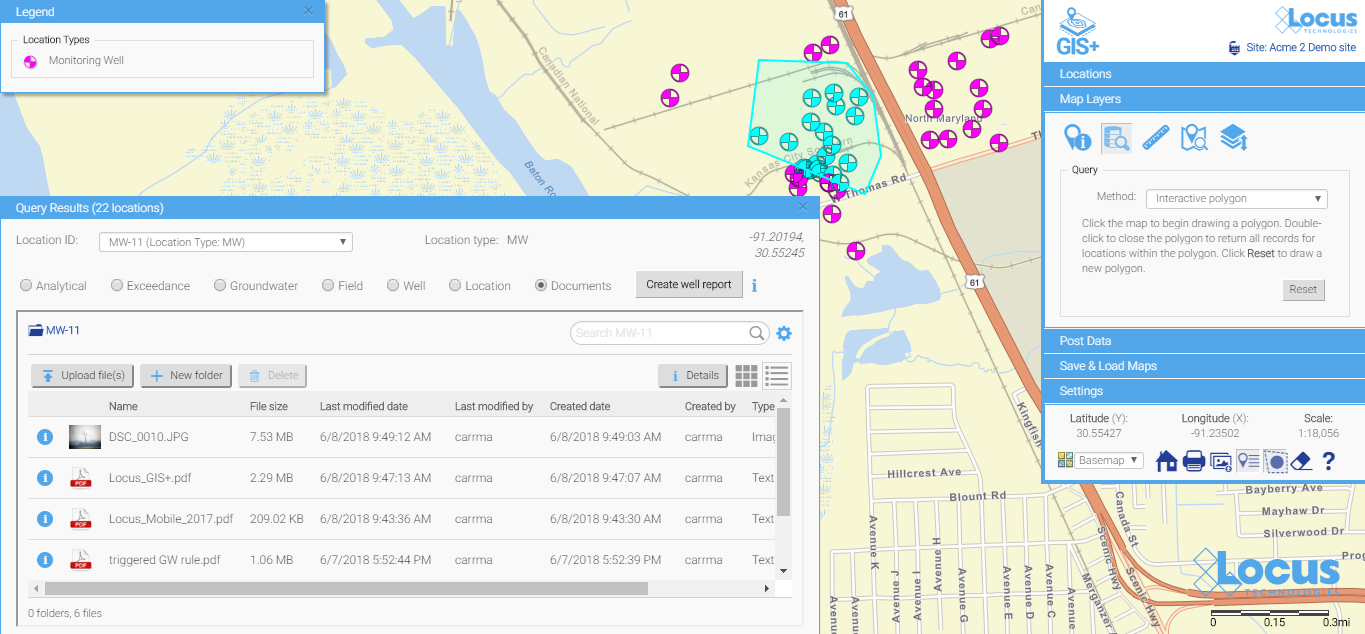
In this example, a polygon tool was used to highlight an area, and all data, documents, reports associated with ALL locations within the selected area are available from the map. These functions let facility staff review key environmental information before conducting activities at a facility location.
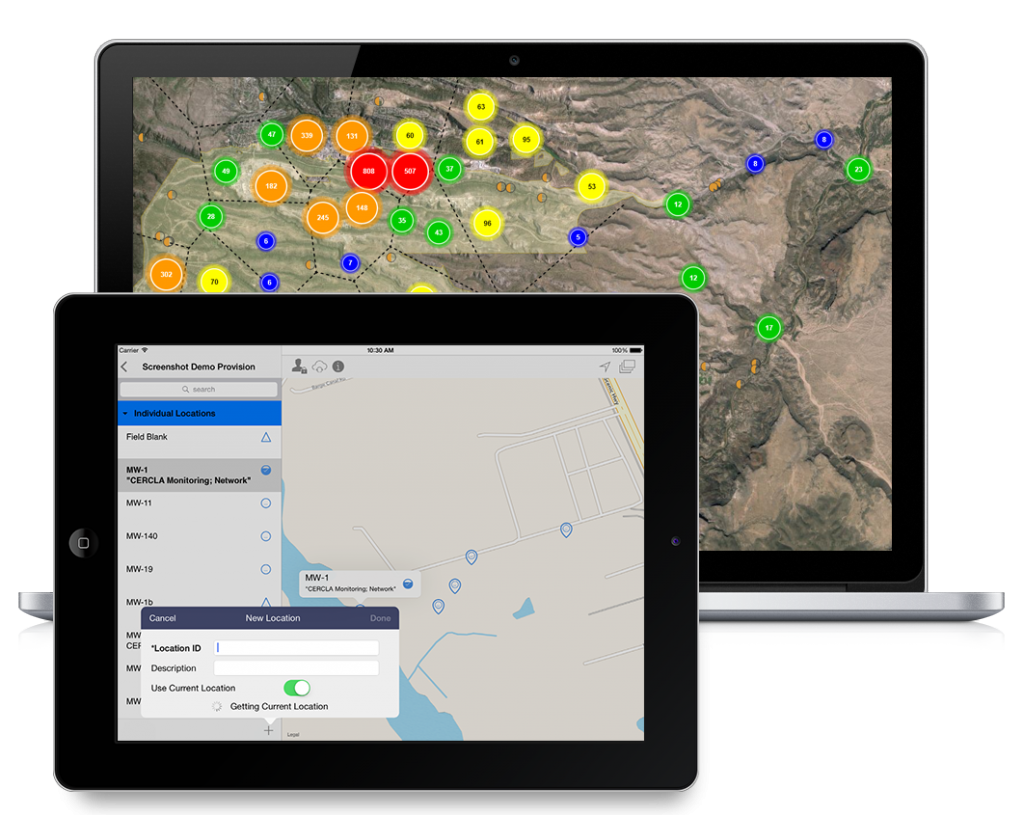
4) Better understand complex and dense maps with clustered locations.
Some facilities or sites have very dense sampling locations that can be a challenge to view on maps due to overlapping data points. Using the concept of clustering, one can more easily view the dense data, with results color-coded to help focus the review. Clicking on the cluster reveals the details underneath for more close review.
In this example, tritium in monitoring wells at the Los Alamos site in New Mexico is being reviewed on the map. Without clustering, the map is impossible to read or use effectively. With clustering, the orange circles (“clusters”) indicate higher concentrations of the contaminant, and clicking on the cluster reveals the individual data points it contains.
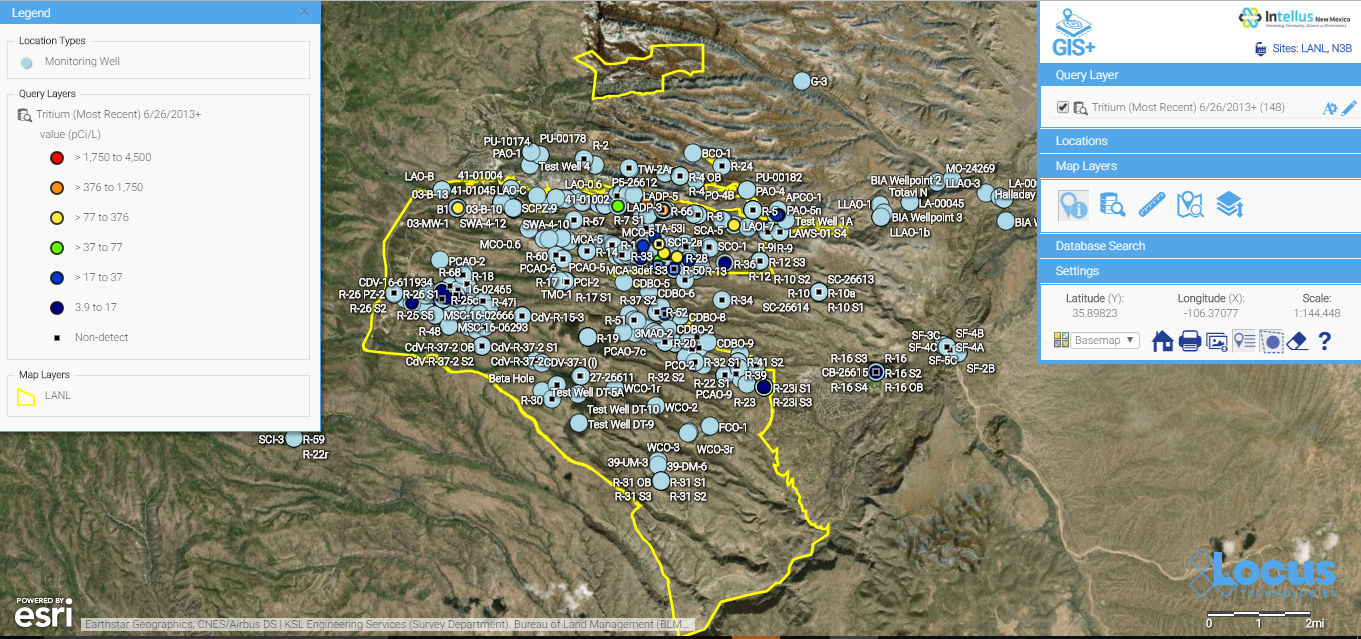
Before clustering is applied, we have a very difficult-to-read map.
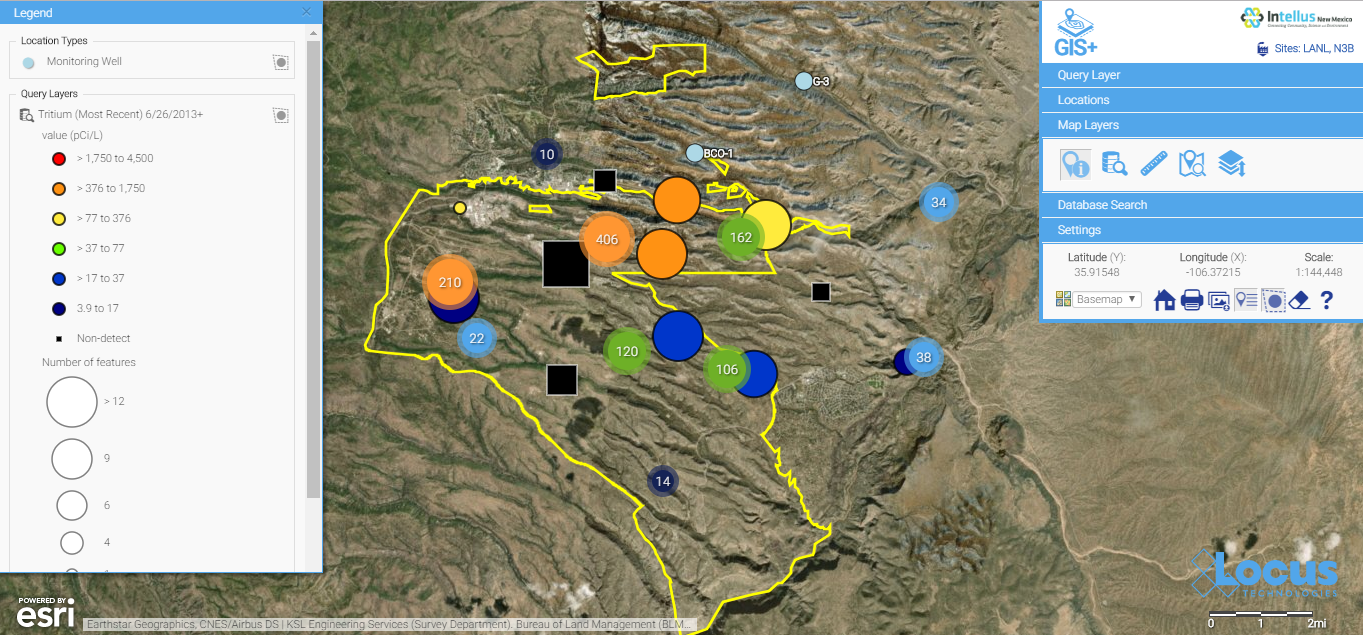
After clustering is applied, the map is much more useful—colors focus the user on the higher concentration areas.
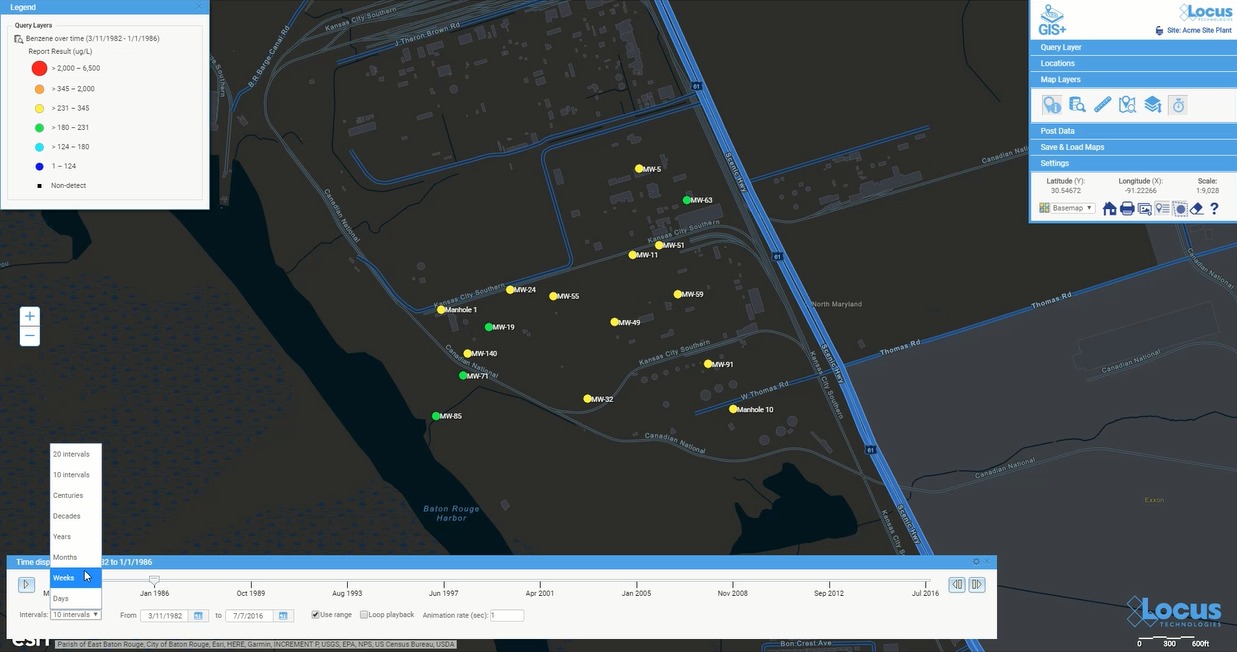
5) Watch trends or changes over time with time layers.
Imagine being able to watch changes in data over time with a simple slider control. An integrated GIS can provide that clarity over all the data in your database, so you can watch the progress of a cleanup, track chemicals in your water distribution system, or watch a groundwater plume move over time.
6) Search for sampling results near a given address or within a given distance from selected map features.
For sites with concerned neighbors, it’s key to know what chemicals or other environmental conditions may be affecting them. With GIS tools, it’s easy to put in an address and see what is within a radius, or to look within a distance from a specific location. In this example, you can see that there are no sampling locations within a 2000-ft radius from the center point. You can also type in an address and see what is nearby.
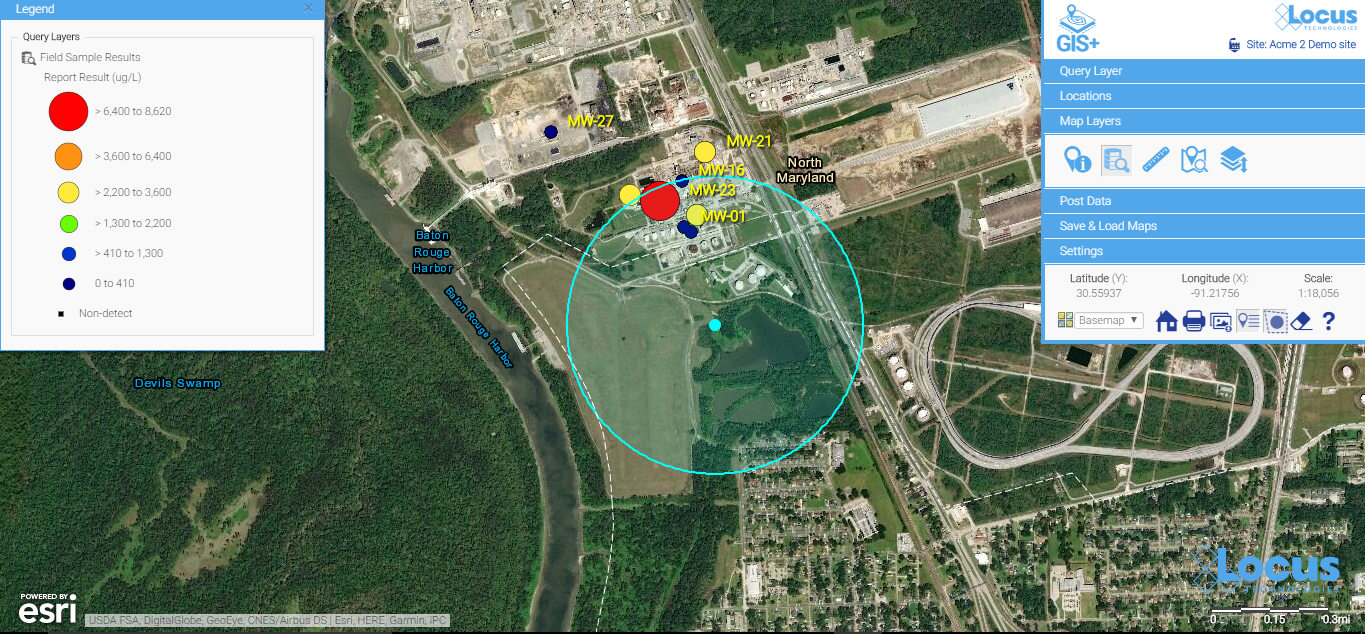
Looking at a 2000-ft radius from a location to see what is nearby.
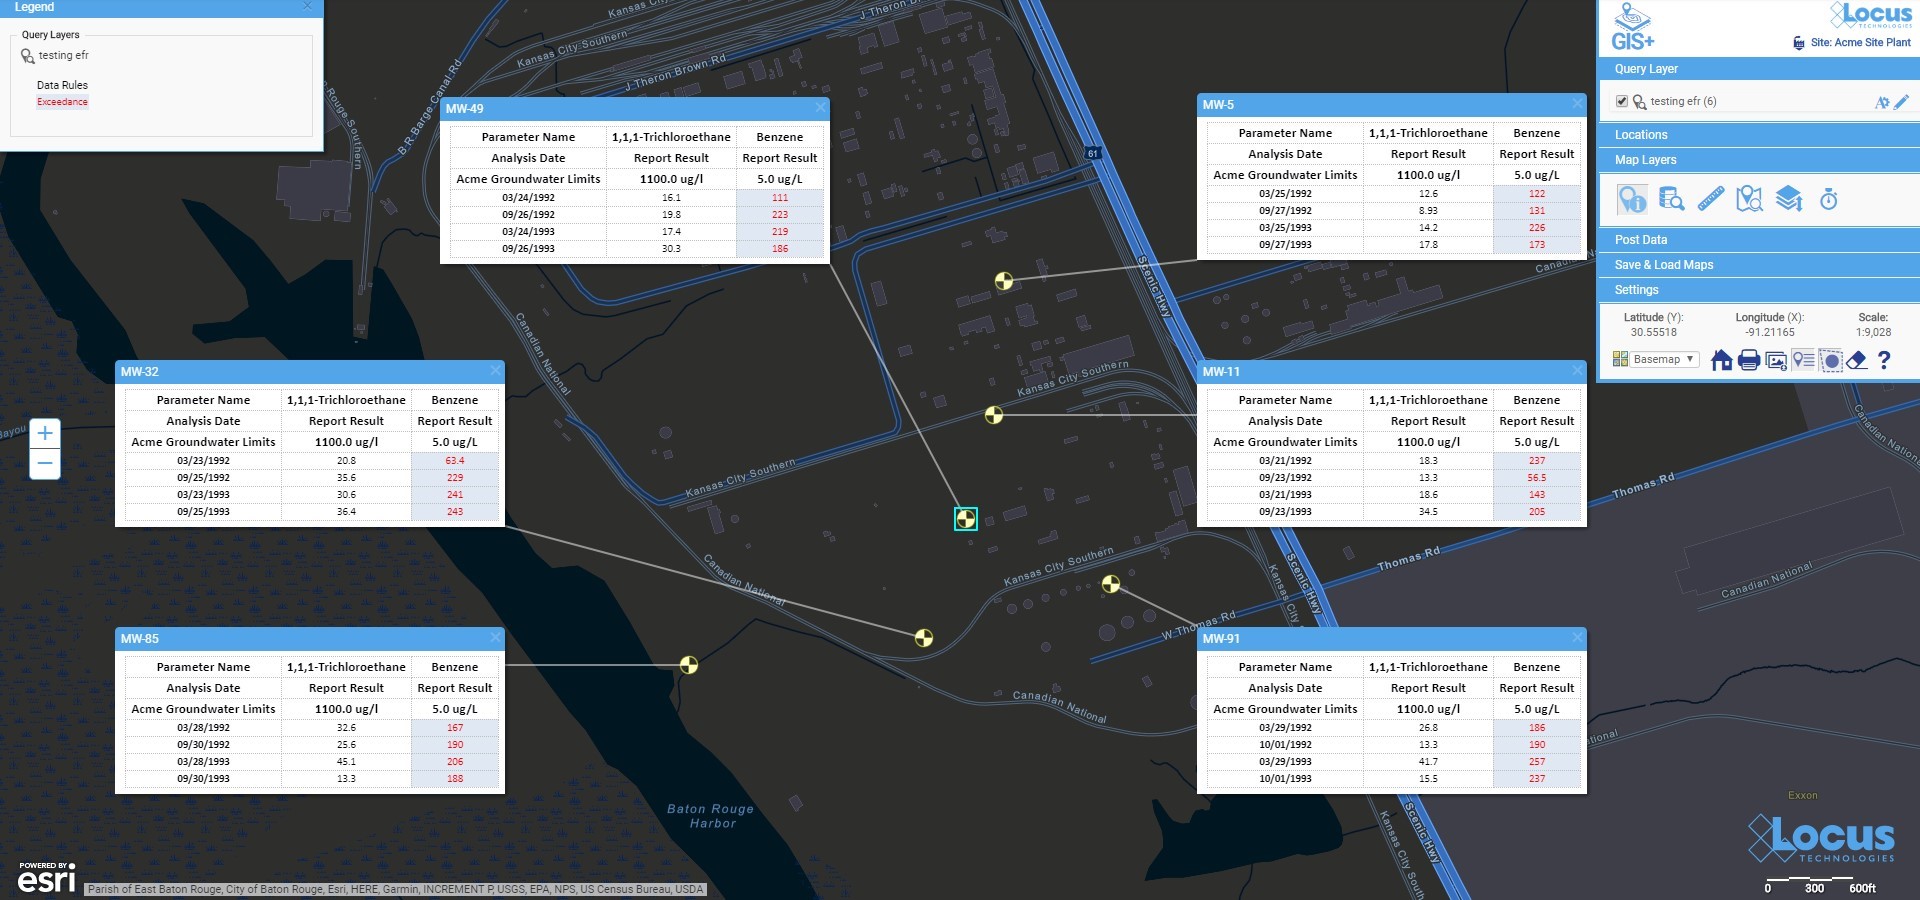
7) Turn data into insights with data callouts.
The more information you can provide to users in a format that highlights results in a meaningful way, the more you can help streamline review and analysis for any data review effort. GIS tools that support data callouts (with logic to highlight actionable results) can quickly convert a mass of data into a clear picture of the issues at a facility or site.
In the map below, data summaries are presented on a facility map to show areas with results above an action limit and associated with other detected parameters. Reviewers can easily see the exceedances (in red) and pinpoint where the issues lie. Although these maps may look complicated to produce, they can be integrated with standard reporting tools that generate maps at the click of a button.
Intrigued by the possibilities?
When you’re evaluating an integrated GIS solution, make sure to dig deeper than the obvious necessary features to learn about all the advanced functionality that is available or on the product roadmap. The best solutions will already have some truly powerful capabilities available, with an even longer list of upcoming features.
Your environmental information management will evolve to the next level when you have the flexibility of visualizing your data in so many ways. Happy mapping!
 See your data in new ways with Locus GIS for environmental management.
Locus offers integrated GIS/environmental data management solutions for organizations in many industries.
Find out more >
Get a demo of Locus GIS
Error: Contact form not found.