Getting More from your Environmental Data using Dashboards with Integrated Mapping

Today is GIS Day, a day started in 1999 to showcase the many uses of geographical information systems (GIS). Earlier Locus blog posts have explained how GIS and maps support visualization of objects in space and over time. This post covers a specific visualization method called data dashboards.  

A data dashboard is a combination of charts, maps, text, and images that enables analysis of data and thereby promotes discovery of previously unknown relationships in the data. Companies and organizations use dashboards to develop insight into the overall status of a company or of a company division, process, or product line. Dashboards are also a common function in ‘business intelligence’ applications such as Microsoft Power BI and Tableau. A printed dashboard is static, but an online dashboard can be dynamic; in a dynamic dashboard, interacting with one item on the dashboard causes the other items to update. Taken together, the visualizations on a dynamic dashboard can help you find the story in your data. 

One reason dashboards are so helpful is that they allow humans to partially ‘offload’ their thinking. Cognitive research has shown that human ‘working memory’ handles at most four items at a time. A good visualization, however, reduces the number of items to process in memory. 

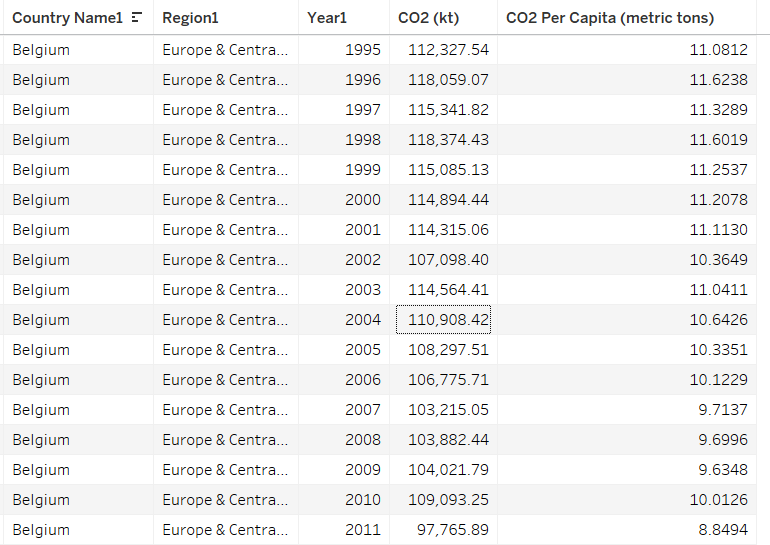
Consider a large table of carbon dioxide emissions by country for multiple years; it can be difficult to keep all the numbers in mind if you are trying to find trends.

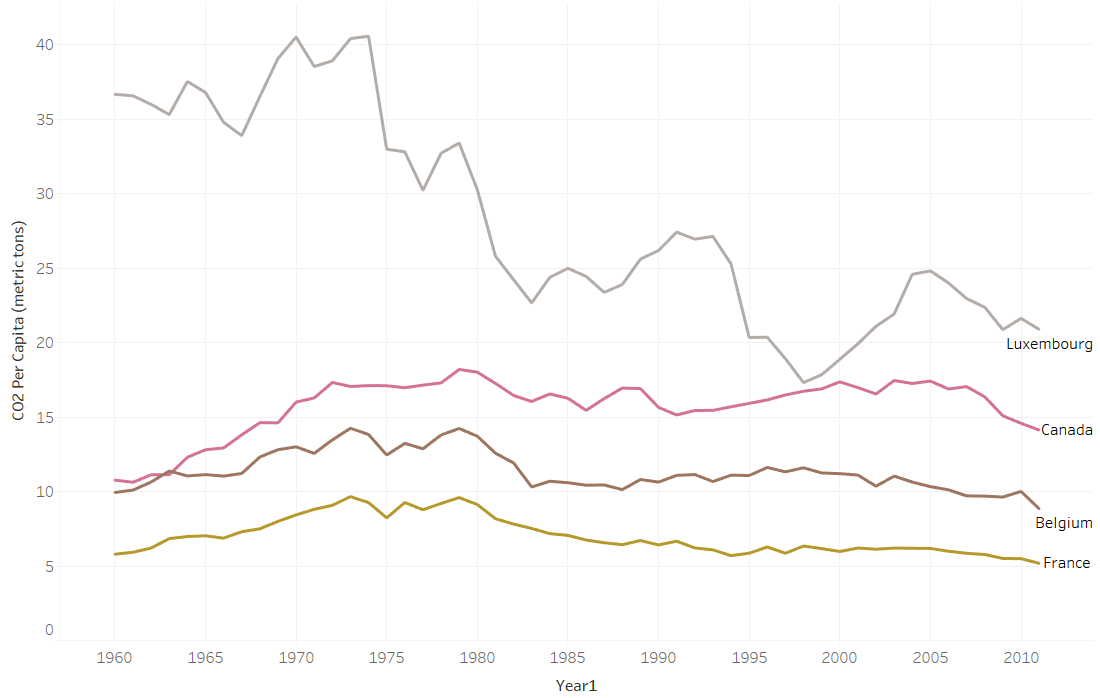
If you plot the data in a graph, however, each series of data in the chart becomes just one line on the graph. It is much easier to compare lines on the chart than to compare columns of numbers.

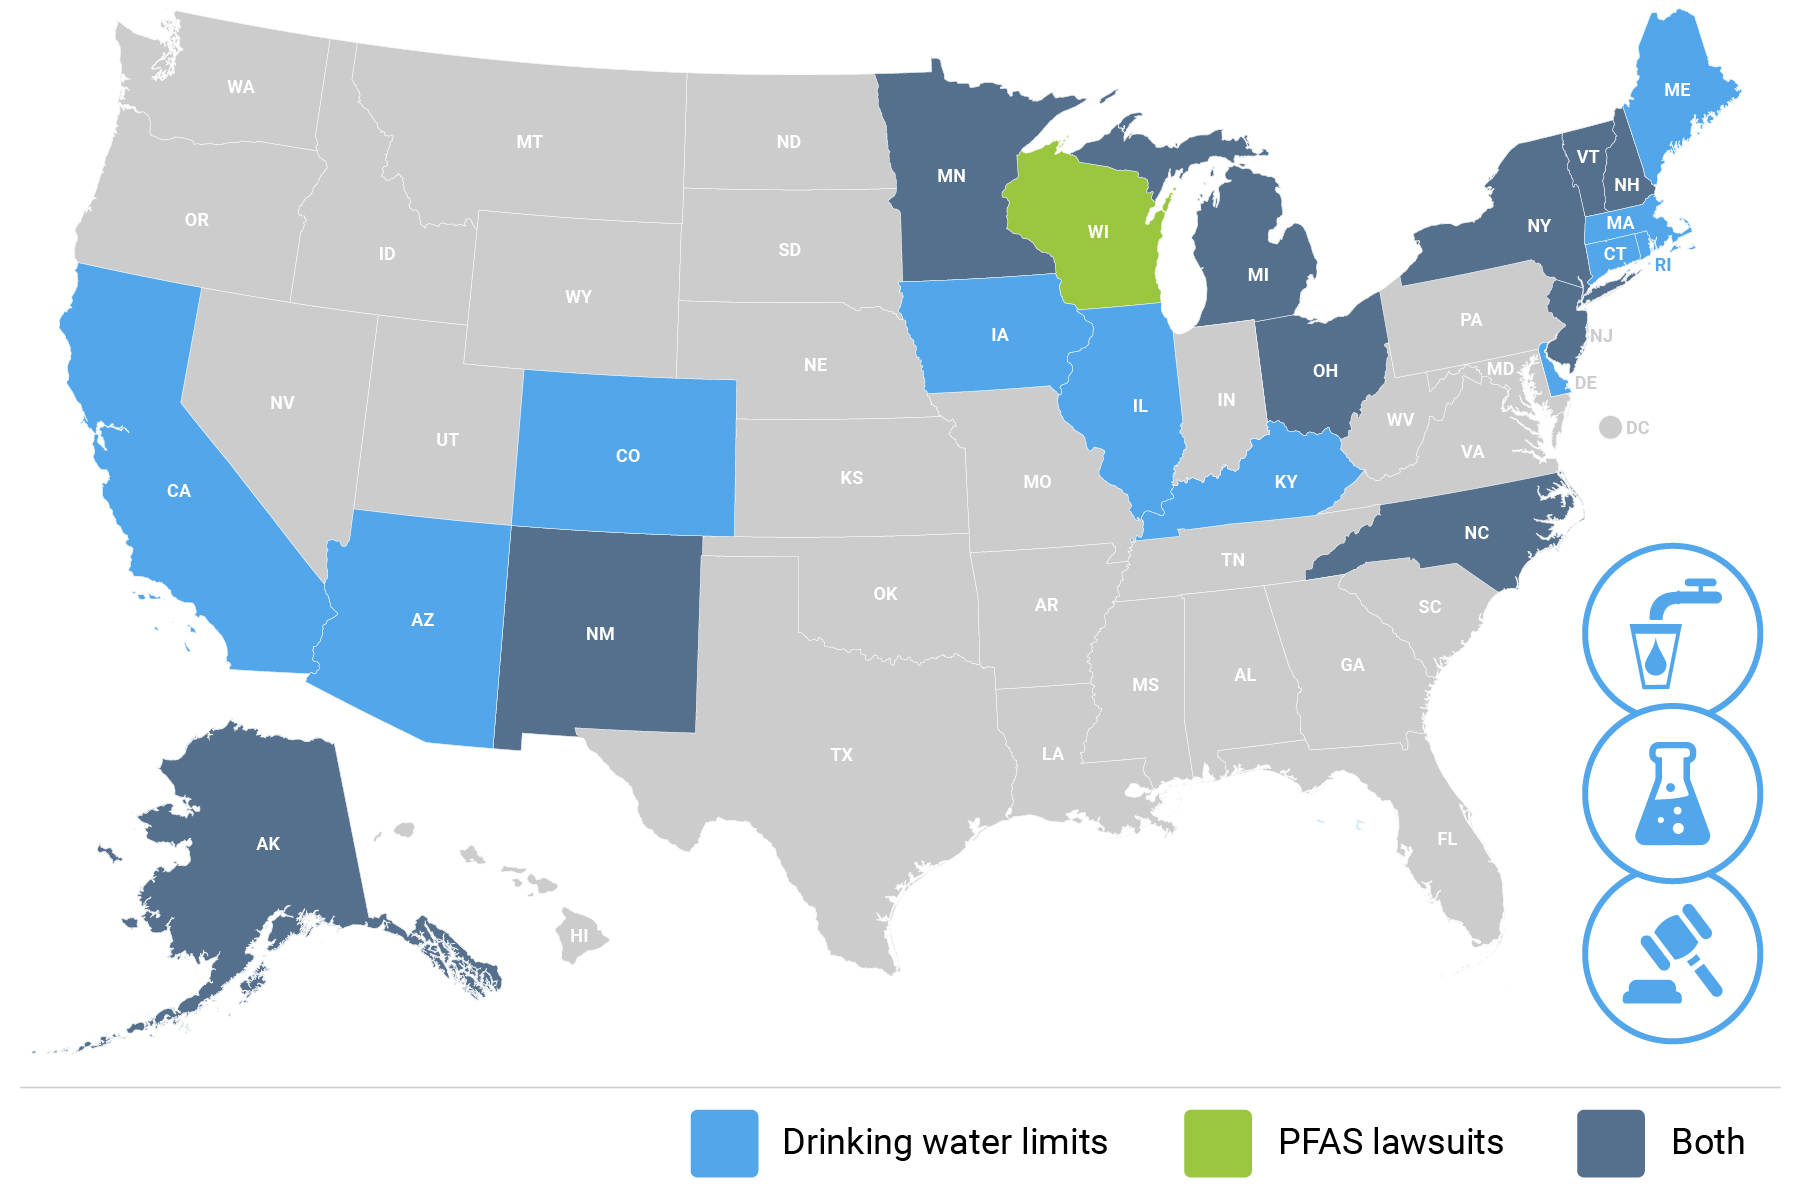
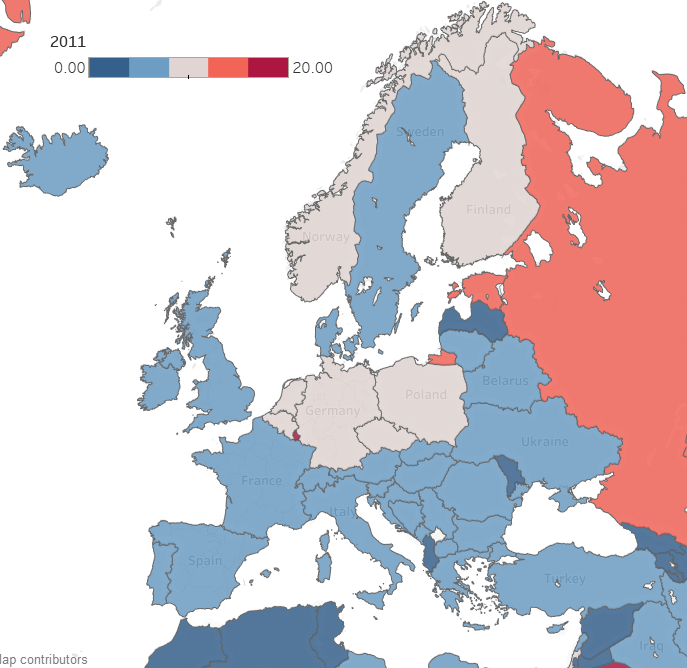
Now consider making a map with countries color coded by emissions. Again, for each country, the map reduces multiple numbers to a single color for that country on the map. You can compare country colors more easily than columns of numbers.

A dashboard that combines multiple visualizations further enhances data analysis. Imagine a dynamic dashboard showing you both the emissions chart and map described above. If you select a country on the map, the chart can highlight the line for that country, so you compare its emissions to other countries over time. Similarly, if you select a line on the chart for a specific country, the map can highlight the selected country to show how its emissions compare to nearby countries. This interactivity lets you drill into your data more effectively than using either the chart or the map by itself.

Here are three examples of effective dashboards that are available online:

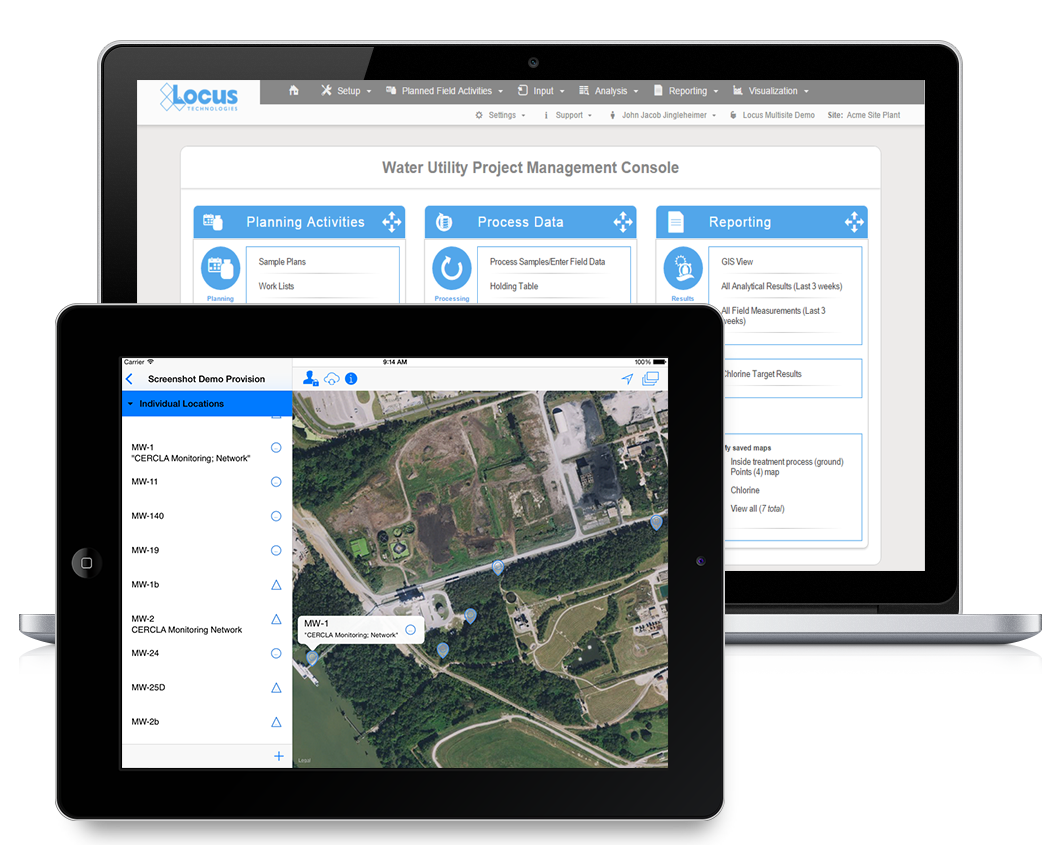
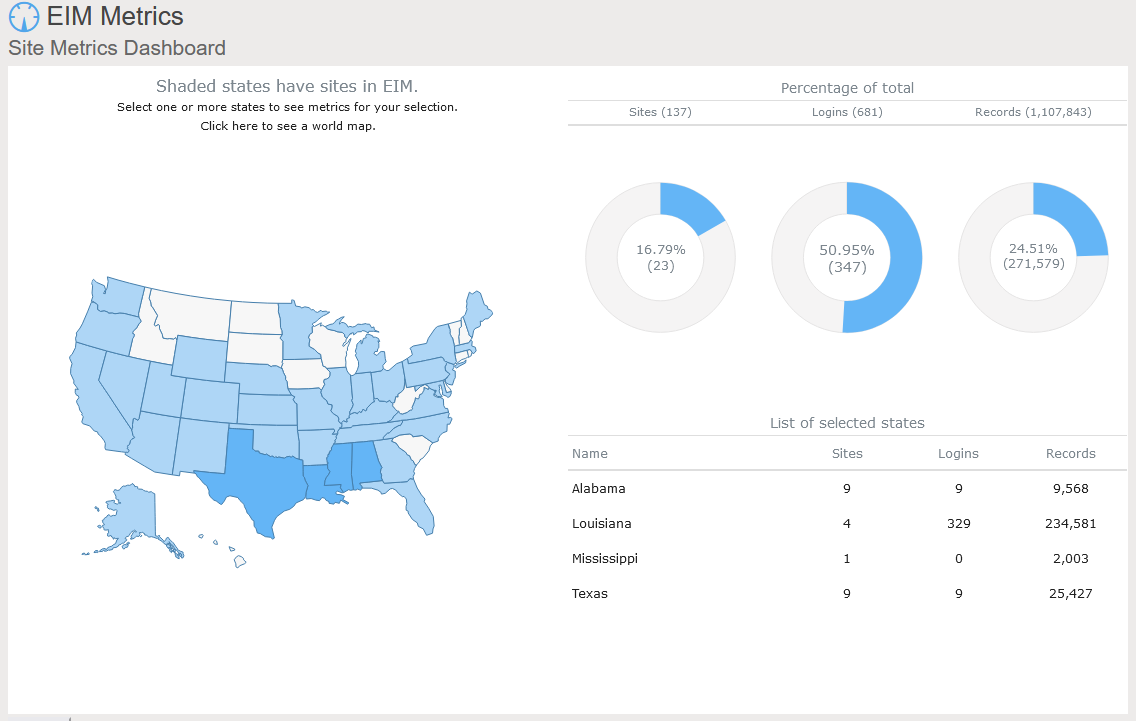
Locus includes data dashboards in our applications. One example is the Site Metrics dashboard in EIM, Locus’s cloud-based, software-as-a-service application for environmental data management. The Site Metrics dashboard lets you perform roll-up queries across your portfolio of sites. A map on the dashboard shows all states with active sites. If you select one or more states, the dashboard updates the charts and tables on the right to show total sites, user logins, and record counts. Other dashboards can support showing sample locations of certain chemicals or counts of regulatory limit exceedances.

A further example comes from the Locus Environmental Social and Governance (ESG) application. ESG metrics are becoming increasingly important measures for an organization’s performance. Data dashboards can help companies quickly visualize trends in their ESG metrics using intuitive mapping tools.

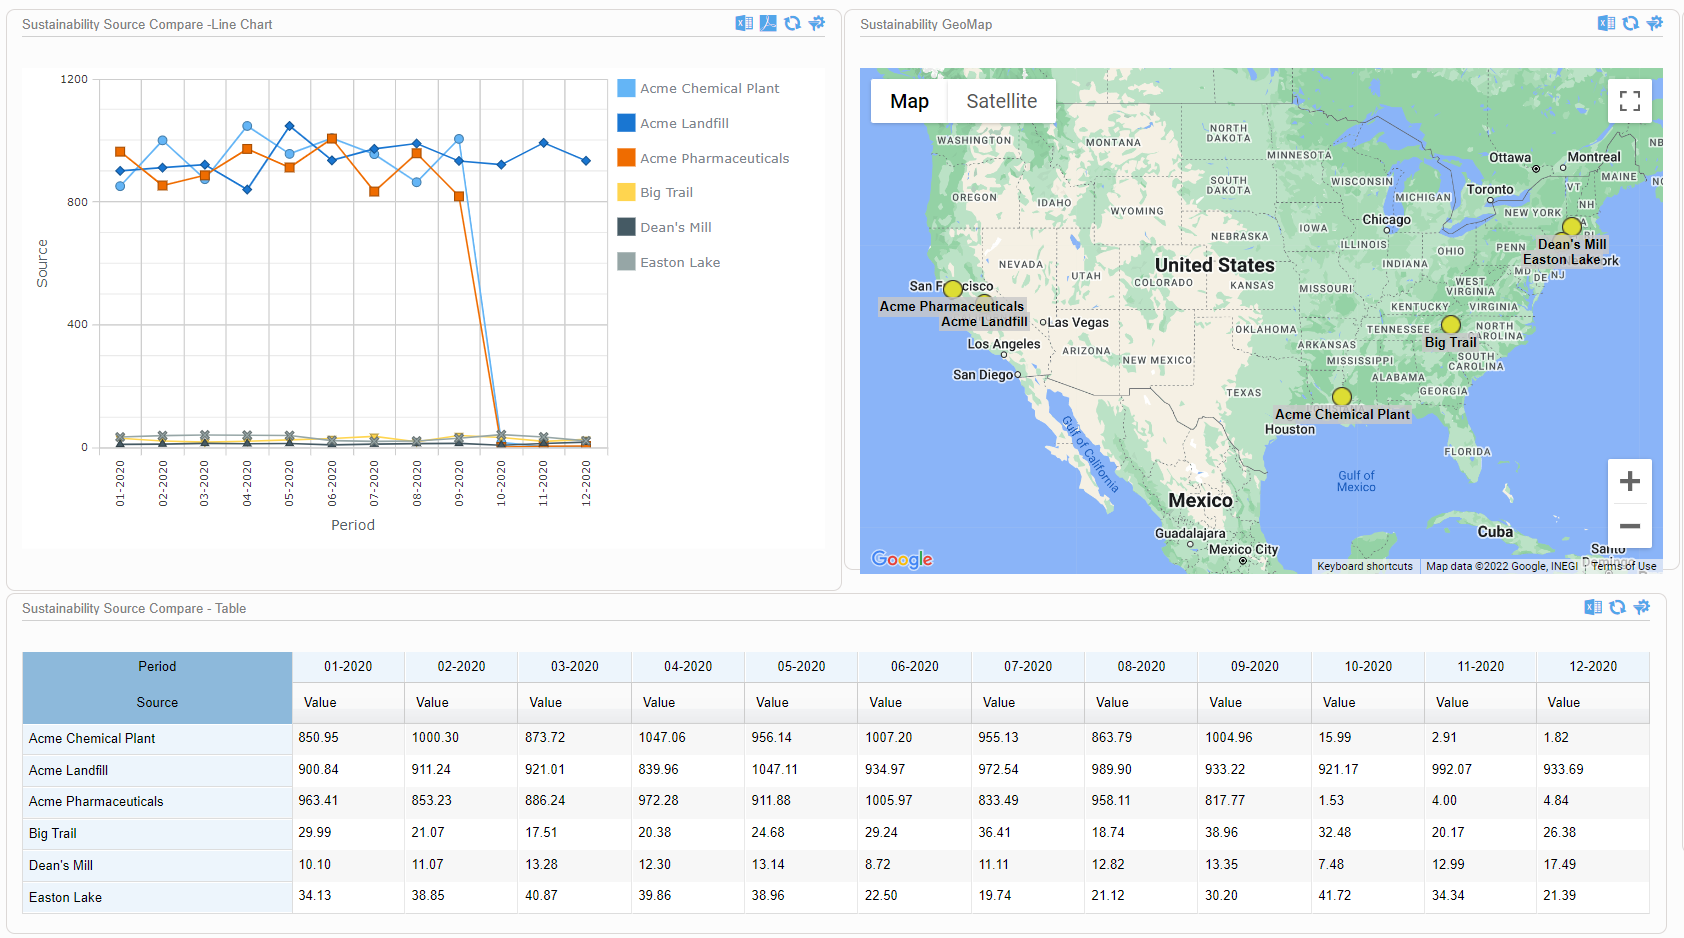
This dashboard illustrates both spatial and time trends and provides the raw data necessary for auditability and transparent decision making. Having these features on a single combined view provides users with instant access to the key inputs for ESG prioritization, planning, and project implementation.

As these examples from Locus show, data dashboards with integrated mapping are important tools for maximizing the value of your collected environmental and ESG data. For any dataset with a geographic component, it’s important to incorporate mapping elements in the outputs, to highlight trends and patterns that may not otherwise be visible in a chart or table. Modern software can combine these output formats in a way that tells the story shown by your data.


Interested in Locus’ GIS solutions?

Locus GIS+ features all of the functionality you love in EIM’s classic Google Maps GIS for environmental management—integrated with the powerful cartography, interoperability, & smart-mapping features of Esri’s ArcGIS platform!

[sc_button link=”https://www.locustec.com/applications/gis-mapping/” text=”Learn more about Locus’ GIS solutions” link_target=”_self” color=”#ffffff” background_color=”#52a6ea” centered=”1″]


[sc_image width=”150″ height=”150″ src=”16303″ style=”11″ position=”centered” disable_lightbox=”1″ alt=”Dr. Todd Pierce”]

About the Author—Dr. Todd Pierce, Locus Technologies

Dr. Pierce manages a team of programmers tasked with development and implementation of Locus’ EIM application, which lets users manage their environmental data in the cloud using Software-as-a-Service technology. Dr. Pierce is also directly responsible for research and development of Locus’ GIS (geographic information systems) and visualization tools for mapping analytical and subsurface data. Dr. Pierce earned his GIS Professional (GISP) certification in 2010.

The Past, Present, and Future of EHS & ESG

To celebrate a milestone 25 years of success in EHS and ESG software development, we sat down with Locus President, Wes Hawthorne for a brief discussion. In this post, we ask him a series of questions highlighting the past, present and future of EHS and ESG.

1. What are the greatest challenges that environmental professionals are facing?

One of the persistent challenges we’ve seen for the past 25 years is that the responsibilities of environmental professionals are continually expanding. Previously, almost all environmental work was localized, with facility-level permits for air, water, waste, etc. That has expanded over the years to include new regulations and reporting requirements for sustainability, social metrics, and other new compliance areas, while the old facility-level programs still continue. This has led to more pressure on environmental managers to keep up with these programs, and increased reliance on tools to manage that information. That’s where Locus has always focused our effort, to make that ever-expanding workload more manageable with modern solutions.

2. What are the most interesting trends in EHS and ESG?

The current flood of interest in ESG is certainly notable as far as bringing corporate attention to the environmental field, as well as having requirements originate from the SEC here in the US. We have become accustomed to managing oversight from multiple regulatory bodies at the local, state, and federal level, but SEC would be a newcomer in our line of work. Their involvement will be accompanied by a range of new requirements that are common for the financial world, but would be unfamiliar to environmental staff.

Across other EHS fields, we are seeing increased demand for transparency in EHS functions. Overall, this is a positive move, as it brings more attention to EHS issues and develops a better EHS culture within organizations. But this also drives the need for better tools to make EHS information readily available across all levels of the organization.

3. What are the most disruptive technologies available today?

As far as technologies, the ones most likely to have significant impact in the environmental field are ones that don’t require a significant capital investment. Although there are definitely some practical advantages to installing smart monitoring devices and other new technologies, procuring the funding for those purchases is often difficult for environmental professionals. Fortunately, there are still many technologies that have already been implemented successfully in other fields, but only need to be adapted for environmental purposes. Even simple changes like using web-based software in place of spreadsheets can have a huge impact on efficiency. And we haven’t yet seen the full impact of the proliferation of mobile devices on EHS functions. We are still working on new ways to take advantage of mobile devices for data collection, analysis, and communication purposes.

4. What do you think are the biggest innovations of the last 25 years in our field?

We’ve seen a number of innovation milestones in the past 25 years, and while we didn’t invent SaaS, we’ve been largely responsible for adapting it and perfecting it for environmental purposes. One of the major innovations we’ve integrated into our products include online GIS tools where users can easily visualize their environmental data on maps without expensive desktop software. Another one was our fully configurable software platform with built-in form, workflow, and report builders tailored for environmental purposes, which allows anyone to build and deploy environmental software applications that exactly match their needs. There have been many other innovations we’ve incorporated into our software, but these two stand out as the most impactful.

5. Where do you see Environmental and ESG reporting in the future?

More and more, we are seeing all types of reporting being converted into pure data exchanges. Reports that used to include regulatory forms and text interpretations are being replaced with text or XML file submittals. This transition is being driven largely by availability of technology for EHS professionals to generate and read these files, but it is also promoted by regulatory agencies and other stakeholders receiving these reports. Stakeholders have less time to read volumes of interpretive text, and are becoming more skeptical of potential bias in how facts are presented in text. These are driving the need for more pure data exchanges, with increasing emphasis on quantifiable metrics. These types of reports are also more readily compared against regulatory or industry standards. For reporters, lengthy corporate reports with volumes of text and graphics are becoming less common, and the success of an organization’s programs will be increasingly reliant on robust data sets, since ultimately only the data will be reported.

6. What has been the key reason for Locus’ success for the past 25 years?

There are actually a few that immediately come to mind. One reason is the nature of our continually evolving products. By providing our solutions as SaaS, our software adapts with new environmental requirements, and with new technologies. If our software was still the same as it was 25 years ago, it simply wouldn’t be sufficient for today’s requirements. Since our software is updated multiple times each year, it is difficult to notice the incremental changes, but they can be readily seen if you compare today’s software with the original in 1997. And we’re committed to continuing the development of our products as environmental needs change.

The other primary reason for our success is our excellent staff and the environmental expertise we bring to our customers. We simply could not provide the same level of support without our team of environmental engineers, scientists, geologists, chemists, and an array of others. Having that real-world understanding of environmental topics is how we’ve maintained customer relationships for multiple decades. And our software only has value because it is maintained and operated by staff who appreciate the complexity and importance of environmental work.


Locus President Wes Hawthorne meets with Locus Platform dev team 2016Mr. Hawthorne has been with Locus since 1999, working on development and implementation of services and solutions in the areas of environmental compliance, remediation, and sustainability. As President, he currently leads the overall product development and operations of the company. As a seasoned environmental and engineering executive, Hawthorne incorporates innovative analytical tools and methods to develop strategies for customers for portfolio analysis, project implementation, and management. His comprehensive knowledge of technical and environmental compliance best practices and laws enable him to create customized, cost-effective and customer-focused solutions for the specialized needs of each customer.

Mr. Hawthorne holds an M.S. in Environmental Engineering from Stanford University and B.S. degrees in Geology and Geological Engineering from Purdue University. He is registered both as a Professional Engineer and Professional Geologist, and is also accredited as Lead Verifier for the Greenhouse Gas Emissions and Low Carbon Fuel Standard programs by the California Air Resources Board.

Want to discuss EHS and ESG solutions with our product specialists? Contact us today!

    Name

    Company Email

    Phone

    Tell us about your company's needs

    Locus is committed to preserving your privacy.

    Artificial Intelligence & Blockchain Applied to Water & Energy


    There are two promising technologies that are about to change how we aggregate and manage EHS+S data: artificial intelligence (AI) and blockchain. When it comes to technology, history has consistently shown that the cost will always decrease, and its impact will increase over time. We still lack access to enough global information to allow AI to make a significant dent in global greenhouse gas (GHG) emissions by merely providing better tools for emissions management. For example, the vast majority of energy consumption is wasted on water treatment and movement. AI can help optimize both. Along the way, water quality management becomes an add-on app.

    AI is a collective term for technologies that can sense their environment, think, learn, and act in response to what they’re detecting and their objectives. Possible applications include (1) Automation of routine tasks like sampling and analyses of water samples, (2) Segregation of waste disposal streams based on the waste containers content, (3) Augmentation of human decision-making, and (4) Automation of water treatment systems. AI systems can greatly aid the process of discovery – processing and analyzing vast amounts of data for the purposes of spotting and acting on patterns, skills that are difficult for humans to match. AI can be harnessed in a wide range of EHS compliance activities and situations to contribute to managing environmental impacts and climate change. Some examples of applications include permit interpretation and response to regulatory agencies, precision sampling, predicting natural attenuation of chemicals in water or air, managing sustainable supply chains, automating environmental monitoring and enforcement, and enhanced sampling and analysis based on real-time weather forecasts. Applying AI in water resource prediction, management, and monitoring can help to ameliorate the global water crisis by reducing or eliminating waste, as well as lowering costs and lessening environmental impacts. A similar analogy holds for air emissions management.

    The onset of blockchain technology will have an even bigger impact. It will first liberate data and, second, it will decentralize monitoring while simultaneously centralizing emissions management. It may sound contradictory, but we need to decentralize in order to centralize management and aggregate relevant data across corporations and governmental organizations without jeopardizing anyone’s privacy. That is the power of blockchain technology. Blockchain technology will eliminate the need for costly synchronization among stakeholders: corporations, regulators, consultants, labs, and the public. What we need is secure and easy access to any data with infinite scalability. It is inevitable that blockchain technology will become more accessible with reduced infrastructure over the next few decades. My use of reduced architecture here refers to a replacement of massive centralized databases controlled by one of the big four internet companies using the hub-and-spoke model concept with a device-to-device communication with no intermediaries.


    This post was originally published in Environmental Business Journal in June of 2020.

    Locus Technologies Celebrates 25 Years of Innovative EHS & ESG Software

    Locus looks back on the last 25 years of pioneering EHS, ESG, and water quality software.

    MOUNTAIN VIEW, Calif., 11 April 2022Locus Technologies, the leading EHS Compliance and ESG software provider, today celebrates the 25th anniversary of its founding, and with it, a quarter-century of customer success. Locus looks back on its founding as a Silicon Valley leader in EHS & ESG software with pride in its leadership through expertise, stability, and innovation. 

    Locus was founded in 1997 with a revolutionary vision that set the framework for what is now widely known as environmental, social, and corporate governance (ESG) and environmental, health, and safety (EHS). Locus envisioned a simplified and data-driven approach, offering software in the cloud, on mobile devices, and as a service. The company pioneered SaaS (Software as a Service) model in EHS, ESG, and water quality management spaces in 1999 and never installed its software on customers’ premises. 

    Over 25 years, Locus has pioneered cloud environmental solutions, online and mobile GIS (Geographic Information System) services, has revolutionized environmental information management, and AI and IoT technologies for organizations ranging from Fortune 500 companies to forward-facing municipalities and the US Government. 

    Locus recently broke new ground by releasing the first Visual Calculation Engine for ESG Reporting. Locus’s visual calculation engine helps companies quickly set up and view their entire ESG data collection and reporting program, enabling full transparency and financial-grade auditability throughout the entire process. 

    As the industry continues to evolve, competitors merge and disappear. New markets emerge and grow. Locus remains a constant in the environmental space, an innovative and independent pioneer. 

    “For 25 years now, Locus has brought together industry-leading experts in EHS, sustainability, and technology. Although regulations and requirements have changed over the years, that combination remains at the core of what Locus does, as demonstrated by our stability and long-term customer partners. We look forward to continuing our path of growth using those same values for the next 25 years.” said Wes Hawthorne, Locus President.  

    Locus Founder and CEO, Neno Duplan is proud to look back on the growth of Locus over the last 25 years. He said, “Locus did not start in the clouds, but back in 1997, we had a rather good view. Locus’s vision for better global environmental stewardship has not changed since its inception. We focus on empowering organizations to track better and mitigate the environmental impact of their activities. That vision has come to fruition through the Locus software services used by some of the world’s largest companies and government organizations. Locus’ SaaS has been ahead of the curve in helping private and public organizations in not only managing their water quality, EHS compliance or ESG reporting but also turning their environmental information into a competitive advantage in their operating models.” 

    Locus Technologies Receives 16th Consecutive EBJ Award for Information Technology in ESG

    Environmental Business Journal (EBJ) recognized Locus for ESG software growth and innovation.

    MOUNTAIN VIEW, Calif., 24 February 2022 — Locus Technologies, the leading EHS Compliance and ESG software provider, was awarded a 16th consecutive award from Environmental Business Journal (EBJ) for growth and innovation in the field of Information Technology in the environmental software with particular focus on ESG.

    EBJ is a business research publication providing strategic business intelligence to the environmental industry. Locus received the 2021 EBJ Award for Information Technology by growing and innovating its unified EHS compliance and ESG software platform.

    In 2021 Locus took a leading market position in the fast-growing space of ESG software. Locus’s ESG SaaS covers carbon data aggregation via a powerful visual calculation engine, investor-grade emissions calculations audit capabilities, reporting to multiple standards from a single data set, integration APIs, dashboards, and carbon reduction goal setting and tracking. This separates Locus from competitors as customers demand integrated net-zero ESG software that supports investor-grade data in disclosure rules such as the EU’s corporate sustainability reporting directive, mandatory TCFD reporting, and anticipated SEC action on climate disclosures.

    In 2021 Locus continued to expand its ESG SaaS to include built-in business intelligence tools allowing for interactive, actionable insights into EHS and ESG data, forecasting tools to predict future ESG reporting, APIs linking to utility meters, and interfaces with other Locus and third-party systems that house ESG data. Locus’s ESG application is focused on “enter once, report many times.” The gold standard for multinational enterprises with many locations worldwide is to have a system configured to report to multiple organizations and many standards from a single dataset. Essential built-in reporting in the Locus ESG app includes state or federal regulations, internal CSR, and ESG based on whatever standard their organization adheres to, such as CDP, GRI, SASB, TCDF, or more recent World Economic Forum (WEF) attempt to standardize many voluntary standards.

    Locus also expanded its ESG consulting expertise by becoming the first and only software provider to offer accreditation services under new Oregon DEQ guidelines requiring third-party verification for GHG and CFP programs.

    Besides strong growth in ESG space, Locus also continues to lead the software for water quality management market with the addition of new SaaS customers in 2021, such as the City of Hillsboro, Oregon for water quality management and Westinghouse Electric Company for control of environmental and radionuclides data, cementing Locus’s market leader position in the space of nuclear facilities.

    “Locus’s investment in integrated carbon management software and EHS compliance is paying off. As one of the early SaaS leaders in net-zero digital solutions for ESG reporting, Locus continues to provide value to companies that want to be credible with their carbon reporting and sustainability software.,” said Grant Ferrier, president of Environmental Business International Inc. (EBI), publisher of Environmental Business Journal.

    “We would like to thank EBJ for recognizing Locus for a 16th consecutive year and for taking note of our industry-leading ESG software. We aim to continue expanding our software offerings to customers in 2022,” said Wes Hawthorne, President of Locus Technologies.

    5 Major Signs That You Need to Replace Your Water Data Management Software

    In providing water quality data management software to organizations serving millions of customers a day, our experts have found some common red flags in alternative solutions. Many alternatives to Locus are more prohibitive than helpful, leading to more issues than they should. Your organization deserves to reduce the stress of data entry, regulatory and voluntary reporting, and more. Here are the top 5 signs that your organization is using outdated water quality software:

    1. You’re transcribing data more than once or still using paper forms.

    In order to ensure the highest level of data quality, you should not be risking human error at multiple levels. Enter your data once, and have it audit-ready, set to go on regulatory and voluntary reports, which are created directly from Locus Software.

    2. Product support is not helmed by specialists who support you adequately after implementation.

    Support doesn’t end after implementation. What we often hear from our customers when they switch from other providers is that they are delighted with the level of support that Locus brings with our software. Locus is proud to have the expertise and experience to back our software, and if there is anything you need, you can be sure that Locus support can get it done smoothly.

    3. Your software has regular or unexpected downtimes.

    You need reliability. Your software should be available to you on-demand. Locus is proud to be the only environmental software developer to publicly share our uptime, which is over 99.9%. If you are experiencing downtimes at inconvenient times or for long periods, you should switch.

    4. It’s not mobile-enabled.

    Field collection is key for most organizations managing water quality data. You should be able to enter that data into your system once, and from anywhere, reducing errors and extra time doing the same work twice (or more!). Also, being able to access historical data at your fingertips can help you solve problems on the fly.

    5. It doesn’t provide actionable insights.

    Sure, you may have all of your data collected, but what are you doing with it? If your software is not giving you meaningful findings from analyzing your data, then you are always going to be playing catch-up. Having the tools to help your organization look forward is essential in selecting water data management software.

    Want to learn more about our Water Data Management Solution? Reach out to our product specialists today!

      Name

      Company Email

      Phone

      Tell us about your company's needs

      Locus is committed to preserving your privacy.

      The Convergence of Augmented Reality and GIS

      Today is GIS Day, a day started in 1999 to showcase the many uses of geographical information systems (GIS). Earlier blog posts by Locus Technologies for GIS day have shown how GIS supports cutting-edge visualization of objects in space and over time. This year’s post explains how GIS supports augmented reality.

      Augmented reality (AR) is a technology that enhances how we experience the real world by overlaying your surroundings with computer-generated objects. It differs from virtual reality (VR) because in VR, everything you see is computer generated, but in AR, the majority of what you see is real – your experience of reality is enhanced (augmented) but not totally replaced.

      You are probably familiar with one AR application already if you watch American football. The ‘virtual’ first down line that appears on field before each play is projected there by computer and is not really painted on the field. If you follow soccer (or football to the rest of the world), AR is used by a Video Assistant Referee (VAR) to objectively determine tight offsides decisions. Digital lines are drawn across the field to show whether or not attackers are illegally past the last defender or not. Another AR example is the popular game Pokémon Go that shows cute virtual creatures in your living room or your front yard.

      To experience AR, you need something to project the non-real objects onto your view of the world. Many AR applications use mobile phones or other devices. An AR application uses the camera view to show you the world around you and then overlays virtual objects onto the view. Other devices such as head mounted displays, ‘smart glasses’, or even ‘bionic contact lenses’ can use AR, but have not been as popular as phones or other mobile devices. In contrast to AR, VR cannot be fully supported with just a mobile device and usually requires headsets to immerse you in a virtual world. Because of this need, AR is much less intrusive than VR is.

      Countless other examples of AR already exist in many fields. A few selected applications include:

      • Online shoppers at some e-commerce sites can use smart devices to project furniture into their home to see how the pieces look before making a purchase.
      • Some clothing stores can project clothing onto shoppers’ bodies to check appearance without having to change clothes. These applications require the user to be in a special dressing booth with full body scanning capabilities.
      • Urban planners use AR to display how planned buildings, cell towers, wind turbines, and other structures would look in the existing space. Planners can walk the streets and view how proposed projects would alter the existing cityscape.
      • AR is used in manufacturing to display operation and safety instructions in a worker’s field of vision using head mounted displays, which circumvents the need to refer to bulky paper manuals.
      • Utility managers can see underground pipelines, water lines, sewer pipes, electrical lines, and other infrastructure projected below their feet.

      So how does GIS relate to AR? There are three main uses of GIS in AR:

      • Location: Any AR application must know where the user is and where to place virtual objects. In most cases, full GIS capabilities are not needed; instead, the application accesses a GPS (global positioning system) to find locations. Consider the Pokémon Go application mentioned before. The game knows where the various Pokémon need to appear. When a user plays the game, it uses GPS to find the user, and then shows any Pokémon that are near the user based on their locations.
      • Layers: An AR application may need to show features that are not visible to the user, such as underground electrical lines, earthquake fault lines, property lines, or planned buildings. All these features can be stored as GIS map layers in the cloud and then displayed in the AR application as virtual overlays projected on the real world. Furthermore, a user could select a displayed item and view related attribute information in the GIS layer. For example, a user could view the condition, age, and repair status of a selected water pipeline.
      • Navigation: An AR application may also need to help a user get from point A to point B, for example in a crowded airport or in a large warehouse. Such navigation could be facilitated by showing virtual route markers and arrows on the real world.

      Locus has been exploring environmental uses of AR and GIS by adding AR to Locus Mobile, which is the Locus app for collecting field data, completing EHS audits, tracking waste containers, and completing other tasks requiring users to gather data out of the office. Locus Mobile now features an AR mode to assist users when taking field samples. When the user activates AR mode, the app uses the camera to show the user’s immediate area. The app then puts multiple virtual markers on the display corresponding to sampling points located in that direction. As the user moves or rotates the phone to change the viewing area, the markers change to reflect the locations in the user’s line of sight. Clicking a marker provides more information including the location name and the distance from the user.

      Locus Mobile uses all three ways to combine GIS with AR:

      • By using GPS to find the user’s location and the locations of nearby sampling points.
      • By using GIS to display the layer of sampling points.
      • By using GIS to assist with navigation to sampling points by showing distance and direction.

      Here is a sample image from Locus Mobile showing three nearby sampling locations along with information about past events or measurements at the locations. The three blue banners are the augmented reality displayed on top of the view of the nearby surroundings.

      Locus Augmented Reality

      By using GIS and AR to assist users in finding sampling points, Locus Mobile makes field personnel more productive. Samplers can find field locations quickly and can easily pull up related information. Locus continues to explore using AR to expand the functionality of its environmental applications.


      Interested in Locus’ GIS solutions?

      Locus GIS+ features all of the functionality you love in EIM’s classic Google Maps GIS for environmental management—integrated with the powerful cartography, interoperability, & smart-mapping features of Esri’s ArcGIS platform!

      [sc_button link=”https://www.locustec.com/applications/gis-mapping/” text=”Learn more about Locus’ GIS solutions” link_target=”_self” color=”#ffffff” background_color=”#52a6ea” centered=”1″]


      [sc_image width=”150″ height=”150″ src=”16303″ style=”11″ position=”centered” disable_lightbox=”1″ alt=”Dr. Todd Pierce”]

      About the Author—Dr. Todd Pierce, Locus Technologies

      Dr. Pierce manages a team of programmers tasked with development and implementation of Locus’ EIM application, which lets users manage their environmental data in the cloud using Software-as-a-Service technology. Dr. Pierce is also directly responsible for research and development of Locus’ GIS (geographic information systems) and visualization tools for mapping analytical and subsurface data. Dr. Pierce earned his GIS Professional (GISP) certification in 2010.

      PFAS Drinking Water Regulations by State

      Are stricter PFAS standards coming your way?

      PFAS chemicals were first invented in the 1930s and have since been used in several applications from non-stick coatings to waterproof fabrics to firefighting foams. In recent years, PFAS studies and research funding have increased remarkably, but as of right now the EPA has yet to implement regulations on the chemicals. Many states have leapfrogged the EPA by implementing regulations on PFAS use, safe PFAS levels in drinking water, and by suing manufacturers of PFAS chemicals. This creates a complex set of regulatory requirements, depending on where you operate.

      Updated August 30, 2021

      PFAS Lawsuits and Drinking Water Limits in US

      Locus offers software solutions for PFAS management and tracking. Our EHS software features tools to manage multiple evolving regulatory standards, as well as sample planning, analysis, validation, and regulatory reporting—with mobile and GIS mapping functionality. Simplify tracking and management of PFAS chemicals while improving data quality and quality assurance. With future PFAS regulations being an inevitability, the time is right to adopt a software that can track and manage these and other chemicals.

      Contact us to see Locus’ PFAS management solution

        Name

        Company Email

        Phone

        Tell us about your company's needs

        Locus is committed to preserving your privacy.

        Water Quality in the Cloud with Neno Duplan

        Locus Technologies founder and CEO Neno Duplan provides a wealth of experience on water quality in the cloud. Neno began cloud-based data work before any of us knew what the cloud even was. He does a great job explaining the steps needed to undertake and the significant benefits of a cloud-based digital transformation, and much more!

        Streamline and Simplify Annual CCR Preparation

        Locus water quality software is designed for water system owners and operators to simplify the sampling, management, tracking, and regulatory reporting of drinking water data. The built-in CCR module streamlines a complex and often tedious process of preparing the annual calculations required for the report, which is a win-win for the water systems and consumers.

        Locus CCR Prep | Consumer Confidence Reports

        Screenshot of EIM water utility dashboard and mobile app for locations

        Contact us to see a demo of the Drinking Water app

          Name

          Company Email

          Phone

          Tell us about your company's needs

          Locus is committed to preserving your privacy.